
Small-Cap Growth Works in India: 13.44% CAGR, Top Performer Globally
NSE small-cap growth stocks: 13.44% CAGR over 25 years, +5.59% excess vs SPY, +1.38% vs Sensex. India is the top outperformer in a 14-exchange study. The size premium survives where analyst coverage is thin.

The small-cap growth premium is dead in the US. We showed that in a separate post: 25 years of data, 36% win rate, -2.63%/yr. The story in India is completely different.
Contents
- What We Tested
- What We Found
- Annual Returns: 25 Years
- India vs SPY: The Global Picture
- Why the Premium Survives
- When It Fails
- The Local Benchmark Perspective
- Limitations
- Run It Yourself
- Takeaway
- References
NSE small-cap growth stocks returned 13.44% CAGR from 2000 to 2024, against a Sensex benchmark of 12.06%. $10,000 became $233,720. The premium over the local benchmark is +1.38%/yr — thin, but real across 25 years. The more interesting number is the down capture: -28.8%. When the Sensex fell, this portfolio averaged a positive return. That's a structural feature of how Indian small-caps behave during domestic market stress.
Data: FMP financial data warehouse, 2000–2025. Updated March 2026.
What We Tested
The strategy selects small-cap Indian stocks with demonstrated revenue momentum:
- Market cap: ₹1 billion to ₹40 billion (small-cap range, 5%-200% of exchange threshold)
- Revenue growth: >15% year-over-year (fiscal year)
- Profitability: Net income > 0
- Leverage: Debt-to-equity < 2.0
- Selection: Top 30 by revenue growth, equal-weighted
- Rebalancing: Annual in July, 45-day filing lag
- Benchmark: Sensex (BSE 30 index, local currency)
Universe covers NSE only. We excluded BSE from this run to avoid double-counting: approximately 38% of NSE stocks are dual-listed on BSE, and including both exchanges inflates the stock count without adding unique companies. Data from the FMP financial data warehouse, 2000-2024. Full methodology: METHODOLOGY.md.
Run the stock selection query yourself: cetaresearch.com/data-explorer?q=RrUdGMWmws
What We Found
The strategy beat Sensex in 12 of 25 years, a 48% win rate. Despite winning fewer than half the years, it generated +1.38% annual excess return. The math works because the positive excess years are large and the negative excess years are smaller on average.
The down capture of -28.8% requires explanation. In the 6 years when Sensex had negative returns (2000, 2001, 2007, 2011, 2015, 2019), the portfolio averaged +2.9% while Sensex averaged -10.0%. A negative down capture means the portfolio earned positive returns on average when the benchmark fell. Two mechanisms drive this:
First, the cash periods. In 2000 and 2001, the Indian small-cap universe didn't have enough qualifying stocks to build a 30-stock portfolio. The strategy held 0%, which beat Sensex's -29.3% (2000) and -4.1% (2001) significantly. Second, the 2015 result. Sensex fell -2.4% while the portfolio gained +49.2%. The RBI rate cut cycle from 2015-2016 supercharged domestic small-cap companies: banks, NBFCs, consumer goods companies, and industrial names all re-rated sharply.
The 5 cash periods (2000-2004) align with an era when the Indian small-cap universe was thin. Profitable, growing companies with low leverage meeting all the criteria were scarce. This natural defensive mechanism means the strategy exits the market when quality opportunities dry up.
Average portfolio size across active years: 16.9 stocks. Below the target 30, reflecting a universe that's genuinely selective at the quality tier tested.
Annual Returns: 25 Years
| Year | Strategy | Sensex | Excess |
|---|---|---|---|
| 2000 | 0% (cash) | -29.3% | +29.3% |
| 2001 | 0% (cash) | -4.1% | +4.1% |
| 2002 | 0% (cash) | +9.6% | -9.6% |
| 2003 | 0% (cash) | +35.2% | -35.2% |
| 2004 | 0% (cash) | +49.4% | -49.4% |
| 2005 | +25.3% | +47.0% | -21.7% |
| 2006 | +44.3% | +37.1% | +7.2% |
| 2007 | -7.0% | -6.8% | -0.2% |
| 2008 | -11.8% | +7.3% | -19.1% |
| 2009 | +95.1% | +19.1% | +76.0% |
| 2010 | -18.6% | +7.8% | -26.3% |
| 2011 | -17.7% | -7.5% | -10.1% |
| 2012 | -23.4% | +11.9% | -35.3% |
| 2013 | +61.1% | +32.8% | +28.4% |
| 2014 | +28.7% | +8.1% | +20.6% |
| 2015 | +49.2% | -2.4% | +51.6% |
| 2016 | +28.2% | +14.5% | +13.8% |
| 2017 | +5.7% | +13.0% | -7.3% |
| 2018 | -16.2% | +12.9% | -29.2% |
| 2019 | -7.2% | -10.0% | +2.8% |
| 2020 | +82.7% | +46.4% | +36.2% |
| 2021 | +26.9% | +1.4% | +25.5% |
| 2022 | +13.9% | +22.5% | -8.6% |
| 2023 | +79.8% | +21.8% | +58.0% |
| 2024 | +1.6% | +5.0% | -3.4% |
The cash years (2000-2004) generate positive excess because the Sensex fell in 2000 and 2001. But those same years cost the portfolio in 2002-2004 when Sensex returned +9.6%, +35.2%, and +49.4% while the portfolio held 0%.
The pattern that stands out: exceptional single-year outperformance in 2009 (+76%), 2015 (+51.6%), 2020 (+36.2%), and 2023 (+58.0%). These correspond to Indian recovery cycles: post-global-financial-crisis recovery (2009), the rate cut cycle (2015), post-COVID bounce (2020), and the 2023 domestic growth acceleration. In each case, the quality filter (profitable, growing, low-leverage) positioned the portfolio in companies that compounded capital fastest.
The failure years cluster around domestic macro stress: 2010-2012 (RBI tightening, INR weakness), 2018 (NBFC crisis), 2022 (rate hike cycle).
India vs SPY: The Global Picture
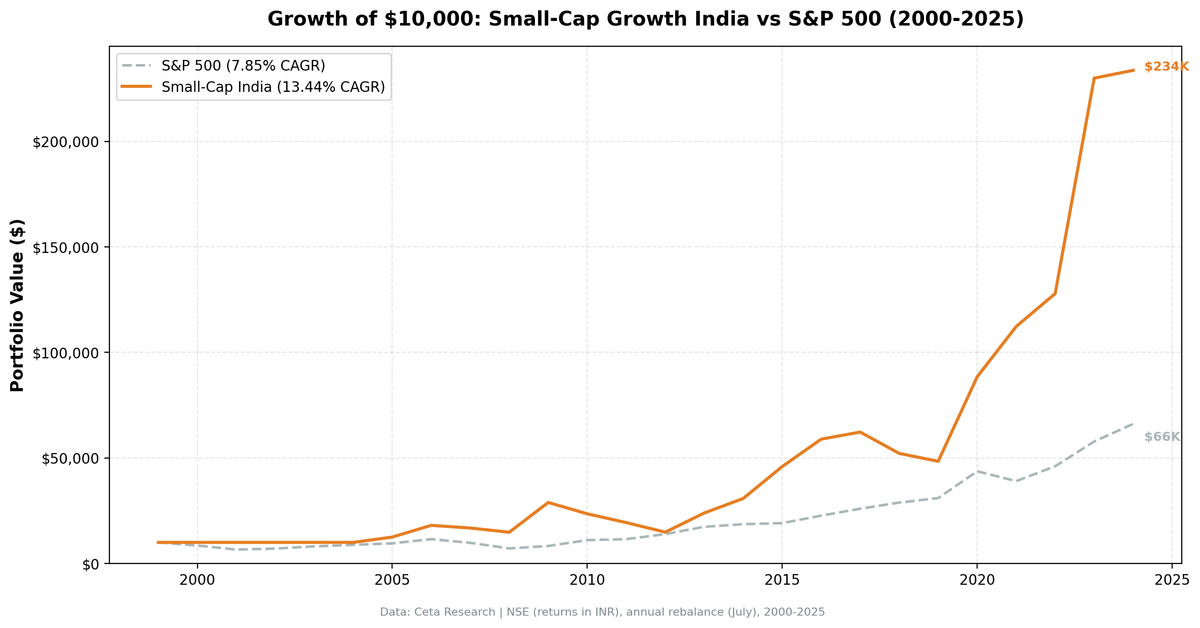
When compared to SPY (the S&P 500 ETF) as a global baseline, the India NSE strategy shows 13.44% CAGR against SPY's 7.85%, an excess of approximately +5.59%/yr. This makes it the highest-performing exchange in our 14-market study on a SPY-relative basis.
The primary driver is India's strong domestic market: the Sensex itself compounded at 12.06%/yr over 25 years. The strategy adds +1.38% on top of that. You're not just getting emerging market premium. You're getting India's structural growth story plus a quality filter that concentrates in the best-performing cohort.
The SPY comparison understates the risk: INR depreciated against USD over this period. A US investor's dollar-adjusted returns would be lower. The 13.44% CAGR is in INR.
Why the Premium Survives
The reason the premium works in India when it died in the US comes down to the same structural factors documented in the academic literature.
SEBI data shows average analyst coverage for NSE small-caps below 2 analysts per stock. Many qualifying companies have no coverage. With thin coverage, mispricings persist longer. A company growing revenue 25%/yr in a sector analysts don't follow can trade below intrinsic value for years.
India also has structural growth tailwinds that the size screen captures: formalization of the economy (small companies shifting from informal to formal sector), financial inclusion driving regional financial services, and domestic consumption expansion. The revenue growth filter selects companies capturing real structural market share, not cyclical noise.
Institutional capacity constraints matter too. Global EM funds can't allocate to small NSE companies without moving the price. Local institutional capital is constrained by mandates and capital availability. The result: mispricing persists longer than in developed markets.
When It Fails
The strategy's worst years cluster around domestic Indian macro stress. 2010-2012 was a consecutive three-year underperformance: -26.3%, -10.1%, -35.3% excess vs Sensex. That period saw RBI rate tightening, INR depreciation, and slowing credit growth for small businesses. Quality companies with revenue growth couldn't escape the macro headwind.
2018 (-29.2% excess) reflected the NBFC liquidity crisis: many small financial companies that met the revenue growth filter ran into credit market seizures that the screen couldn't detect in annual filings.
The Sharpe of 0.205 and MaxDD of -48.64% are real constraints. The strategy doesn't protect against domestic Indian downturns. What it avoids is global correlation: when US equities sell off for global reasons, Indian small-caps don't necessarily follow.
The Local Benchmark Perspective
When measured against Sensex (not SPY), the picture is more demanding. India's domestic equity market has compounded at 12.06%/yr over 25 years. Beating that by 1.38% isn't easy, and the 48% win rate shows it doesn't happen consistently.
The strategy's value comes from its concentration of upside: massive outperformance in 2009, 2015, 2020, and 2023 more than compensates for years of underperformance. A passive Sensex investor would have done well (12.06% CAGR). The small-cap growth screen adds a meaningful but not dramatic premium on top.
Limitations
- Currency risk: Returns are in INR. USD investors face additional FX volatility.
- Liquidity: NSE small-caps can be illiquid. Real execution at the prices implied by daily close data requires planning.
- Cash years: The 5 cash years (2000-2004) mean the full return history isn't comparable to a fully invested strategy. The portfolio effectively started in 2005.
- Filing timing: Indian annual reports can be filed later than the 45-day assumption. Some selection delay may exist.
- Exchange coverage: This run uses NSE only to avoid dual-listing duplicates. All results reflect NSE universe.
Run It Yourself
The live stock selection query is public: cetaresearch.com/data-explorer?q=RrUdGMWmws
Modify the revenue growth threshold or leverage filter directly in SQL. The query runs against the live FMP warehouse and returns current qualifying NSE stocks.
Takeaway
India is the top performer in our 14-exchange study when measured against SPY. The 13.44% CAGR over 25 years reflects both India's strong domestic growth (Sensex 12.06%) and a +1.38% premium from concentrated exposure to the highest-quality revenue growers.
The down capture of -28.8% vs Sensex is real: cash periods in early years and a standout 2015 result mean the strategy tends to hold its ground when the Sensex falls. The volatility is substantial, with a -48.64% MaxDD. You need to hold through stretches like 2010-2012.
The structural conditions that make the premium work, thin analyst coverage, domestic demand insulation, genuine corporate growth, remain intact. Whether that holds for the next 25 years depends on whether Indian markets continue to develop at the current pace.
References
- Banz, R. (1981). "The Relationship Between Return and Market Value of Common Stocks." Journal of Financial Economics, 9(1), 3-18.
- Fama, E. & French, K. (1992). "The Cross-Section of Expected Stock Returns." Journal of Finance, 47(2), 427-465.
- Fama, E. & French, K. (1993). "Common Risk Factors in the Returns on Stocks and Bonds." Journal of Financial Economics, 33(1), 3-56.
- Van Dijk, M. (2011). "Is size dead? A review of the size effect in equity returns." Journal of Banking & Finance, 35(12), 3263-3274.
Data: Ceta Research (FMP financial data warehouse), 2000-2025. Full methodology: METHODOLOGY.md. Past performance does not guarantee future results. This is educational content, not investment advice.


