
Frontier Market Premium: Small-Cap Growth Returns 10.81% in South Africa
South African small-cap growth stocks returned 10.81% CAGR with +2.96%/yr excess over SPY across 25 years, turning $10K into $130,480. The frontier market size premium survives where analyst coverage is thin.

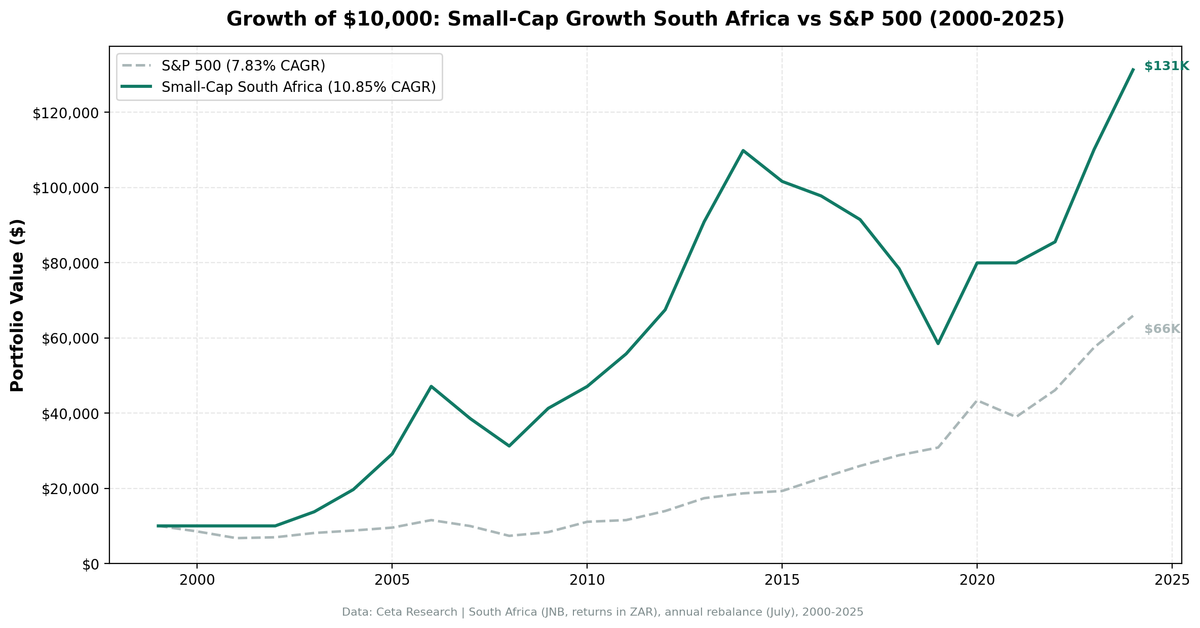
The US small-cap growth premium has been arbitraged away. India and China still show positive excess returns. South Africa rounds out the picture: 10.81% CAGR from 2000 to 2024, +2.96%/yr excess over SPY, $10,000 growing to $130,480.
Contents
- What We Tested
- What We Found
- 2019: The Worst Year
- Annual Returns: 25 Years
- The Frontier Market Thesis
- Currency Risk
- Comparison to Global Results
- Limitations
- Takeaway
- References
This is the third-highest alpha across all markets we tested. It comes from the same place as the India and China premiums: markets that are too small, too lightly covered, and too inaccessible for systematic institutional capital to fully price away obvious inefficiencies.
Note: FMP's data warehouse does not include a JSE/FTSE composite index, so we benchmark against SPY throughout. The premium you see here reflects both the small-cap growth factor and South African equity market exposure.
South Africa's story has two distinct chapters. A strong 12-year run from 2003 through 2014. Then a difficult decade of rand weakness, political instability, and infrastructure crisis that compressed returns but didn't eliminate the premium entirely.
Data: FMP financial data warehouse, 2000–2025. Updated March 2026.
What We Tested
The strategy selects small-cap stocks listed on the Johannesburg Stock Exchange (JNB) showing revenue momentum:
- Market cap: 5%-200% of the exchange threshold (small-cap range)
- Revenue growth: >15% year-over-year (fiscal year)
- Profitability: Net income > 0
- Leverage: Debt-to-equity < 2.0
- Selection: Top 30 by revenue growth, equal-weighted
- Rebalancing: Annual in July, 45-day filing lag
Data from the FMP financial data warehouse, 2000-2024. Average portfolio size: 22.3 stocks. Full methodology: METHODOLOGY.md.
What We Found
+2.96%/yr excess return is meaningful, but it's unevenly distributed. The strategy captured 114% of SPY's upside and 42% of its downside. That asymmetry is what drives the outperformance: the portfolio rallied harder in good years and fell less in bad ones.
60% win rate (15 of 25 years beating SPY) is the cleanest signal. Most factor strategies that fail don't show that kind of consistency. A 60% win rate means the strategy is working structurally, not just riding one or two exceptional years.
The strong period is 2003-2014. Twelve years. The portfolio produced double-digit positive returns in most of them: +36.9%, +57.1%, +42.2%, +61.6%, +27.6%, +18.4%, +22.6%, +29.2%, +20.0%. South Africa's commodity super-cycle, infrastructure spending, and domestic consumption growth all fed into small-cap revenues during this period. Companies growing fast were genuinely worth more.
After 2015, the environment shifted. The rand weakened against the dollar. Load-shedding (Eskom's electricity crisis) raised operating costs for every business in South Africa. Political uncertainty around state capture created investment hesitation. The strategy still beats SPY over the full period, but the post-2015 returns are lumpy and harder to sustain.
2019: The Worst Year
2019: -23.8% for the strategy, +7.4% for SPY. Worst excess return of any year at -31.2%.
This was the Eskom crisis at its worst. Stage 4-6 load-shedding. Rolling blackouts affected every sector. Small businesses, which make up the bulk of the JSE small-cap universe, faced higher generator fuel costs, production disruptions, and collapsing consumer confidence. The rand fell against major currencies. Foreign capital left South African equities broadly.
A company growing revenue at 20%/yr doesn't deliver that growth when the power is off for 8 hours a day. The revenue growth screen couldn't protect against an infrastructure shock of that magnitude.
2019 is a useful reminder that country-specific risk factors can overwhelm fundamental screening. No revenue growth filter protects against a national power grid failing.
Annual Returns: 25 Years
| Year | Strategy | SPY | Excess |
|---|---|---|---|
| 2000 | 0% (cash) | -14.8% | +14.8% |
| 2001 | 0% (cash) | -22.4% | +22.4% |
| 2002 | 0% (cash) | +6.9% | -6.9% |
| 2003 | +36.9% | +14.9% | +22.0% |
| 2004 | +57.1% | +8.9% | +48.2% |
| 2005 | +42.2% | +8.0% | +34.2% |
| 2006 | +61.6% | +20.9% | +40.6% |
| 2007 | -22.6% | -15.2% | -7.4% |
| 2008 | -15.0% | -26.9% | +11.9% |
| 2009 | +27.6% | +16.0% | +11.6% |
| 2010 | +14.5% | +33.5% | -19.1% |
| 2011 | +18.4% | +4.2% | +14.2% |
| 2012 | +22.6% | +20.7% | +1.9% |
| 2013 | +29.2% | +24.7% | +4.4% |
| 2014 | +20.0% | +7.2% | +12.8% |
| 2015 | -4.6% | +2.7% | -7.3% |
| 2016 | -4.1% | +18.6% | -22.6% |
| 2017 | -6.4% | +14.3% | -20.8% |
| 2018 | -14.4% | +11.2% | -25.5% |
| 2019 | -23.8% | +7.4% | -31.2% |
| 2020 | +33.9% | +41.0% | -7.1% |
| 2021 | 0% (cash) | -10.7% | +10.7% |
| 2022 | +5.4% | +18.1% | -12.7% |
| 2023 | +29.1% | +25.4% | +3.7% |
| 2024 | +19.7% | +14.4% | +5.3% |
The early cash years (2000-2002) reflect insufficient qualifying stocks in the JSE small-cap universe before the strategy could run. Sitting in cash during the dot-com crash preserved capital that compounded strongly in the 2003-2006 bull run.
2021 is also a cash year. The strategy found too few qualifying stocks meeting all criteria (revenue growth, profitability, leverage) after the COVID disruption. Revenue figures from 2020 filings were too distorted for the screen to fire cleanly.
The Frontier Market Thesis
Why does the size premium survive in South Africa when it doesn't in the US?
Coverage gap. JSE-listed small-caps average fewer than 3 analyst estimates per stock for earnings. Many have none. Without coverage, price discovery is slow. Mispriced companies stay mispriced for longer.
Institutional capacity. South Africa's institutional investor base (pension funds, insurance companies) concentrates in large-caps and government bonds. The GEPF (Government Employees Pension Fund, Africa's largest pension fund) doesn't move markets in small-cap industrials. This leaves the small-cap space less contested.
Foreign investor access. International allocators who do invest in South Africa typically buy the JSE top 40 index for exposure. Small-cap allocation from foreign capital is minimal.
Genuine economic development. The 2003-2014 period saw real GDP growth, expanding middle class, and infrastructure spend that directly benefited small companies in construction, retail, financial services, and consumer goods. The growth screen was capturing real economic trends.
That last point is also why the post-2015 period is weaker. Real structural headwinds hit the economy. A screen for revenue growth can't create growth that doesn't exist.
Currency Risk
All returns here are in South African Rand (ZAR). USD investors face additional volatility from the ZAR/USD exchange rate.
The rand has been on a long-term depreciation path against the dollar, with periodic sharp devaluations during stress events (2008, 2015-2016, 2018-2019). This means USD-converted returns would be lower than the ZAR returns shown above. A South African small-cap strategy for international investors is also a long-ZAR bet.
This is a material consideration that the headline CAGR numbers don't capture. Investors comfortable with frontier currency exposure will see different risk/return characteristics than ZAR-denominated investors.
Comparison to Global Results
Across four markets, the pattern holds consistently: the size premium survives in markets where it can't be arbitraged away.
US: -2.25%/yr excess. The world's most efficiently priced equity market. The premium is gone. India: +1.13%/yr. Emerging market, thin small-cap coverage, domestic demand drivers. China: +2.34%/yr vs SPY, +7.76%/yr vs SSE Composite. Maximum alpha locally, but concentrated in two bubble years and -72% MaxDD. South Africa: +2.96%/yr. Consistent 60% win rate, strong run 2003-2014, frontier market efficiency gap.
South Africa and China have similar excess returns vs SPY (+2.96% vs +2.34%), but very different risk profiles. China's returns are concentrated and volatile. South Africa's are more distributed across 25 years with a 60% win rate. The MaxDD difference is also significant: -44.10% for South Africa vs -72.01% for China.
For investors specifically seeking frontier market exposure with size-premium alpha, South Africa offers a more consistent delivery mechanism than China, at the cost of ZAR currency risk.
Limitations
- Currency: Returns in ZAR. USD returns would be materially lower due to rand depreciation over the period.
- Liquidity: JSE small-caps can have wide bid-ask spreads and thin order books. Real execution costs would be higher than the model implies.
- Cash years: 4 years of cash (2000, 2001, 2002, 2021) reduce the comparable history. Universe constraints were real.
- Country concentration risk: 2015-2019 shows what concentrated South Africa exposure looks like during structural headwinds. This isn't a diversified emerging market fund.
- Filing quality: South African small-cap financial reporting can be delayed and sometimes restated. The 45-day lag assumption may not fully account for this.
Takeaway
The small-cap growth premium is alive in South Africa. 25 years, 60% win rate, +2.96%/yr excess, $130,480 from $10,000. The mechanism is straightforward: thin analyst coverage and limited institutional interest in JSE small-caps creates mispricing that systematic revenue growth screening can identify.
The 2003-2014 bull run was exceptional. Post-2015 has been more difficult as structural headwinds (Eskom, currency, political risk) compressed returns. The premium didn't disappear, but it narrowed. The 2023 and 2024 numbers (+29.1%, +19.7%) suggest some recovery.
Frontier markets aren't efficient enough to fully price away the size premium. South Africa is a clear example of that thesis playing out over 25 years. The challenge for international investors is the ZAR/USD translation and the country-specific risk events that no fundamental screen can fully anticipate.
References
- Banz, R. (1981). "The Relationship Between Return and Market Value of Common Stocks." Journal of Financial Economics, 9(1), 3-18.
- Fama, E. & French, K. (1992). "The Cross-Section of Expected Stock Returns." Journal of Finance, 47(2), 427-465.
- Fama, E. & French, K. (1993). "Common Risk Factors in the Returns on Stocks and Bonds." Journal of Financial Economics, 33(1), 3-56.
- Van Dijk, M. (2011). "Is size dead? A review of the size effect in equity returns." Journal of Banking & Finance, 35(12), 3263-3274.
Data: Ceta Research (FMP financial data warehouse), 2000-2025. Full methodology: METHODOLOGY.md. Past performance does not guarantee future results. This is educational content, not investment advice.


