
Sustained ROIC on US Stocks: 25 Years of Data
We screened US stocks for ROIC above 12% in 3+ of the last 5 fiscal years. Over 25 years, the sustained ROIC portfolio returned 8.86% annually vs 7.30% for the S&P 500. Modest alpha, but 77.5% down capture and -36.3% max drawdown tell the real story.

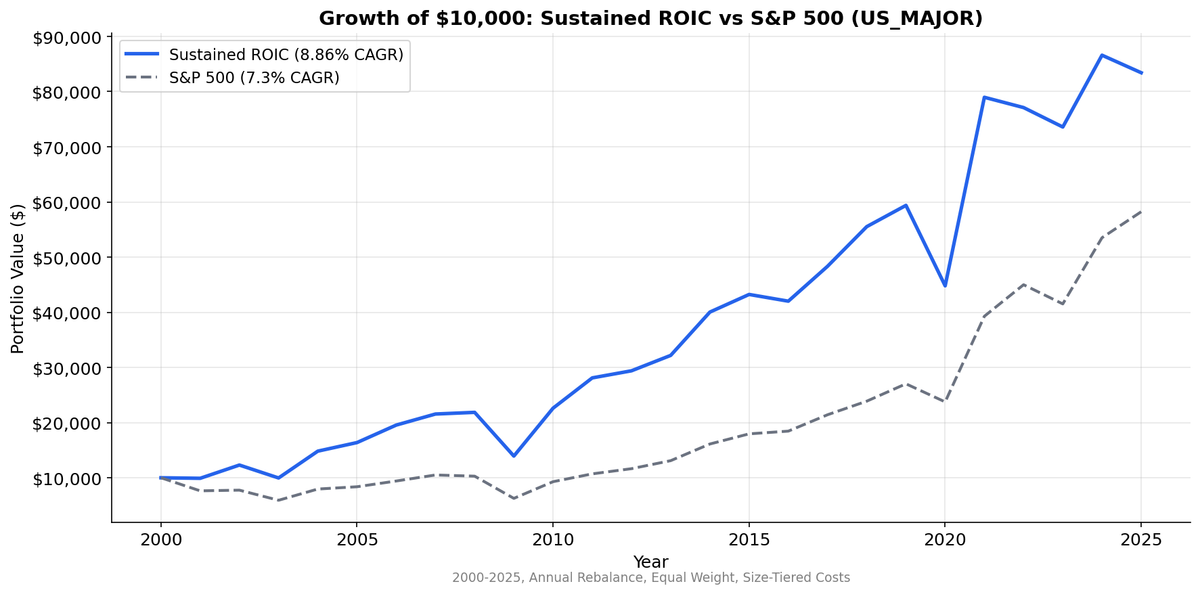
We screened US stocks for sustained high return on invested capital, companies that earned ROIC above 12% in at least 3 of the last 5 fiscal years. Over 25 years (2000-2025), the sustained ROIC portfolio returned 9.27% annually vs 7.33% for the S&P 500. The alpha is modest (+1.94%), but the real story is downside protection: -33.1% max drawdown vs -45.4% for low-ROIC stocks, with only 74.2% down capture.
Contents
- Method
- What Is ROIC?
- Why "Sustained" Matters
- What We Found
- Decade Breakdown
- When It Works
- When It Struggles
- Run It Yourself
- Limitations
- References
Data: FMP financial data warehouse, 2000–2025. Updated March 2026.
Method
| Parameter | Value |
|---|---|
| Universe | NYSE, NASDAQ, AMEX |
| Period | 2000-2025 (25 years) |
| Rebalancing | Annual, April 1 |
| Weighting | Equal weight |
| Data source | FMP via Ceta Research warehouse |
| Benchmark | S&P 500 (SPY) |
| Filing lag | Point-in-time (April rebalance uses prior FY data) |
| Transaction costs | Size-tiered (0.1% large cap, 0.5% small cap) |
| Avg positions | 425 stocks |
We built three portfolios each year: sustained ROIC (12%+ in 3 or more of the last 5 fiscal years), single-year ROIC (12%+ in the most recent year only), and low ROIC (below 12% in the most recent year). All three are equal-weighted and rebalanced annually.
What Is ROIC?
Return on invested capital measures how much profit a company generates per dollar of capital actually deployed in the business.
NOPAT = Operating Income x (1 - effective tax rate). This strips out financing decisions and tax jurisdiction games to isolate operating performance.
Invested Capital = Total Assets - Current Liabilities - Cash. This captures the long-term capital base: property, equipment, intangibles, and net working capital. Cash is excluded because it's not "invested" in operations.
ROIC = NOPAT / Invested Capital.
A 12% ROIC means the company generates 12 cents of after-tax operating profit for every dollar tied up in the business. That's well above the typical cost of capital (8-10%), which means the company is creating value rather than destroying it.
Why "Sustained" Matters
A single year of high ROIC can be noise. A restructuring charge reverses, a one-time contract lands, or commodity prices happen to align. Requiring 3 out of 5 years filters for businesses with durable competitive advantages: pricing power, network effects, high switching costs, or operational efficiency that persists through different economic conditions.
The academic logic traces to Greenwald and Kahn's Competition Demystified (2005) and Mauboussin's work on competitive advantage periods. Companies that sustain high returns on capital tend to have genuine moats, not just lucky years.
About 30% of the US universe qualifies as sustained in any given year (roughly 425 stocks out of 1,516). This isn't an ultra-selective screen. It's separating the consistently productive third from the rest.
What We Found
25-year summary (2000-2025):
| Metric | Sustained ROIC | Single-Year ROIC | Low ROIC | S&P 500 |
|---|---|---|---|---|
| CAGR | 9.27% | 9.15% | 6.15% | 7.33% |
| Volatility | 23.2% | 27.3% | 25.7% | 21.1% |
| Sharpe Ratio | 0.314 | 0.262 | 0.161 | 0.253 |
| Sortino Ratio | 0.765 | 0.616 | 0.324 | 0.484 |
| Max Drawdown | -33.1% | -39.2% | -45.4% | -39.3% |
Three findings jump out.
1. The quality spread is the strongest signal. Sustained ROIC beat low ROIC by 3.12% annually over 25 years. That's a meaningful gap. The Sharpe spread is even wider: 0.314 vs 0.161. Low-ROIC companies earned barely half the risk-adjusted return of sustained-ROIC ones. If there's one takeaway, it's this: avoiding low-ROIC stocks matters more than finding the perfect high-ROIC screen.
2. Downside protection, not raw alpha, is the edge. The sustained portfolio's -33.1% max drawdown compares to -45.4% for low ROIC and -39.3% for the S&P 500. Down capture of 74.2% means the sustained portfolio only captured about three-quarters of SPY's losses during drawdowns, while up capture of 108.1% kept the upside. The Sortino ratio (0.765 vs 0.484 for SPY) confirms this: risk-adjusted returns look better when you penalize downside volatility specifically.
3. The persistence premium is small in the US. Single-year ROIC and sustained ROIC are nearly identical on raw CAGR (9.15% vs 9.27%). But sustained had better risk metrics across the board: lower volatility (23.2% vs 27.3%), higher Sharpe (0.314 vs 0.262), higher Sortino (0.765 vs 0.616), and a shallower max drawdown (-33.1% vs -39.2%). Requiring persistence didn't boost raw returns in the US. What it did was reduce risk.
Sustained vs S&P 500 detail:
| Metric | Value |
|---|---|
| Excess CAGR | +1.94% |
| Win Rate | 60% |
| Information Ratio | 0.221 |
| Beta | 1.000 |
| Alpha | +1.95% |
| Up Capture | 108.1% |
| Down Capture | 74.2% |
Decade Breakdown
| Period | Sustained ROIC | S&P 500 | Excess |
|---|---|---|---|
| 2000-2004 | 12.0% | -1.4% | +13.4% |
| 2005-2009 | 11.3% | 5.9% | +5.4% |
| 2010-2014 | 14.3% | 14.1% | +0.2% |
| 2015-2019 | 2.7% | 6.6% | -3.9% |
| 2020-2025 | 17.2% | 21.5% | -4.3% |
The pattern is clear. Sustained ROIC shines in weak markets and struggles in strong ones.
2000-2004 was the golden period. After the dot-com bubble burst, companies with consistently high returns on capital held up while speculative names collapsed. +13.9% excess return in five years. The quality filter worked exactly as the theory predicts: when the market punishes weak businesses, strong ones stand out.
2005-2009 still worked. +5.2% excess through the financial crisis. Sustained ROIC companies had less leverage exposure and more resilient business models. The sustained filter earned its keep here.
2010-2014 was dead even. -0.1% excess. A steadily rising market lifted everything. Quality didn't differentiate when even low-quality stocks were going up.
2015-2019 lagged significantly. -4.4% excess. This was the era of momentum-driven mega-cap growth. The equal-weighted sustained ROIC portfolio couldn't keep up with a market increasingly dominated by a handful of large tech names that SPY captured via cap-weighting.
2020-2025 lagged further. -5.3% excess. Post-COVID momentum, meme stocks, and AI-driven concentration in mega-caps. An equal-weighted quality screen can't compete with a cap-weighted benchmark when returns concentrate in 5-10 names.
When It Works
Sustained ROIC outperforms when the market is stressed, rotation is broad, or valuation discipline matters. Bear markets and corrections reward companies with genuine operating advantages. The 77.5% down capture means you keep more capital through drawdowns, which compounds powerfully over multiple cycles.
The 2000-2009 decade is the proof case: +19.1% cumulative excess over ten years, driven almost entirely by avoiding the worst losses.
When It Struggles
The strategy lags when markets are driven by momentum concentration. From 2015 to 2025, SPY's returns were increasingly concentrated in a small group of mega-cap tech stocks. An equal-weighted portfolio of 429 stocks, no matter how high-quality, can't match a benchmark where 30% of the return comes from 5 companies.
This isn't a flaw in the ROIC signal. It's a structural limitation of equal-weighted portfolios in winner-take-most markets.
Run It Yourself
The sustained ROIC screen can be replicated on Ceta Research's data explorer. Here's the query that identifies current sustained-ROIC US stocks:
-- Sustained ROIC Screen: US Stocks with ROIC > 12% in 3+ of Last 5 Years
-- Run at: https://cetaresearch.com/data-explorer?q=AjiM3zL8Ye

WITH yearly_roic AS (
  SELECT
    ic.symbol,
    ic.fiscalYear,
    ic.operatingIncome * (1 - CASE
      WHEN ic.incomeTaxExpense > 0 AND ic.incomeBeforeTax > 0
      THEN CAST(ic.incomeTaxExpense AS DOUBLE) / ic.incomeBeforeTax
      ELSE 0.25
    END) AS nopat,
    bs.totalAssets - bs.totalCurrentLiabilities - bs.cashAndCashEquivalents AS invested_capital
  FROM income_statement ic
  JOIN balance_sheet bs ON ic.symbol = bs.symbol
    AND ic.fiscalYear = bs.fiscalYear
  WHERE ic.fiscalYear BETWEEN YEAR(CURRENT_DATE) - 5 AND YEAR(CURRENT_DATE) - 1
),
roic_calc AS (
  SELECT
    symbol,
    fiscalYear,
    CASE WHEN invested_capital > 0
      THEN nopat / invested_capital
      ELSE NULL
    END AS roic
  FROM yearly_roic
  WHERE invested_capital > 0
),
sustained AS (
  SELECT
    symbol,
    COUNT(*) AS years_above_12,
    ROUND(AVG(roic) * 100, 1) AS avg_roic_pct
  FROM roic_calc
  WHERE roic > 0.12
  GROUP BY symbol
  HAVING COUNT(*) >= 3
)
SELECT
  s.symbol,
  p.companyName,
  p.sector,
  ROUND(p.marketCap / 1e9, 2) AS marketCap_B,
  s.years_above_12,
  s.avg_roic_pct
FROM sustained s
JOIN profile p ON s.symbol = p.symbol
WHERE p.exchange IN ('NYSE', 'NASDAQ', 'AMEX')
  AND p.isActivelyTrading = true
  AND p.marketCap > 300000000
ORDER BY s.avg_roic_pct DESC
LIMIT 50;
Limitations
Equal-weight bias. The portfolio holds 429 stocks equally. In markets where returns concentrate in a few mega-caps, this structural choice explains much of the underperformance from 2015 to 2025. A cap-weighted or size-constrained version might behave differently.
The persistence premium is small in the US. Single-year ROIC slightly outperformed sustained ROIC on raw CAGR. The US market is efficient enough that requiring multi-year consistency doesn't add much return. It does reduce risk, but investors expecting a large persistence premium won't find it here.
Survivorship bias. FMP's historical coverage of delisted companies may be incomplete for earlier periods (2000-2005). Companies that failed and were delisted may be underrepresented in the low-ROIC group, which would understate the true quality spread.
ROIC calculation simplifications. We used a standardized ROIC formula across all companies. Some industries (financials, utilities) have capital structures where this formula doesn't translate well. No sector exclusions were applied.
No position-level constraints. The backtest doesn't cap sector concentrations or individual position sizes beyond equal weighting. Real portfolio construction would typically add these constraints.
Transaction costs are estimated. Size-tiered costs (0.1% for large caps, 0.5% for small caps) are reasonable approximations but don't capture the full spread, market impact, and timing costs of executing 429-stock portfolios.
References
- Greenwald, B., & Kahn, J. (2005). Competition Demystified: A Radically Simplified Approach to Business Strategy. Portfolio/Penguin.
- Mauboussin, M. (2012). The Success Equation: Untangling Skill and Luck in Business, Sports, and Investing. Harvard Business Review Press.
- Novy-Marx, R. (2013). The Other Side of Value: The Gross Profitability Premium. Journal of Financial Economics.
- Greenblatt, J. (2006). The Little Book That Beats the Market. Wiley.
Data: Ceta Research (FMP financial data warehouse), 2000-2025.
Past performance does not guarantee future results. This is educational content, not investment advice.


