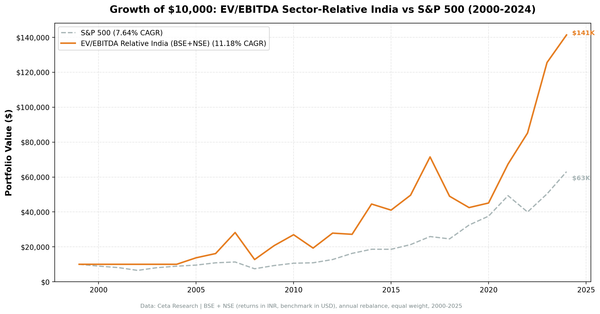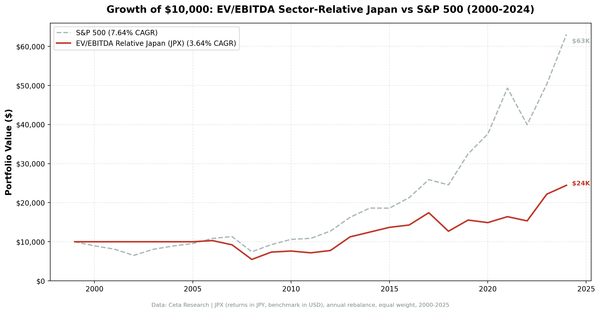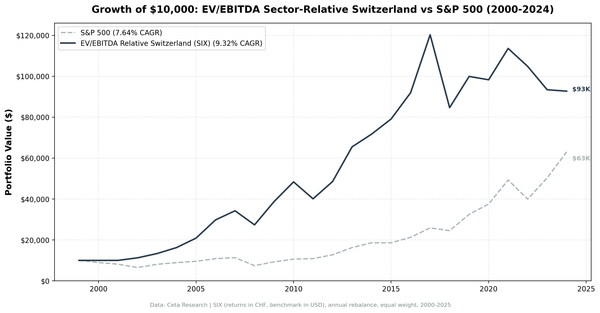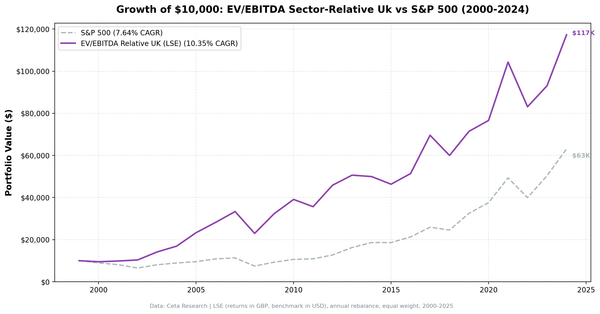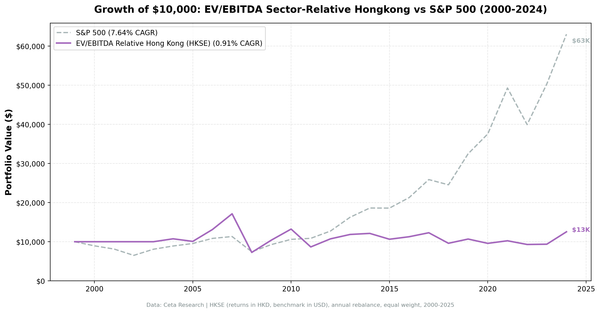
Hong Kong stocks
EV/EBITDA Sector-Relative Value on Hong Kong Stocks: Structural Discounts That Never Close
We backtested sector-relative EV/EBITDA on 21 years of Hong Kong stocks (HKSE). 0.87% CAGR vs 0.49% Hang Seng, +0.38% excess. Looks positive — but negative Sharpe ratio (-0.097) and -57.59% max drawdown tell the real story. Risk-adjusted returns are negative despite marginally beating the index.