
Use ChatGPT, Claude, Gemini, or Any LLM to Query Financial Data
Use your existing AI subscription to query 163 tables of financial data on Ceta Research. No API key, no setup. Copy the schema, paste into your AI, and ask questions in plain English.

This guide explains how to use AI tools like ChatGPT, Claude, or Gemini to generate DuckDB-compatible SQL queries for the Trading Studio Data Explorer. The approach works with any LLM that accepts text input.
The workflow is: copy your database schema from the platform, paste it into your AI along with instructions, describe the query you need, and run the generated SQL on the platform.
Prerequisites
- A free Trading Studio account (tradingstudio.finance). No credit card required.
- Access to any AI chatbot (ChatGPT, Claude, Gemini, DeepSeek, Grok, Qwen, etc.)
Overview
The Trading Studio Data Explorer provides access to financial and market data from FMP (Financial Modeling Prep) through a DuckDB query engine. The platform includes a built-in AI for query generation, but you can also use your own model. This can be useful when you want to work within an existing conversation, use a specific model, or maintain your own prompt context.
The LLM Context feature exports a compact, token-efficient schema that any AI can use to generate accurate queries.
Note: LLM Context currently supports the FMP dataset. Support for additional data sources (FRED, Eurostat, ECB, etc.) is planned.
Step-by-step workflow
Step 1: Open the Data Explorer
Go to tradingstudio.finance/data-explorer.
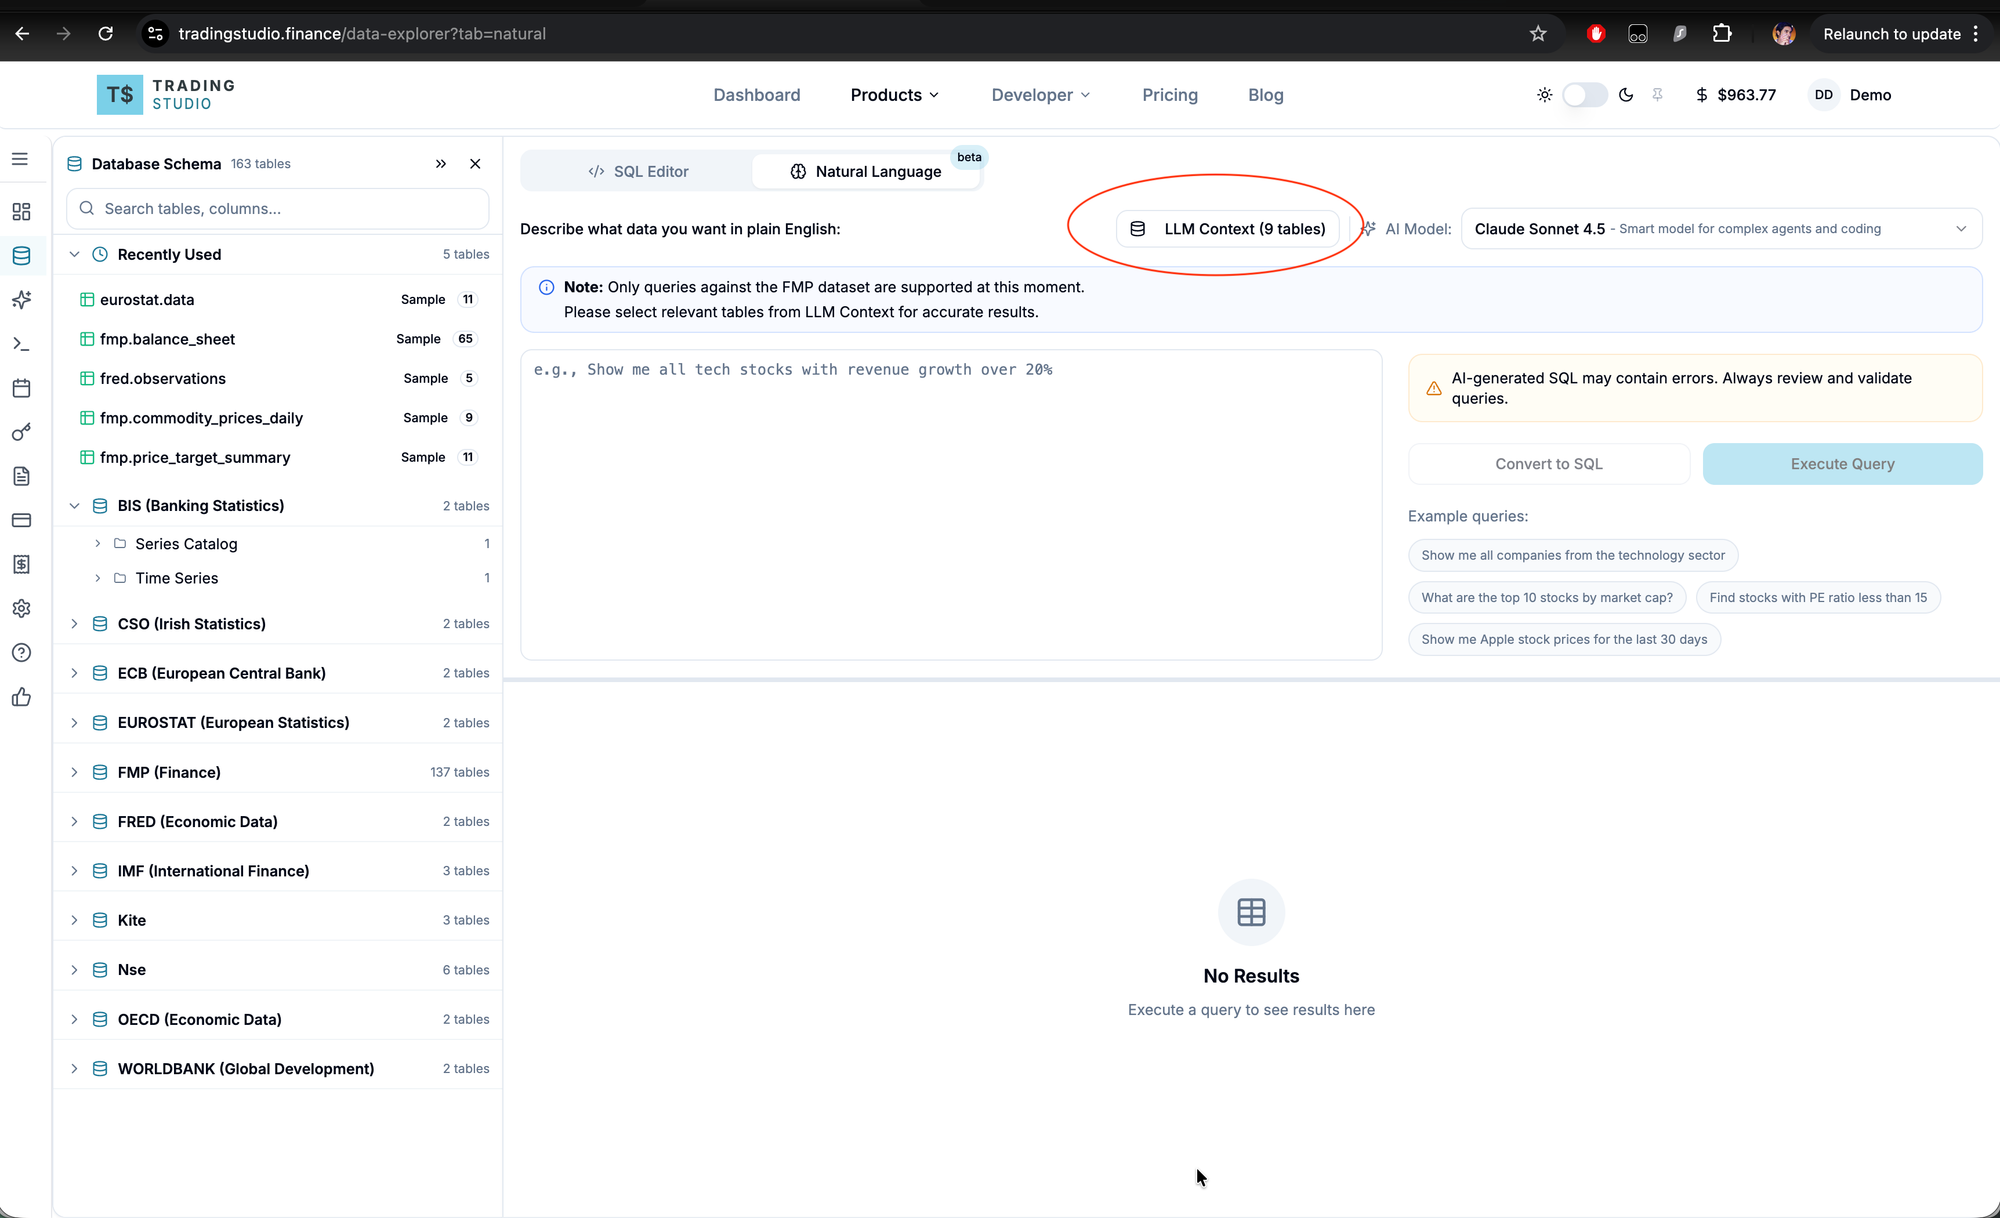
Step 2: Open LLM Context
Click the Natural Language tab, then click the LLM Context button. This opens the schema selector.
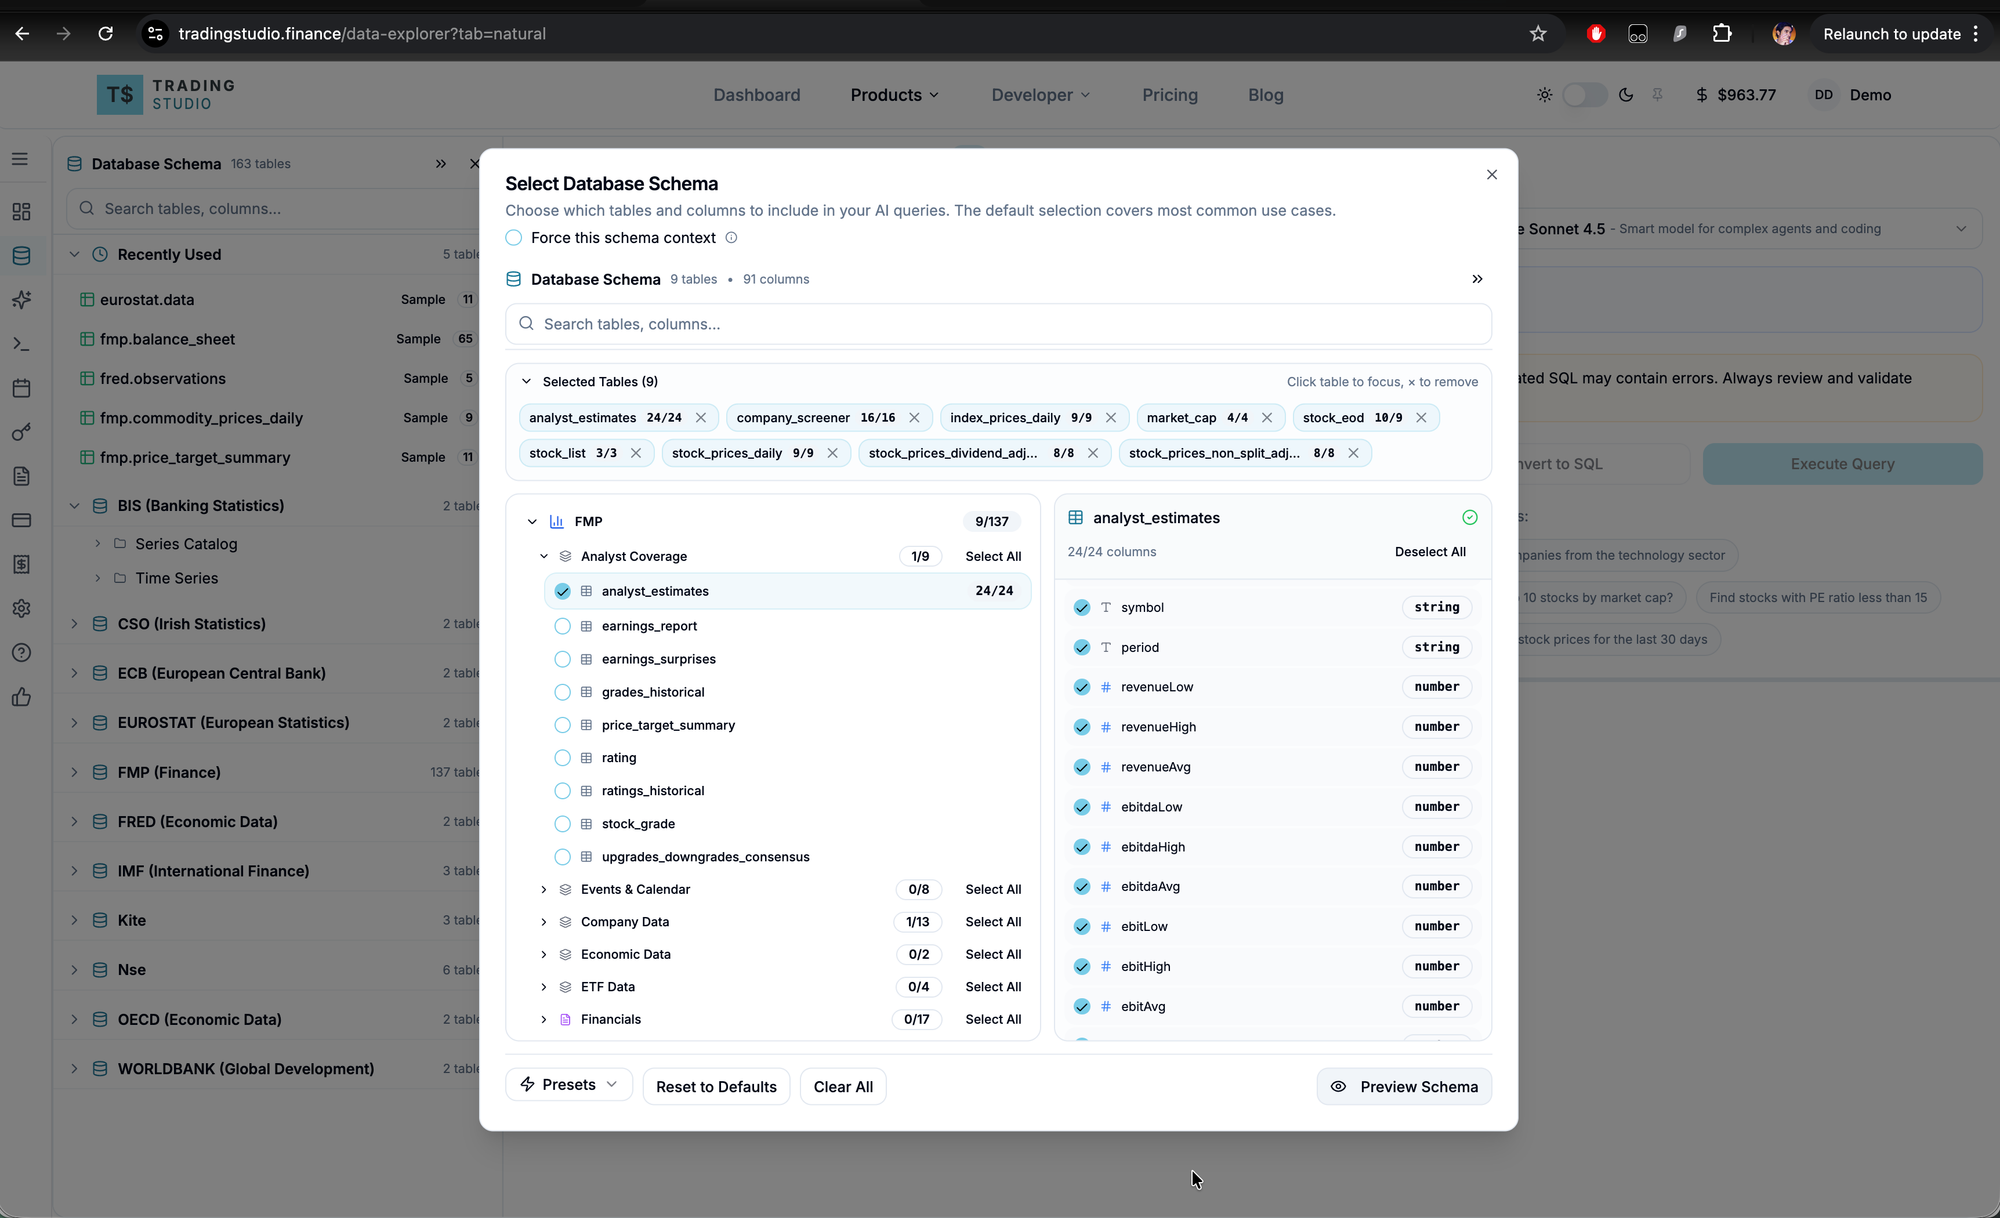
Step 3: Select relevant tables
Select the tables relevant to your query. Including only the tables you need reduces token usage and improves query accuracy.
Common selections:
- Stock valuations: company_screener, financial_ratios, key_metrics
- Price history: stock_eod, stock_prices_daily
- Insider activity: insider_trading, stock_prices_daily
Presets are available at the bottom of the dialog for common use cases.
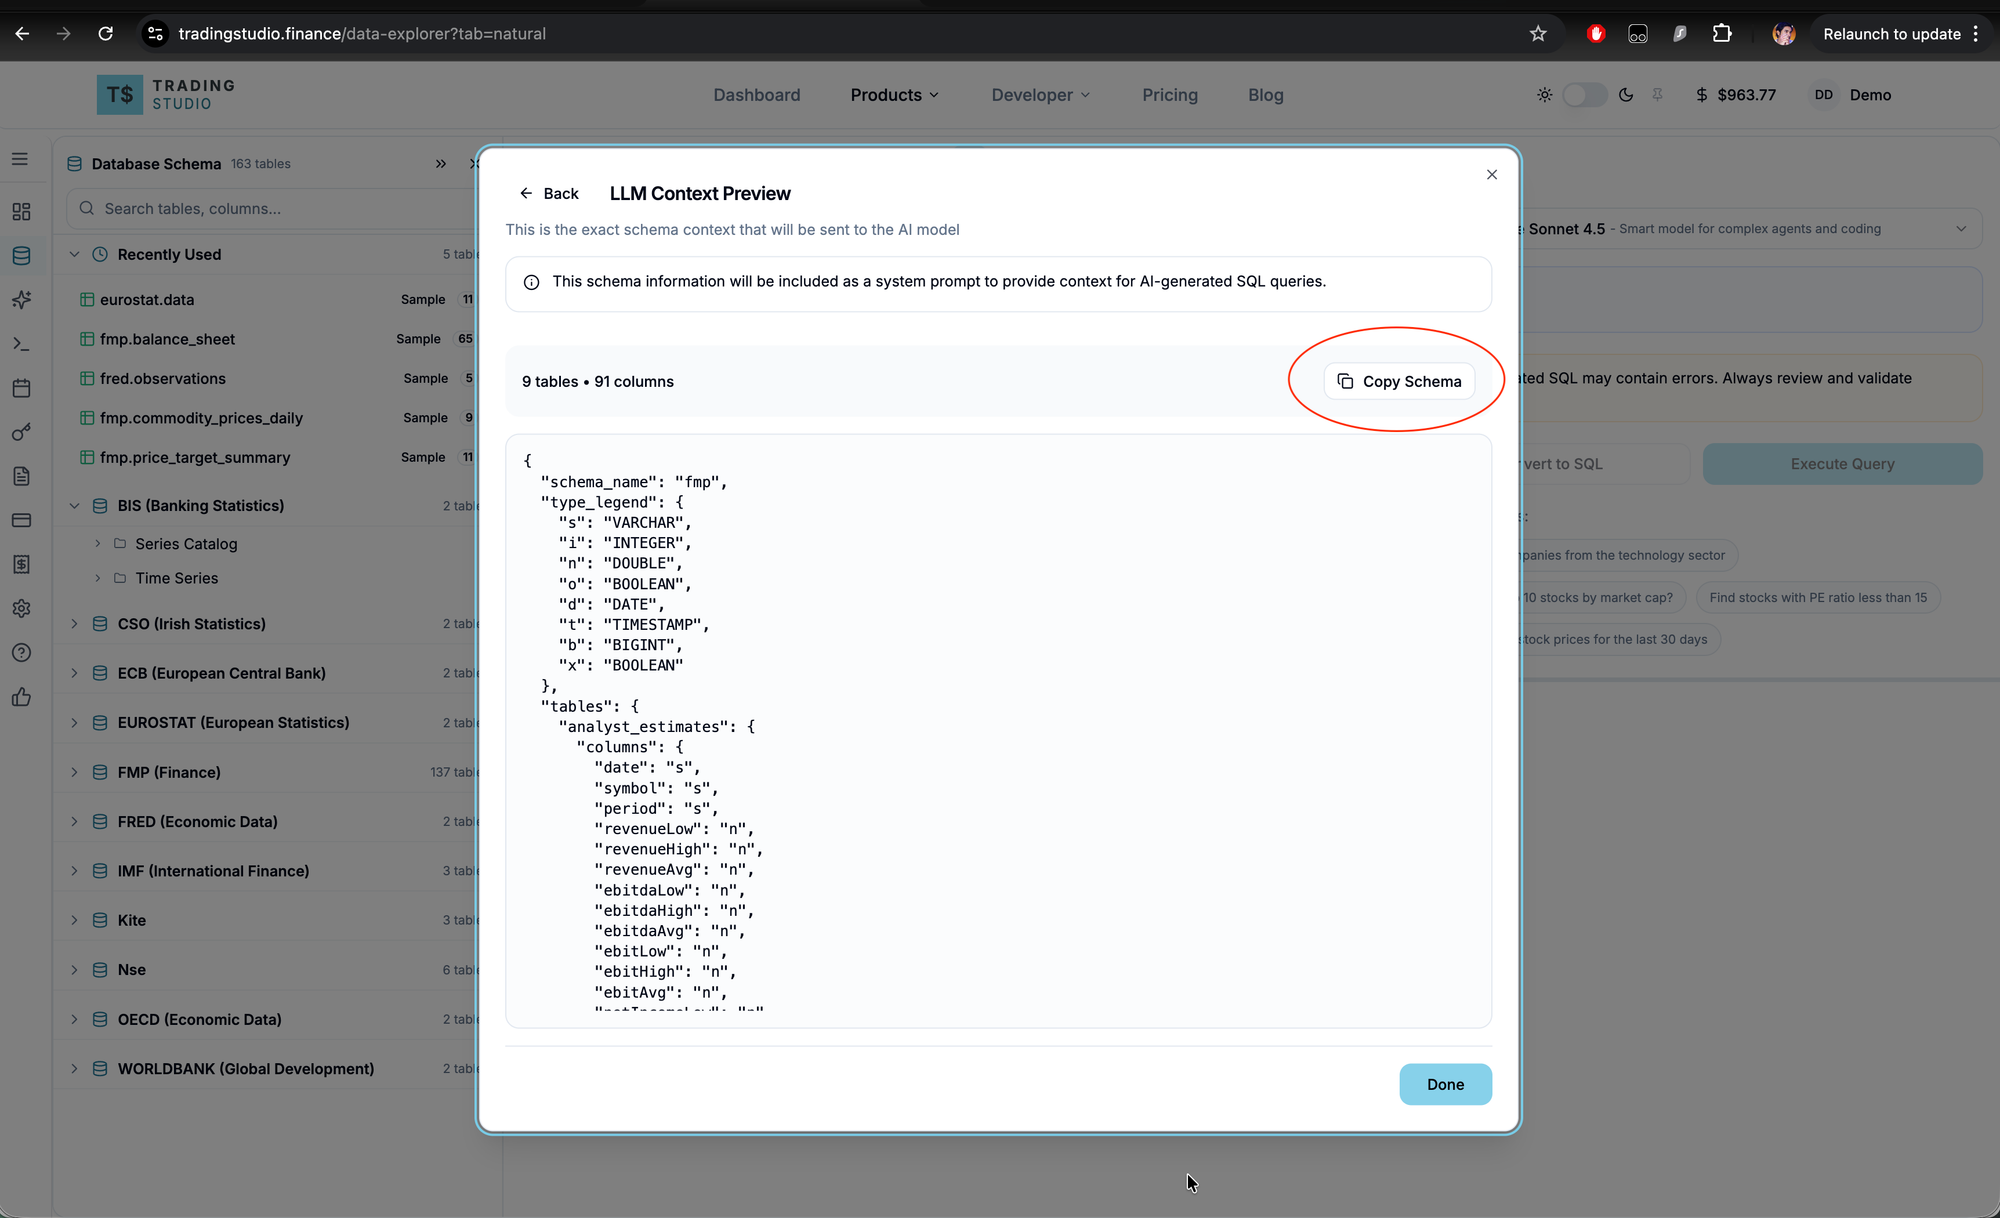
Step 4: Copy the schema
Click Preview Schema, then Copy Schema. This copies a compact JSON representation of your selected tables and columns.
The format uses a type legend to minimize token usage:
{
  "schema_name": "fmp",
  "type_legend": { "s": "VARCHAR", "n": "DOUBLE", "i": "INTEGER", ... },
  "tables": {
    "stock_eod": {
      "columns": { "date": "s", "symbol": "s", "open": "n", "high": "n", ... }
    }
  }
}
Step 5: Paste into your AI and ask your question
Open a new conversation in your preferred AI tool. Paste everything in a single message using this template:
## Instructions

You are a DuckDB SQL expert for financial data.
Generate DuckDB queries (NOT PostgreSQL).
Tables accessed as fmp.table_name.
Use table aliases (FROM fmp.stock_eod AS tb_1).
date_epoch columns are UINT32 Unix seconds, cast to BIGINT before arithmetic.
For latest data per symbol: DISTINCT ON (symbol) ORDER BY date_epoch DESC.
LIMIT to 100 rows.
Fetch DuckDB documentation if needed.

If I share an error, fix the SQL and explain what went wrong.

## Schema

[Paste the schema you copied from the platform here, or attach it as a file]

## Query

Refer to the schema above and generate an optimised DuckDB SQL query for:

Show me the largest insider stock purchases in the last 90 days with their 1-week,
1-month, and 3-month forward returns. Include the insider's name, purchase value,
and filing date.
Other example queries: - "Generate SQL to show technology stocks with P/E under 15 and ROE over 20%" - "Write a query to find stocks where insiders bought more than $1M in the last quarter" - "Create SQL showing stocks with the highest analyst price target upside"
Replace the bracketed sections with your schema and question. Most AI tools also accept the schema as a file attachment instead of pasting inline. Both approaches work.
Model selection matters. Financial queries often involve multi-table joins, epoch arithmetic, and window functions. Use capable models: GPT-4o or o3 on ChatGPT, Opus 4.6 or Sonnet 4.6 on Claude, 2.5 Pro on Gemini. Smaller models tend to hallucinate column names or produce invalid syntax.
Step 6: Review the generated SQL
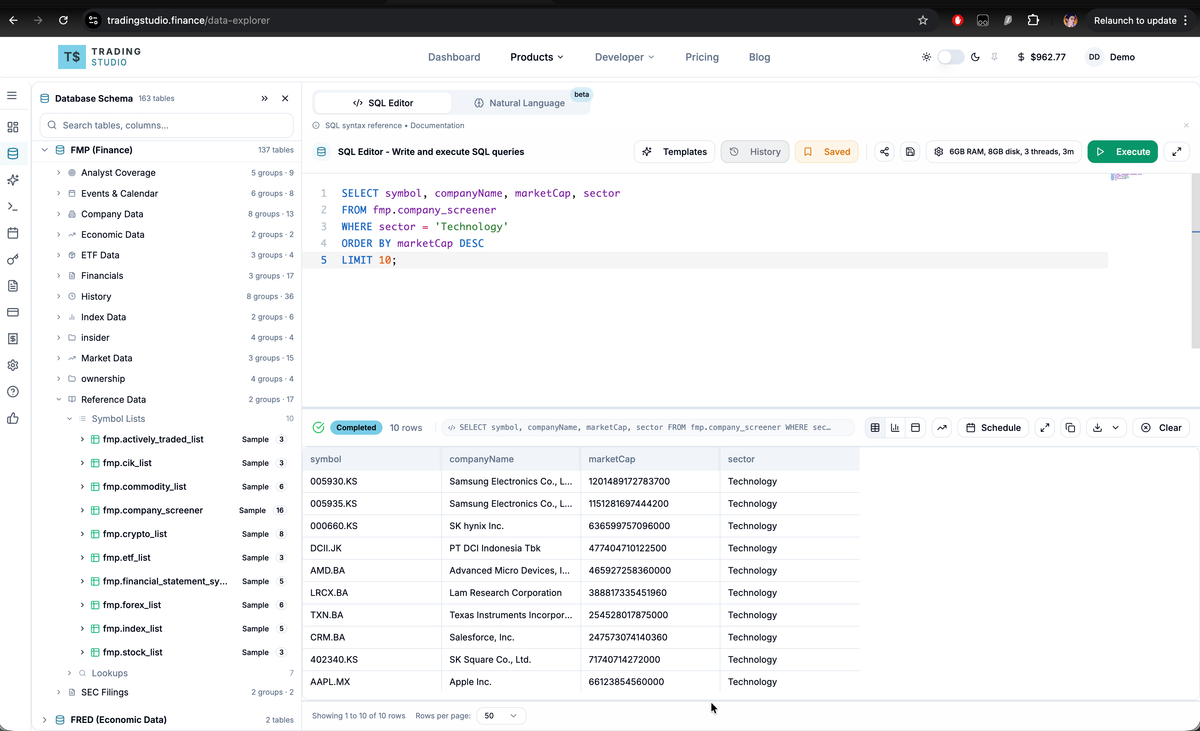
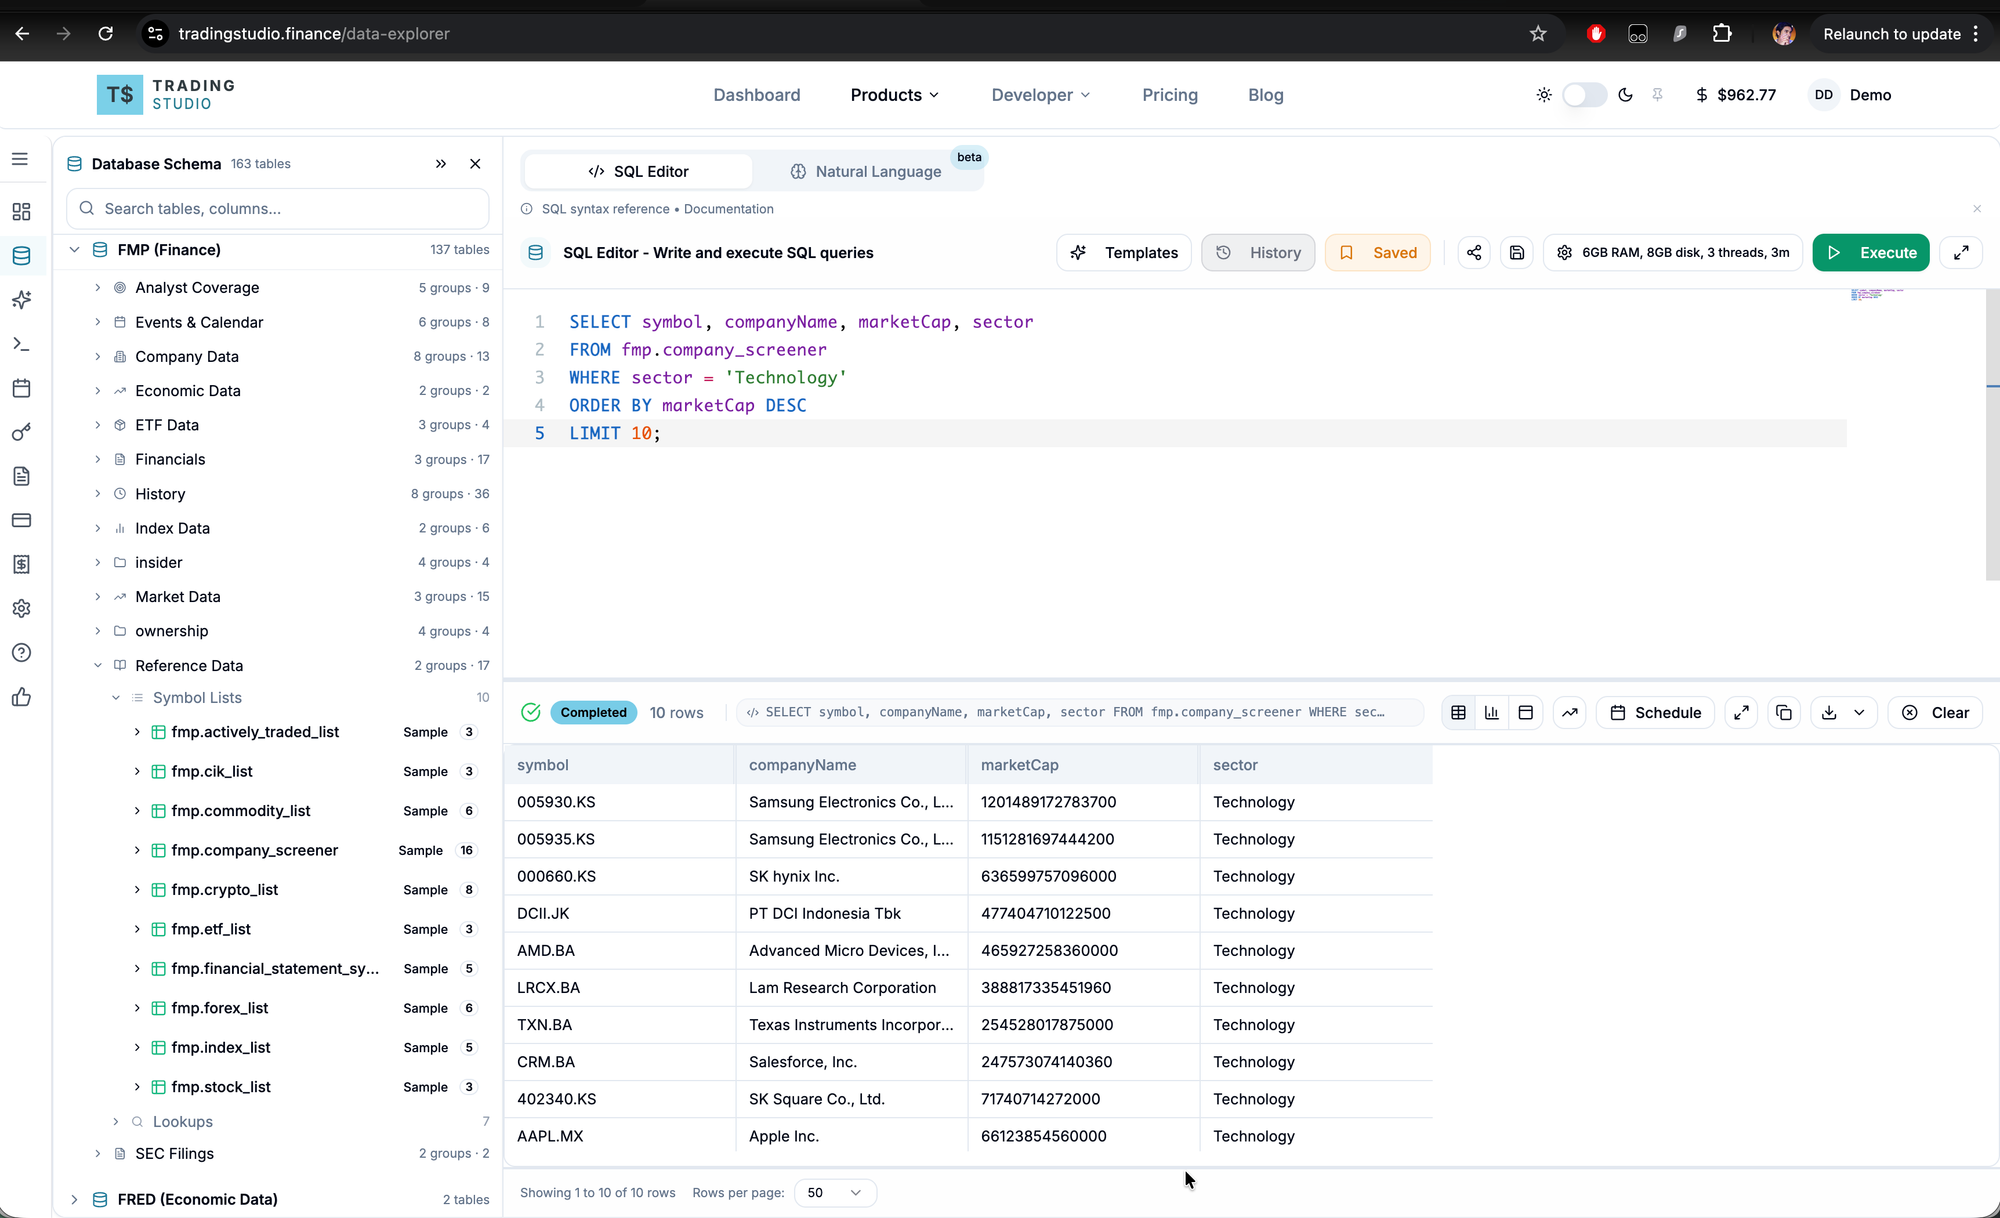
For a question like "Show me the top 10 stocks by market cap in the technology sector", the AI will generate:
SELECT tb_1.symbol, tb_1.companyName, tb_1.marketCap, tb_1.sector
FROM fmp.company_screener AS tb_1
WHERE tb_1.sector = 'Technology'
ORDER BY tb_1.marketCap DESC
LIMIT 10;
Step 7: Execute the query
Copy the generated SQL, switch to the SQL Editor tab in the Data Explorer, paste it, and click Execute Query.
Step 8: Handle errors
If the query fails, copy the error message and paste it back into your AI:
"This query returned: Binder Error: column 'priceEarningsRatio' not found. Did you mean 'peRatioTTM'?"
The AI will correct the query. Most errors are column name mismatches and resolve in one iteration.
Tip: If the AI produces PostgreSQL syntax or incorrect DuckDB functions, add this to your follow-up: "Read the DuckDB documentation and fix this SQL." This nudges the model to reference DuckDB-specific syntax rather than defaulting to PostgreSQL conventions.
Working with complex queries
Simple lookups work well in a single prompt. For multi-table joins or analytical queries, an iterative approach produces better results.
Example: analyzing insider purchase performance
This analysis requires joining insider_trading with stock_prices_daily to calculate forward returns after insider purchases.
Round 1 - Start with a basic query:
"Show me the largest insider stock purchases (acquisitionOrDisposition = 'A', transactionType = 'P-Purchase') in the last 90 days, sorted by total value"
Run the result, verify the data looks reasonable.
Round 2 - Add the price join:
"Join with stock_prices_daily to show the stock price at filing date and 1 month later. Use date_epoch for the join. Cast date_epoch to BIGINT before doing arithmetic."
Round 3 - Calculate returns:
"Add percentage return columns at 1 week, 1 month, and 3 months after the insider purchase"
The final query uses CTEs, epoch-based forward price lookups, and return calculations:
WITH insider_buys AS (
    SELECT reportingName, symbol, price,
           SUM(securitiesTransacted * price) AS totalValue,
           MAX(filingDateEpoch) AS filingEpoch
    FROM fmp.insider_trading
    WHERE acquisitionOrDisposition = 'A'
      AND transactionType = 'P-Purchase'
      AND CAST(filingDateEpoch AS BIGINT) >= EXTRACT(EPOCH FROM CURRENT_DATE - INTERVAL '90 days')::BIGINT
    GROUP BY reportingName, symbol, price
)
SELECT ib.reportingName, ib.symbol, ib.totalValue,
    ROUND((MIN(CASE WHEN sp.dateEpoch >= ib.filingEpoch + 604800
        THEN sp.close END) - MIN(CASE WHEN sp.dateEpoch >= ib.filingEpoch
        THEN sp.close END)) / NULLIF(MIN(CASE WHEN sp.dateEpoch >= ib.filingEpoch
        THEN sp.close END), 0) * 100, 2) AS return_1w_pct
FROM insider_buys ib
LEFT JOIN fmp.stock_prices_daily sp
    ON ib.symbol = sp.symbol
    AND sp.dateEpoch BETWEEN ib.filingEpoch AND ib.filingEpoch + 7776000
GROUP BY ib.reportingName, ib.symbol, ib.price, ib.totalValue, ib.filingEpoch
ORDER BY ib.totalValue DESC
LIMIT 50;
A full version of this query with 1w/2w/1m/2m/3m forward returns is available here.
The general pattern: start with a simple query, verify the output, then add complexity incrementally. This is more reliable than asking for a complex multi-join query in a single prompt.
Practical tips
Select the right tables. The AI can only reference columns present in the schema you provide. If you ask about dividends but only selected price tables, it won't have the necessary column information.
Be specific in your questions. "Show me Apple's quarterly revenue for the last 3 years" produces better results than "show me Apple data."
Reference DuckDB documentation for errors. If the AI generates incorrect syntax, prompt it with: "Read the DuckDB documentation and fix this SQL for DuckDB compatibility." This is particularly useful when the AI defaults to PostgreSQL patterns.
Use the error feedback loop. Copy the error, paste it back, let the AI fix it. Most queries converge within 2-3 iterations. Don't debug the SQL manually.
Build queries incrementally. For complex analysis, start simple, verify results, add joins, verify again. Each round builds on confirmed-working SQL.
Know where columns live. Return metrics (ROE, ROA, ROIC) are in key_metrics, not financial_ratios. P/E ratios and debt ratios are in financial_ratios. This is the most common source of column-not-found errors.
Available data
The FMP dataset covers:
| Category | Example tables |
|---|---|
| Stock valuations | company_screener, financial_ratios, key_metrics |
| Price history | stock_eod, stock_prices_daily |
| Financial statements | income_statement, balance_sheet, cash_flow_statement |
| Analyst coverage | analyst_estimates, price_target_summary |
| Insider activity | insider_trading, insider_trading_statistics |
| Dividends and splits | stock_prices_dividend_adjusted_daily, dividend_calendar |
| ETFs | etf_holder, etf_sector_weightings, etf_info |
| Index constituents | sp500_constituent, nasdaq_constituent, dowjones_constituent |
| Corporate events | ipo_calendar, mergers_acquisitions_latest, earnings_calendar |
Additional data sources (FRED, Eurostat, ECB, IMF, OECD, World Bank, NSE) are available in the SQL Editor but not yet supported in LLM Context.
After running your query
- Download as CSV for use in Excel, Python, or other tools
- Share via link to give others access to your query and results
- Schedule queries for recurring execution
Data Explorer: tradingstudio.finance/data-explorer
Past performance does not guarantee future results. This is educational content, not investment advice.


