
Working Capital Efficiency Across 14 Markets: Where It Works and Where It Fails
We tested working capital efficiency on 14 exchanges worldwide. 10 beat their local benchmark. Sweden: +6.51% vs OMX30. Canada: +5.99% vs TSX. US: +3.44% vs SPY. Benchmark choice matters more than we thought.

We tested working capital efficiency as a stock selection signal on 14 exchanges worldwide. 10 outperformed their local benchmark. 4 underperformed.
Contents
- The Signal
- All 14 Exchanges
- The Outperformers
- Sweden: Best Excess Return (+6.51%/yr vs OMX30)
- Canada: Most Defensive (+5.99%/yr vs TSX Composite)
- UK: Strong Alpha Despite Small Portfolio (+5.04%/yr vs FTSE 100)
- Hong Kong: Local Alpha (+4.45%/yr vs Hang Seng)
- US: Best Risk-Adjusted (Sharpe 0.614, +3.44%/yr)
- Switzerland: Flipped to Positive (+3.43%/yr vs SMI)
- India: Highest Absolute Return (15.15% CAGR, +2.82%/yr vs Sensex)
- Germany, Japan, China: Moderate Outperformers
- The Underperformers
- Thailand (-1.26%/yr vs SET Index)
- Taiwan (-1.57%/yr vs TAIEX)
- Korea (-1.86%/yr vs KOSPI)
- Saudi Arabia (-6.44%/yr vs SPY)
- Why It Works in Most Markets
- The High-Cash Exchanges
- Run It Yourself
- Takeaway
Each exchange is benchmarked against its own local index (Sensex for India, DAX for Germany, FTSE for the UK, OMX30 for Sweden) instead of comparing everything to the S&P 500. This is more honest because it compares same-currency returns.
Data: FMP financial data warehouse, 2000–2025. Updated April 2026.
The Signal
Working capital divided by revenue. Lower means the company converts revenue to cash with less capital tied up in receivables and inventory. We screen for WC/Revenue < 50%, revenue growth > 0, ROE > 8%, operating margin > 10%, and market cap > $500M. Top 30 by WC/Revenue ascending, equal weight, annual rebalance in June, with transaction costs.
The academic basis: Sloan (1996) on accruals, Hirshleifer et al. (2004) on bloated balance sheets. Companies with lean working capital tend to have higher-quality earnings and better subsequent stock returns.
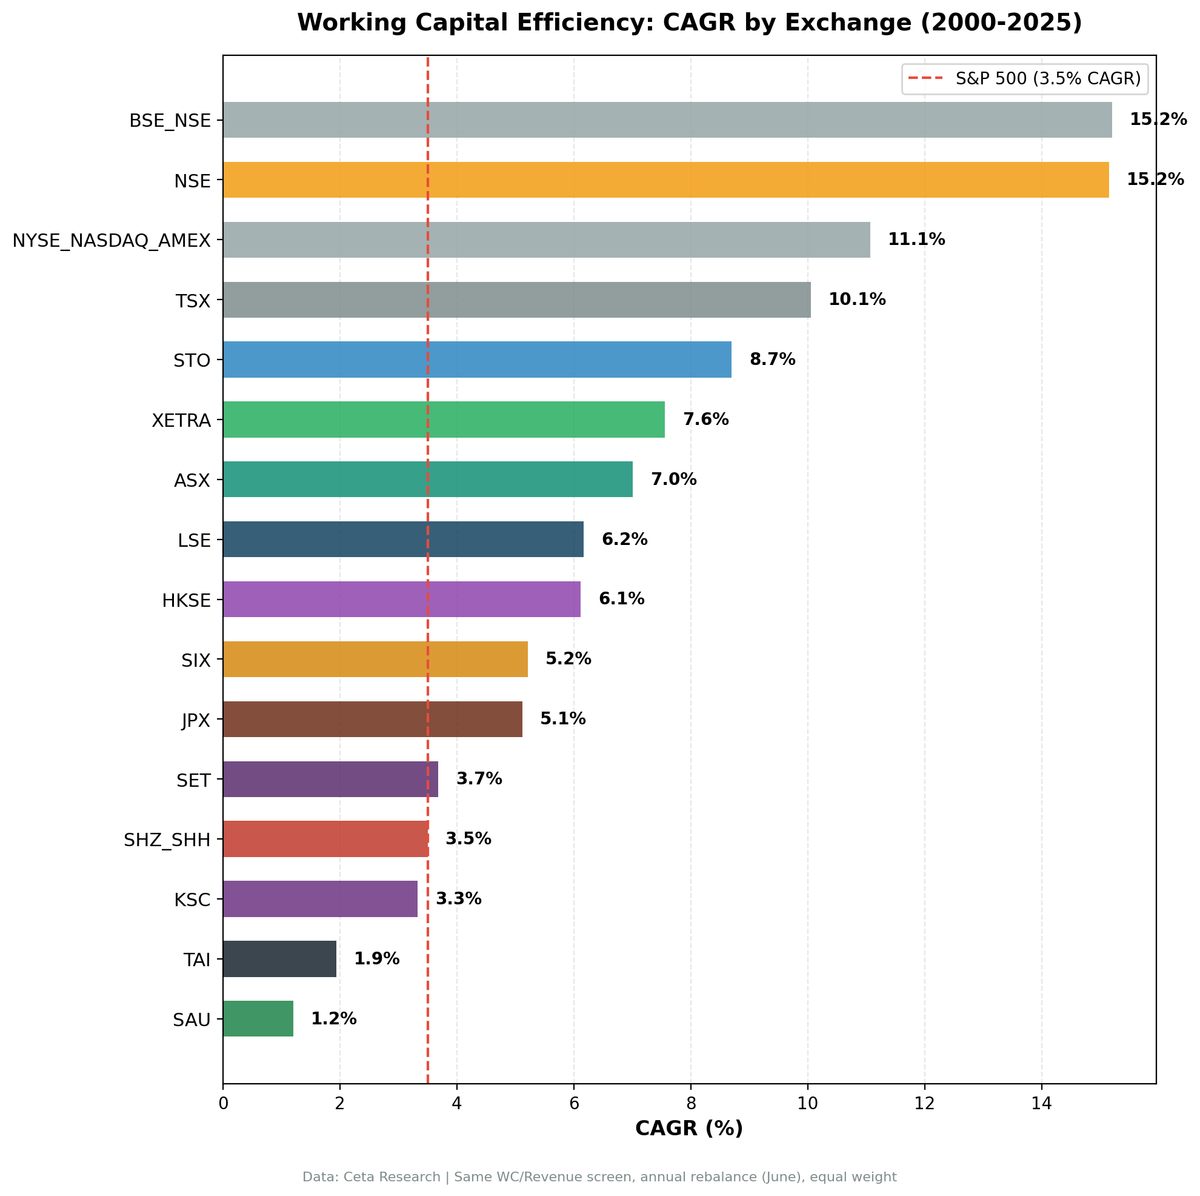
All 14 Exchanges
Each exchange is benchmarked against its local index (same currency). Saudi Arabia uses S&P 500 because its local index lacks price data in FMP.
| Rank | Exchange | CAGR | vs Local Bench | Benchmark | Sharpe | MaxDD | Cash% |
|---|---|---|---|---|---|---|---|
| 1 | Sweden (STO) | 8.70% | +6.51% | OMX30 | 0.366 | -36.48% | 20% |
| 2 | Canada (TSX) | 10.05% | +5.99% | TSX Composite | 0.496 | -21.0% | 0% |
| 3 | UK (LSE) | 6.17% | +5.04% | FTSE 100 | 0.155 | -27.50% | 0% |
| 4 | Hong Kong (HKSE) | 6.12% | +4.45% | Hang Seng | 0.132 | -28.00% | 0% |
| 5 | US (NYSE+NASDAQ+AMEX) | 11.07% | +3.44% | S&P 500 | 0.614 | -30.42% | 0% |
| 6 | Switzerland (SIX) | 5.21% | +3.43% | SMI | 0.202 | -52.04% | 0% |
| 7 | India (NSE) | 15.15% | +2.82% | Sensex | 0.386 | -23.49% | 20% |
| 8 | Germany (XETRA) | 7.56% | +2.75% | DAX | 0.375 | -26.51% | 0% |
| 9 | Japan (JPX) | 5.12% | +1.86% | Nikkei 225 | 0.236 | -56.28% | 16% |
| 10 | China (SHZ+SHH) | 3.50% | +1.23% | SSE Composite | 0.026 | -56.88% | 0% |
| 11 | Thailand (SET) | 3.68% | -1.26% | SET Index | 0.058 | -42.08% | 20% |
| 12 | Taiwan (TAI) | 1.94% | -1.57% | TAIEX | 0.076 | -22.43% | 28% |
| 13 | Korea (KSC)* | 3.33% | -1.86% | KOSPI | 0.023 | -23.13% | 32% |
| 14 | Saudi Arabia (SAU)* | 1.20% | -6.44% | S&P 500 | -0.120 | -43.00% | 36% |
*Korea and Saudi Arabia had >30% cash periods. The quality filters are too strict for these markets.
The Outperformers
Ten exchanges beat their local benchmark. Each tells a different story.
Sweden: Best Excess Return (+6.51%/yr vs OMX30)
Sweden produced the highest excess return of any exchange. 8.70% CAGR vs 2.19% for the OMX Stockholm 30. The 76% win rate (19 of 25 years) is the highest globally. The OMX30 was weak over this period, so the large excess partly reflects a low bar. But the absolute 8.70% CAGR is solid.
Canada: Most Defensive (+5.99%/yr vs TSX Composite)
Canada had the shallowest max drawdown: -21.0%. The TSX Composite's was -28.80%. The CAGR of 10.05% beats the TSX by 5.99% per year. Zero cash periods, 23.5 average stocks, and a down capture of just 5.4%.
UK: Strong Alpha Despite Small Portfolio (+5.04%/yr vs FTSE 100)
The UK returned 6.17% CAGR vs 1.13% for the FTSE 100. That's +5.04% annual excess with 68% win rate. The portfolio averaged just 11.0 stocks (smallest of any exchange), so concentration risk is higher. The FTSE 100 has been one of the weakest major indices over this period, which flatters the excess.
Hong Kong: Local Alpha (+4.45%/yr vs Hang Seng)
Against the Hang Seng (which returned just 1.68% CAGR over 25 years), the portfolio's 6.12% CAGR looks strong: +4.45% annual excess with 56% win rate.
US: Best Risk-Adjusted (Sharpe 0.614, +3.44%/yr)
The US returned 11.07% CAGR with +3.44% excess vs SPY. The Sharpe ratio of 0.614 is the best of any exchange. Down capture of 13%: for every dollar the market lost, this portfolio lost 13 cents. Zero cash periods, fully invested for 25 years.
Switzerland: Flipped to Positive (+3.43%/yr vs SMI)
Switzerland previously appeared to underperform when benchmarked against SPY. With a local SMI benchmark (1.78% CAGR), the portfolio's 5.21% CAGR shows +3.43% excess with 60% win rate. Only 11.7 average stocks, so concentration risk is a factor.
India: Highest Absolute Return (15.15% CAGR, +2.82%/yr vs Sensex)
India still has the highest absolute CAGR at 15.15%. But against the Sensex (which returned 12.32%), the excess is a more modest +2.82%. Five cash periods (2000-2004) when too few Indian stocks qualified. The Sensex itself was strong, so the bar was higher.
Germany, Japan, China: Moderate Outperformers
Germany (+2.75% vs DAX), Japan (+1.86% vs Nikkei), and China (+1.23% vs SSE Composite) all showed positive excess. The signal works in these markets, just not as strongly.
The Underperformers
Four exchanges had negative excess returns vs their local benchmark. This is expected. No strategy works everywhere.
Thailand (-1.26%/yr vs SET Index)
Thailand had 20% cash periods and -1.26% excess vs the SET Index. With a local benchmark (instead of the previous SPY comparison), the underperformance is modest. Thin early data and higher transaction costs for mid-cap Thai stocks limit the signal.
Taiwan (-1.57%/yr vs TAIEX)
Taiwan had 28% cash periods and -1.57% excess vs TAIEX. The TSE is semiconductor-heavy. TSMC and its supply chain dominate the index. Working capital efficiency in a hardware-heavy market works differently than in services or consumer sectors.
Korea (-1.86%/yr vs KOSPI)
Korea had 32% cash periods and -1.86% excess. The quality filters are too strict for the Korean market at the $500M+ market cap threshold.
Saudi Arabia (-6.44%/yr vs SPY)
Saudi had 36% cash periods and -6.44% excess. The quality filters are too strict for this market. Thin early data and no local benchmark available.
Why It Works in Most Markets
The signal works in 10 of 14 markets when measured against local benchmarks. Three patterns explain the variation:
Benchmark quality matters most. The biggest driver of excess returns is how the local index performed. Sweden (+6.51%) and Canada (+5.99%) have high excess partly because the OMX30 and TSX Composite were weak indices over this period. The US (+3.44%) has lower excess because SPY is a hard benchmark to beat.
Market composition matters. The strategy works best in markets with a broad mix of sectors (US, UK, Canada, Germany). It still struggles in markets dominated by a single sector (Taiwan = semiconductors), but this effect is smaller than the benchmark quality effect.
Coverage depth matters. Less analyst coverage creates more mispricing. Sweden and Hong Kong, with thinner mid-cap coverage, produced strong excess returns. The US, the most covered market, still generated +3.44% excess, suggesting the signal has genuine economic content beyond mispricing.
The High-Cash Exchanges
Saudi Arabia (36% cash) and Korea (32% cash) had too many periods without enough qualifying stocks. The market cap thresholds combined with strict quality filters eliminated too many companies. Korea's 3.33% CAGR vs KOSPI's 5.20% includes 8 cash periods.
These results aren't comparable to the other 12 exchanges. They're included to document what happens when the signal's universe is too narrow.
Run It Yourself
# Run all exchanges
python3 working-capital/backtest.py --global --output results/exchange_comparison.json --verbose

# Run a specific exchange
python3 working-capital/backtest.py --preset us --output results/us.json --verbose
python3 working-capital/backtest.py --preset india --output results/india.json --verbose
Takeaway
Working capital efficiency works as a stock selection signal in most markets when measured against the right benchmark. 10 of 14 exchanges beat their local index. The strategy's alpha is broader than we originally thought.
The biggest lesson: benchmark choice matters. When we compared everything to SPY, many exchanges appeared to underperform. When we switched to local benchmarks (OMX30, SMI, SET Index, etc.), several flipped to positive excess. Switzerland went from -1.08% vs SPY to +3.43% vs SMI. Sweden went from +1.17% vs SPY to +6.51% vs OMX30. The signal was working. It just wasn't beating the US market from abroad.
The 4 underperformers (Thailand, Taiwan, Korea, Saudi Arabia) have specific structural reasons: semiconductor dominance, too-strict quality filters for smaller markets, or thin early data.
Data: Ceta Research (FMP financial data warehouse), 14 exchanges tested, 2000-2025. Each exchange benchmarked against its local index. Full methodology: METHODOLOGY.md
Past performance does not guarantee future results. This is educational content, not investment advice.


