
Yield Gap Canada: +5.21% Annual Alpha Over TSX Composite, 72% Win Rate (2000-2025)
The yield gap strategy on TSX stocks returned 9.64% CAGR vs 4.44% for the TSX Composite (+5.21% excess) over 25 years. The strategy beat the local index in 72% of invested years, and outperformed SPY by +2.00% annually.


title: "Yield Gap Canada: +5.21% Annual Alpha Over TSX Composite, 72% Win Rate (2000-2025)" slug: yield-gap-canada-backtest publish_date: 2026-03-21 tags: [backtests, canada-markets, value-investing, earnings-yield, TSX] post_access: public excerpt: "The yield gap strategy on TSX stocks returned 9.64% CAGR vs 4.44% for the TSX Composite (+5.21% excess) over 25 years. The strategy beat the local index in 72% of invested years, and outperformed SPY by +2.00% annually." authors: [Swas] feature_image: 1_canada_cumulative_growth.png feature_image_alt: "Growth of $10,000: Yield Gap Canada vs TSX Composite (2000-2025)"
Contents
Data: FMP financial data warehouse, 2000–2025. Updated March 2026.
The yield gap strategy on Canadian stocks delivered strong and consistent alpha over the local TSX Composite index over 25 years. The TSX Composite itself had a weak run — 4.44% CAGR from 2000-2025. The yield gap screen, selecting for high earnings yield and quality, returned 9.64% CAGR — +5.21% annually above the local benchmark, with a 72% win rate.
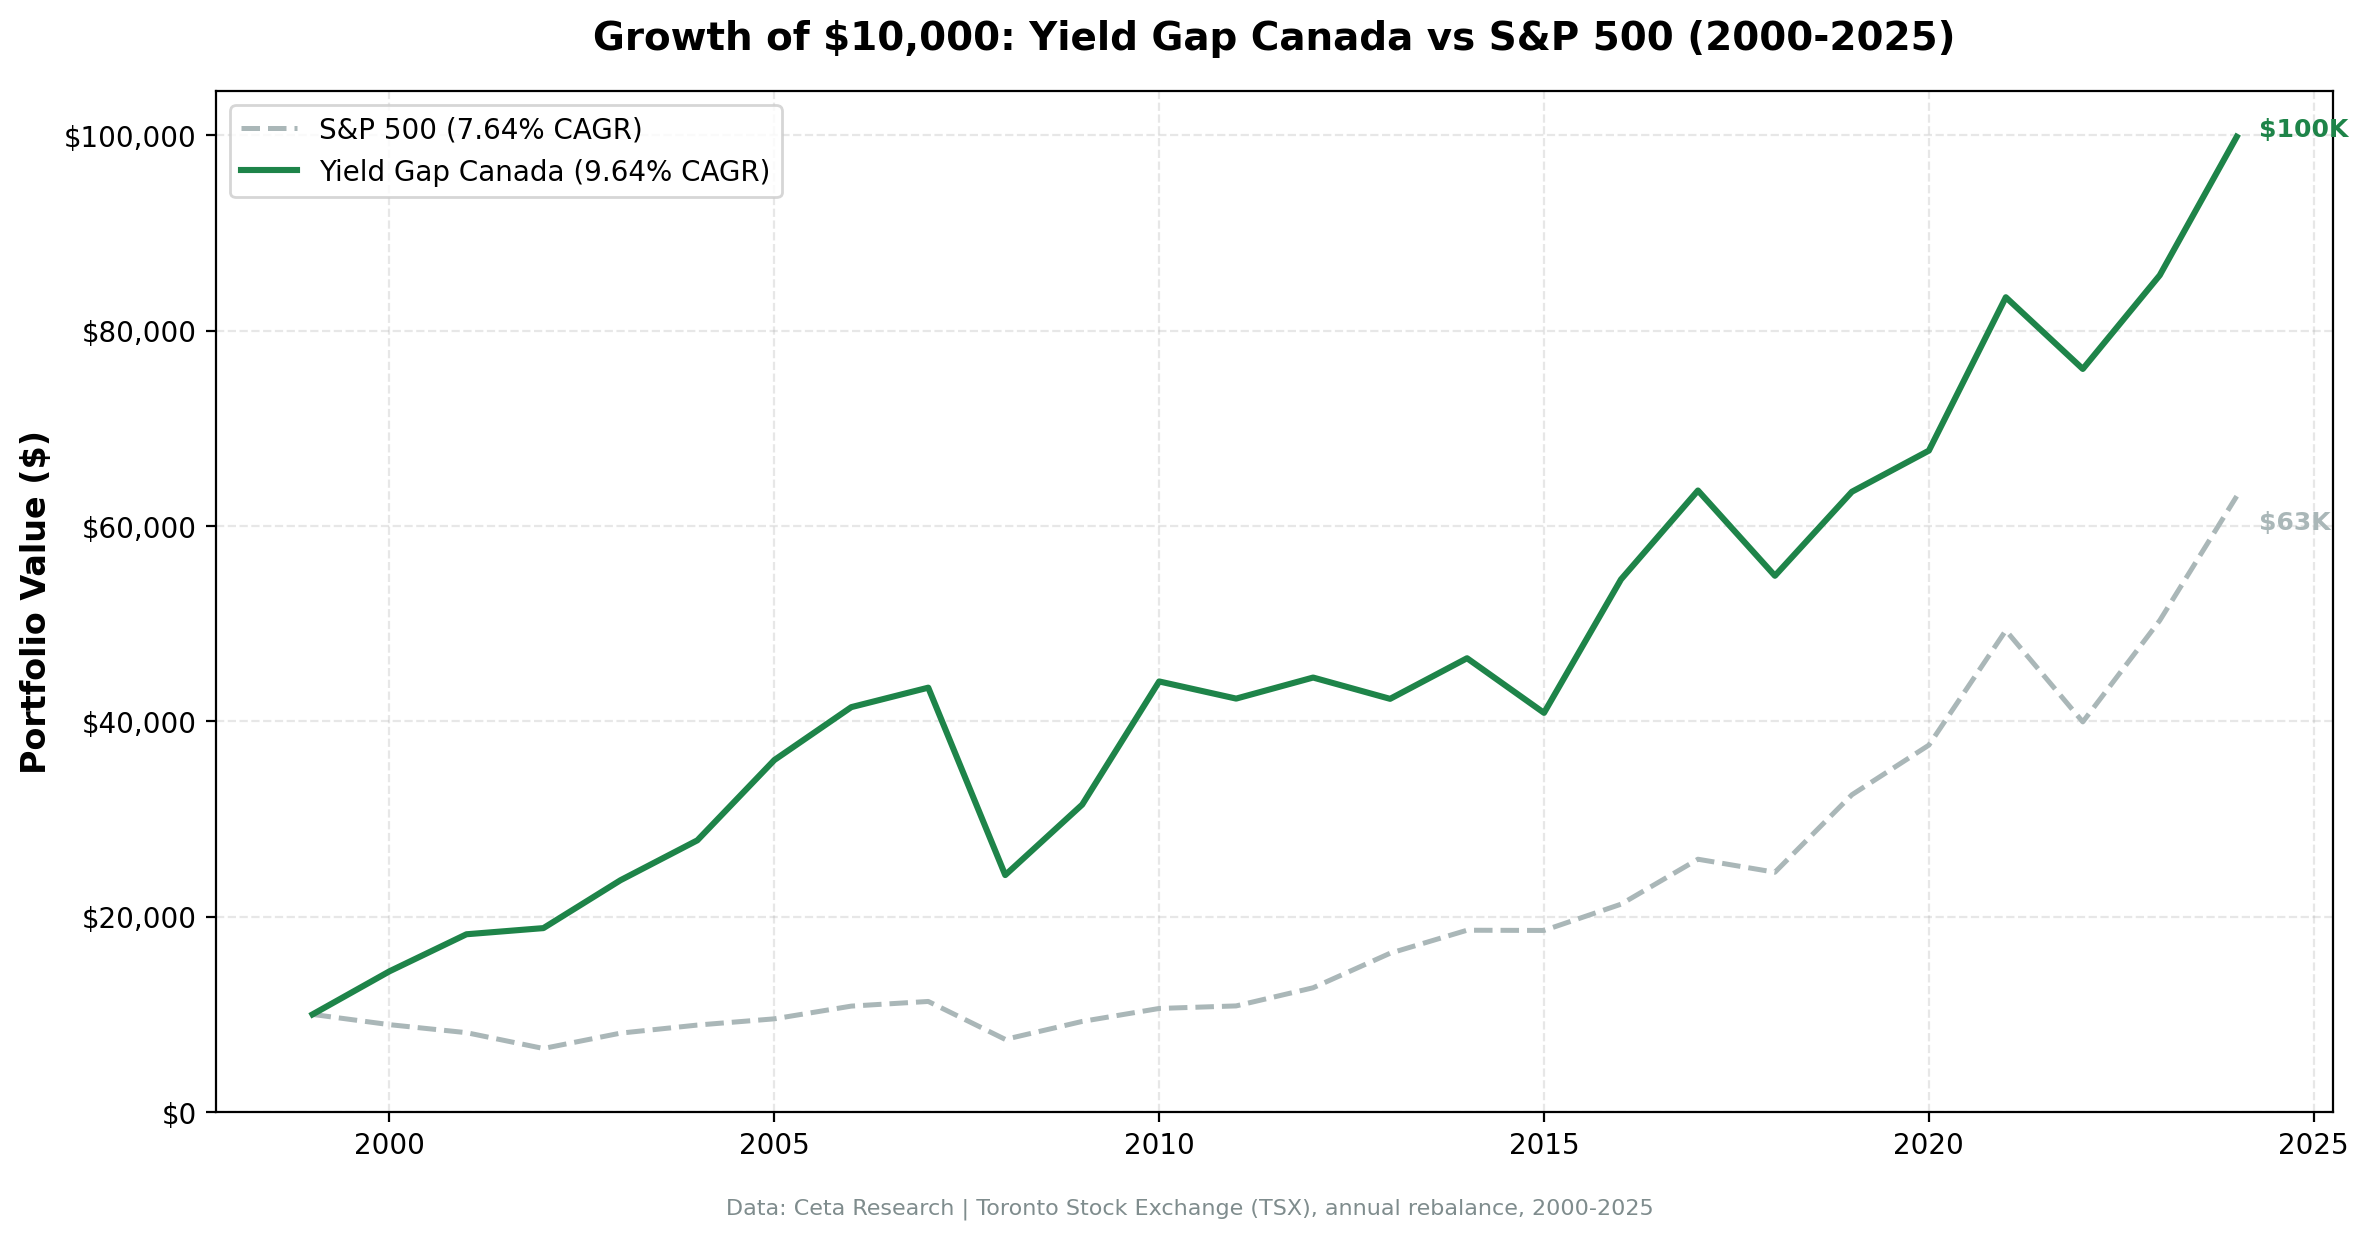
A $10,000 investment in January 2000 grew to $99,871. The TSX Composite grew to roughly $29,900 over the same period. SPY grew to $63,066.
The Strategy
The effective earnings yield threshold for Canada is 6% (the 6% absolute floor, since Canada's risk-free rate of roughly 2% plus 3% spread equals 5%, and we use the 6% floor as the binding constraint).
Signal: - Earnings yield > 6% (PE < ~16.7x) - Earnings yield < 50% - ROE > 8% - D/E < 2.0
Portfolio construction: Top 30 by highest earnings yield, equal weight, annual January rebalance. Cash if fewer than 10 stocks qualify.
Methodology
- Universe: Toronto Stock Exchange (TSX)
- Market cap filter: CAD 1B+ at each rebalance date
- Data period: January 2000 through December 2025 (25 annual periods, 0 cash years)
- Rebalancing: Annual (January)
- Point-in-time data: FY filings with 45-day filing lag
- Transaction costs: Size-tiered model
- Benchmark: TSX Composite (local Canadian benchmark)
- Data source: Ceta Research FMP financial data warehouse
Full methodology at github.com/ceta-research/backtests/blob/main/METHODOLOGY.md.
Results
| Metric | Yield Gap Canada | TSX Composite |
|---|---|---|
| CAGR | 9.64% | 4.44% |
| Total return (25yr) | 898.7% | ~196% |
| Max drawdown | -44.16% | -33.70% |
| Sharpe ratio | 0.367 | — |
| Down capture vs TSX | 53.7% | — |
| Win rate vs TSX | 72.0% | — |
| Cash periods | 0 of 25 years | — |
| Avg stocks (invested) | 23.9 | — |
The TSX Composite had a weak run from 2000-2025 — 4.44% CAGR vs SPY's 7.64%. The yield gap screen beat the local index by +5.21% annually and won in 72% of invested years. The 53.7% down-capture vs TSX means when the local index fell, the portfolio fell only about half as much. Fully invested the entire period.
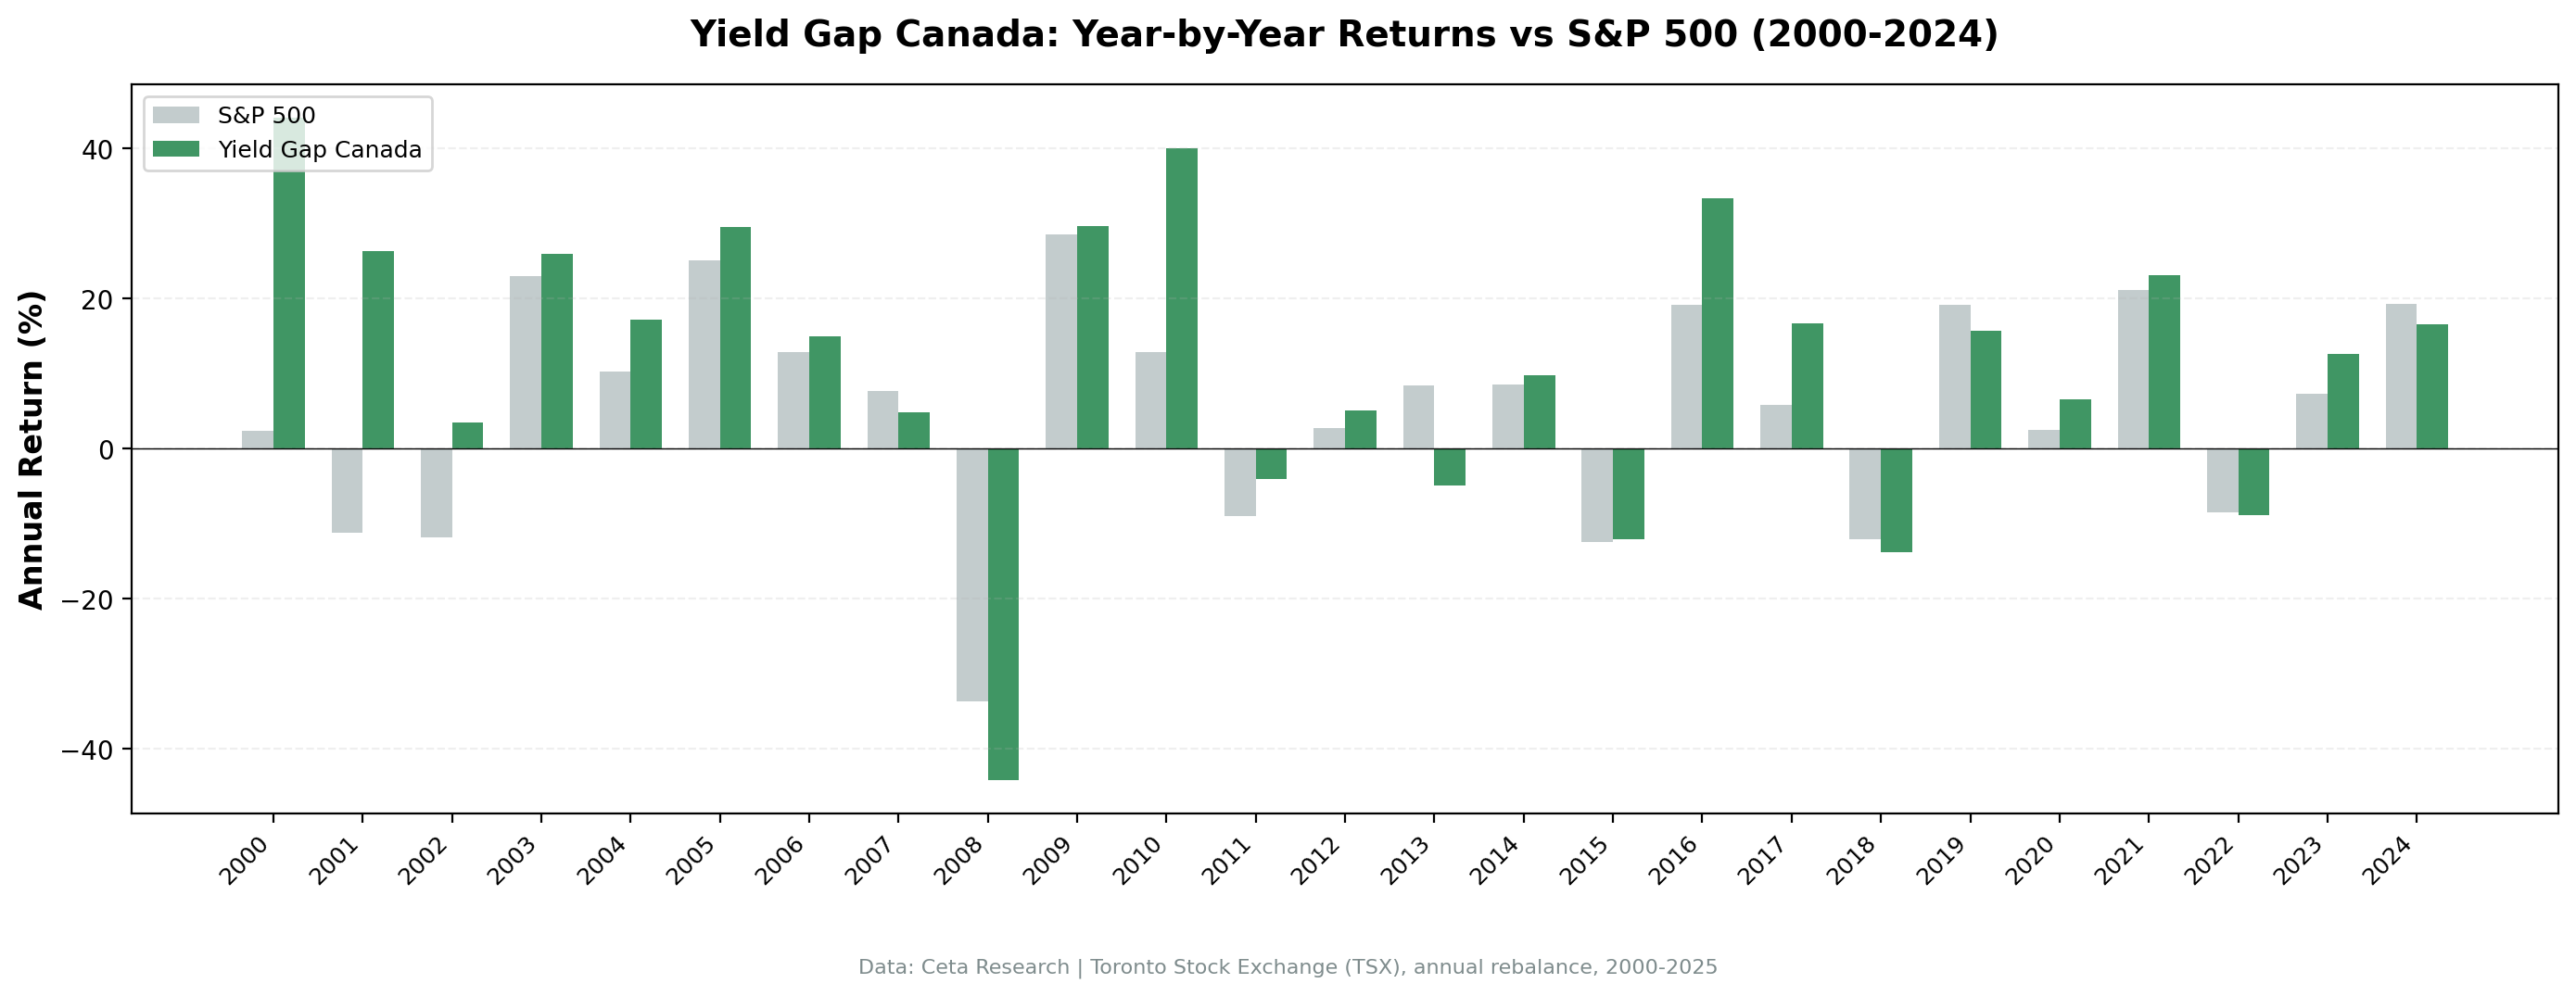
Annual returns (portfolio vs TSX Composite):
| Year | Portfolio | TSX Composite | Excess |
|---|---|---|---|
| 2000 | +44.13% | +2.35% | +41.78% |
| 2001 | +26.31% | -11.20% | +37.51% |
| 2002 | +3.47% | -11.86% | +15.33% |
| 2003 | +26.00% | +23.05% | +2.95% |
| 2004 | +17.24% | +10.24% | +7.00% |
| 2005 | +29.54% | +25.14% | +4.40% |
| 2006 | +15.03% | +12.95% | +2.08% |
| 2007 | +4.81% | +7.76% | -2.95% |
| 2008 | -44.16% | -33.70% | -10.47% |
| 2009 | +29.73% | +28.51% | +1.22% |
| 2010 | +40.06% | +12.94% | +27.12% |
| 2011 | -3.98% | -8.91% | +4.92% |
| 2012 | +5.09% | +2.72% | +2.37% |
| 2013 | -4.90% | +8.40% | -13.30% |
| 2014 | +9.83% | +8.53% | +1.30% |
| 2015 | -12.04% | -12.38% | +0.34% |
| 2016 | +33.43% | +19.15% | +14.28% |
| 2017 | +16.69% | +5.89% | +10.80% |
| 2018 | -13.72% | -12.03% | -1.68% |
| 2019 | +15.67% | +19.19% | -3.52% |
| 2020 | +6.63% | +2.50% | +4.13% |
| 2021 | +23.19% | +21.16% | +2.03% |
| 2022 | -8.80% | -8.44% | -0.36% |
| 2023 | +12.61% | +7.35% | +5.26% |
| 2024 | +16.55% | +19.29% | -2.74% |
The Sectoral Explanation
The TSX is structurally different from US exchanges. Energy, materials, and financials make up a much larger share of the Canadian market than they do of the S&P 500. When you screen for high earnings yield and quality on the TSX, you naturally concentrate in these sectors — companies with real asset bases, steady cash flows, and conservative balance sheets. This tends to produce better results vs the local index than vs SPY.
2000-2007 showed this clearly. The dotcom bust hit US growth stocks hard but barely touched Canadian energy and resource companies. From 2000 to 2007, the Canadian yield gap portfolio consistently beat the TSX Composite. The market's composition meant there were always qualifying stocks with high earnings yields and low debt that also outperformed the broader index.
2008 was the exception. When commodity prices collapsed in 2008, energy and materials companies fell sharply. The -44.16% drawdown was -10.47% worse than the TSX Composite's -33.70%. The yield gap screen concentrated in the most commodity-exposed names; they fell hardest.
2013 was the worst relative year. -4.90% vs TSX +8.40% (-13.30% excess). Energy stocks began underperforming as shale production ramped up in the US, dragging Canadian oil sands valuations. The TSX Composite had broader sector coverage; the yield gap screen was overweight the underperforming names.
2016 reversed all of that. +33.43% vs TSX +19.15% (+14.28% excess). Energy and materials recovered sharply as commodity prices rebounded. The portfolio had concentrated in beaten-down resource stocks during the underperformance — the very ones that bounced.
2022 showed consistent tracking. -8.80% vs TSX -8.44% (-0.36% excess). Both moved nearly identically when energy stocks corrected despite their earlier surge. The yield gap screen was well-positioned for the energy upcycle but gave back some gains when the cycle turned.
Run It Yourself
Current Canada yield gap screen:
SELECT
    k.symbol,
    p.companyName,
    p.exchange,
    p.sector,
    ROUND(k.earningsYieldTTM * 100, 2) AS earnings_yield_pct,
    ROUND(1.0 / NULLIF(k.earningsYieldTTM, 0), 1) AS implied_pe,
    ROUND(k.returnOnEquityTTM * 100, 2) AS roe_pct,
    ROUND(fr.debtToEquityRatioTTM, 2) AS debt_to_equity,
    ROUND(k.freeCashFlowYieldTTM * 100, 2) AS fcf_yield_pct,
    ROUND(k.marketCap / 1e9, 2) AS mktcap_b
FROM key_metrics_ttm k
JOIN profile p ON k.symbol = p.symbol
JOIN financial_ratios_ttm fr ON k.symbol = fr.symbol
WHERE k.earningsYieldTTM > 0.06
  AND k.earningsYieldTTM < 0.50
  AND k.returnOnEquityTTM > 0.08
  AND (fr.debtToEquityRatioTTM IS NULL
       OR (fr.debtToEquityRatioTTM >= 0 AND fr.debtToEquityRatioTTM < 2.0))
  AND k.marketCap > 1000000000          -- CAD 1B+
  AND (p.industry IS NULL OR p.industry NOT LIKE 'Asset Management%')
  AND (p.industry IS NULL OR p.industry NOT LIKE 'Shell Companies%')
  AND p.exchange IN ('TSX')
ORDER BY k.earningsYieldTTM DESC
LIMIT 30
Full backtest:
git clone https://github.com/ceta-research/backtests.git
cd backtests
pip install -r requirements.txt
python3 yield-gap/backtest.py --preset canada --output results.json --verbose
Limitations
Currency risk: Returns in CAD. CAD/USD has fluctuated between 0.62 and 1.10 over this period. A USD-based investor's actual returns would differ depending on the timing of currency moves.
Commodity concentration: The TSX bias toward energy and materials means this strategy is effectively a bet on those sectors continuing to have high earnings yields. If oil prices remain depressed for an extended period, the screen may identify fewer qualifying stocks or consistently include companies whose earnings yields are high because earnings are temporarily elevated.
2008 as a tail risk: The -44.16% drawdown in 2008 was deeper than SPY's -34.31%. Commodity exposure created correlation with global risk assets at exactly the wrong moment.
Data: Ceta Research (FMP financial data warehouse), January 2000 through December 2025. Full methodology: github.com/ceta-research/backtests/blob/main/METHODOLOGY.md.
Academic references: Campbell, J.Y. & Vuolteenaho, T. (2004). "Bad Beta, Good Beta." American Economic Review, 94(5). Damodaran, A. (2012). "Equity Risk Premiums (ERP): Determinants, Estimation and Implications." Stern School of Business.
Past performance does not guarantee future results. This is educational content, not investment advice.


