
Do Analyst Upgrades Actually Move Stock Prices? We Measured 66,742 of Them


We ran an event study on 13 years of individual analyst rating changes on US stocks. The average upgrade produces +0.65% abnormal return on day one, but not all upgrades are equal: when two or more analysts upgrade the same stock within 30 days of each other, the drift is 5x larger at one month. Downgrades don't recover, they keep falling for three months.
Contents
- Method
- What We Found
- Upgrades move stocks immediately, and the effect holds for weeks
- Clustered upgrades: 5x the drift at one month
- Magnitude matters, but less than you'd expect
- Downgrades don't recover
- The asymmetry
- The Data
- Limitations
- The SQL
- Takeaway
Method
- Data source: Ceta Research (FMP stock_grade table, individual analyst grade changes)
- Universe: NYSE, NASDAQ, AMEX, market cap above $1B USD
- Period: 2012–2025 (14 years, 136,610 events)
- Study type: Event study. Each event is measured independently. Not a portfolio backtest.
- Benchmark: SPY (S&P 500 ETF)
- Windows: T+1, T+5, T+21, T+63 trading days after the event
- Abnormal return: Stock return minus SPY return at each window
- Deduplication: If the same analyst firm revises the same stock on the same date multiple times (data fetch artifact), only the most recent record is kept.
- Winsorization: 1st/99th percentile applied before computing statistics to reduce outlier impact.
Each analyst upgrade or downgrade is treated as a separate event. We don't aggregate to consensus, we measure each firm's individual revision.
What counts as an upgrade: The action column in FMP's stock_grade table is 'upgrade'. This captures grade changes like Hold→Buy, Sell→Buy, Neutral→Overweight.
Cluster detection: An upgrade is classified as "clustered" when two or more distinct analyst firms upgrade the same stock within 30 calendar days of each other. Single means no other firms upgraded within that window.
Magnitude classification: - Small (+2): Hold→Buy type moves (the most common) - Large (+4): Sell→Buy type moves (rare, stronger prior conviction change)
What We Found
Upgrades move stocks immediately, and the effect holds for weeks
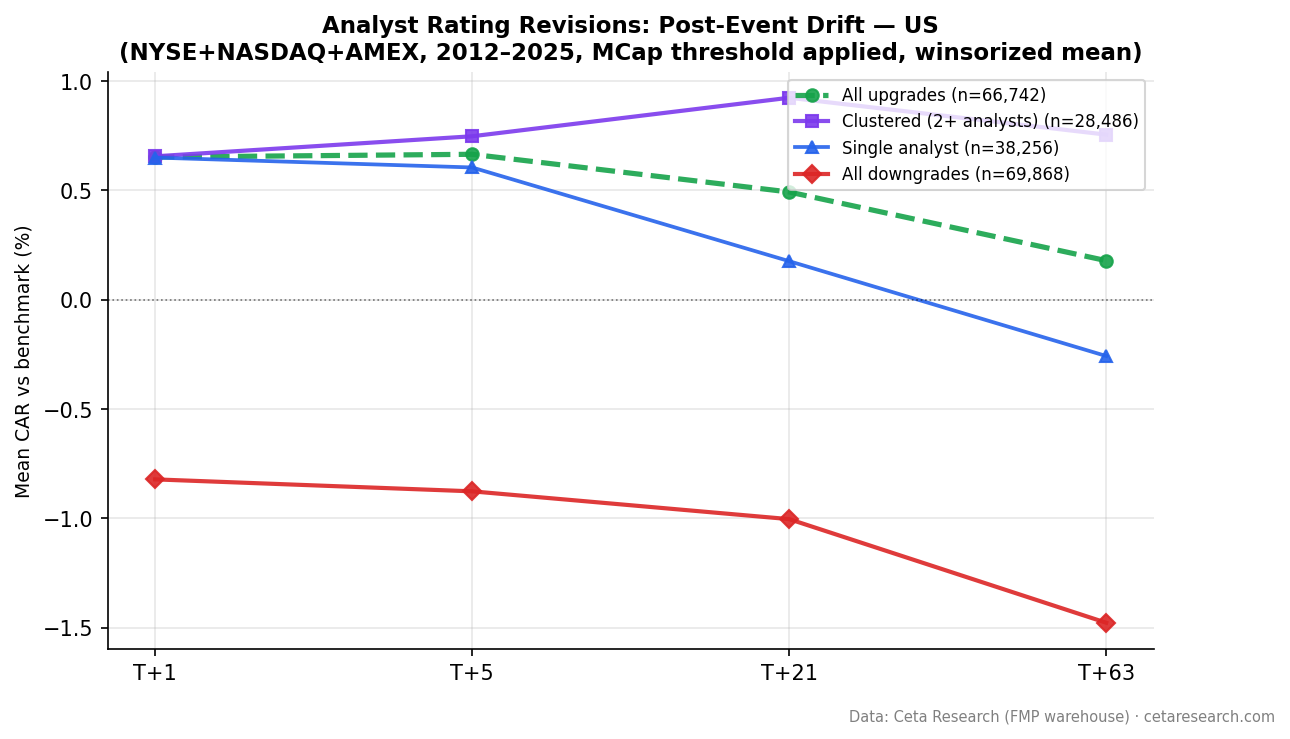
The average analyst upgrade on a US stock produces +0.65% abnormal return vs SPY on day one (t=62.6, n=66,742). The drift doesn't fully fade at one month: +0.49% at T+21, still statistically significant.
| Window | Upgrade CAR | t-stat | Downgrade CAR | t-stat |
|---|---|---|---|---|
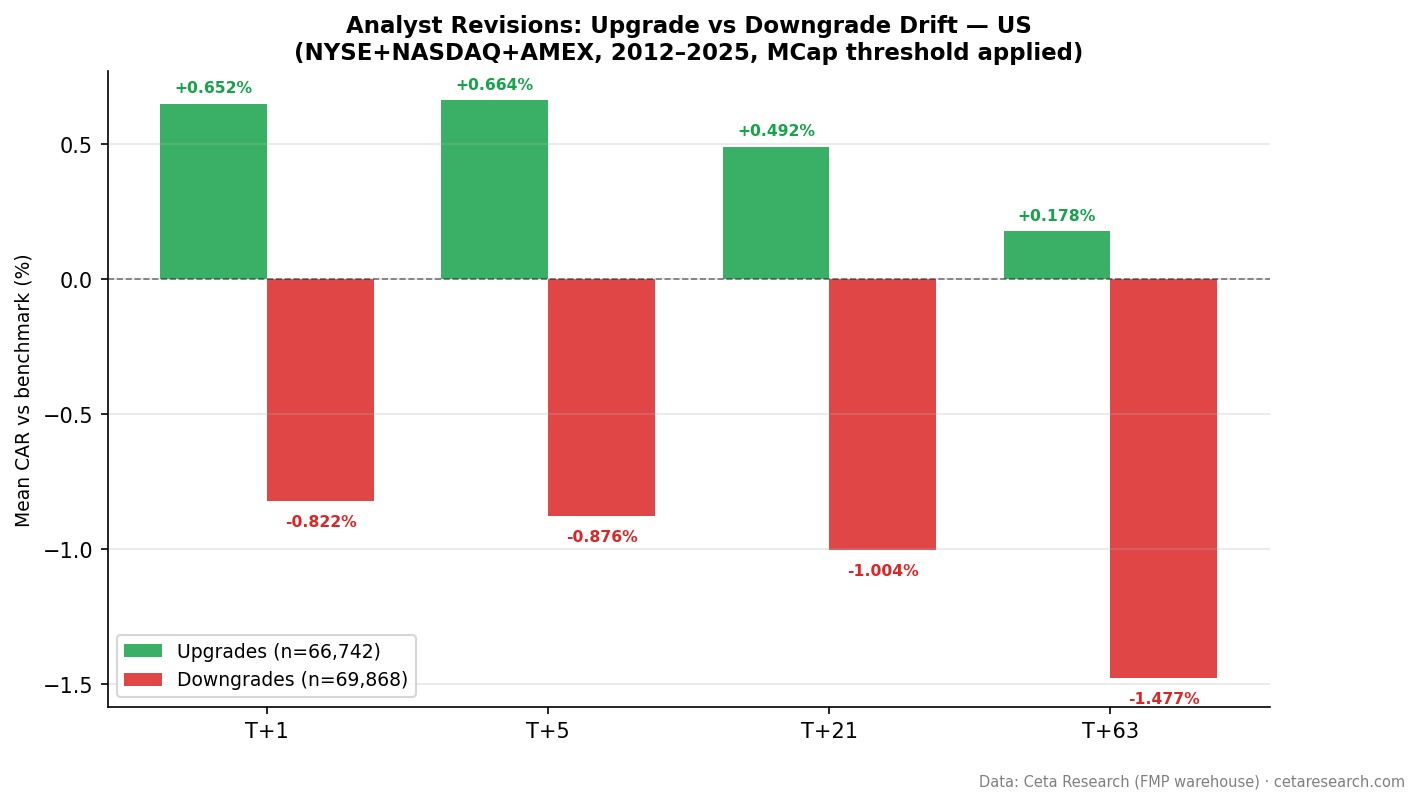
| T+1 | +0.652% | 62.6 | -0.822% | -65.9 |
| T+5 | +0.664% | 34.8 | -0.876% | -40.9 |
| T+21 | +0.492% | 13.6 | -1.004% | -25.6 |
| T+63 | +0.178% | 2.8 | -1.477% | -21.9 |
n=66,742 upgrades, n=69,868 downgrades. Winsorized mean.
That's the aggregate. The split between clustered and single-analyst events tells a different story.
Clustered upgrades: 5x the drift at one month
When two or more independent analyst firms upgrade the same stock within 30 days, the signal is much stronger.
| Category | T+1 | T+5 | T+21 | T+63 |
|---|---|---|---|---|
| Clustered (n=28,486) | +0.655% | +0.747% | +0.923% | +0.754% |
| Single (n=38,256) | +0.650% | +0.604% | +0.176% | -0.258% |
At T+21, clustered upgrades produce +0.92% vs +0.18% for single-analyst upgrades. That's a 5x difference.
Single-analyst upgrades turn negative by T+63 (-0.26%). Clustered upgrades stay positive at +0.75%. The persistence is what separates them.
The interpretation: when one analyst upgrades a stock, it might be idiosyncratic, sector rotation, client positioning, or just the firm's view. When multiple independent firms upgrade within 30 days, it suggests information flow that hasn't fully reached price.
Magnitude matters, but less than you'd expect
Large-magnitude upgrades (Sell→Buy, grade change of +4) show higher drift at one month than small ones:
| Category | n | T+21 CAR |
|---|---|---|
| Large (+4, Sell→Buy) | 1,376 | +1.643% |
| Small (+2, Hold→Buy) | 65,366 | +0.468% |
The large-magnitude upgrades produce more drift (+1.64% vs +0.47%), but they're rare (2% of events). The practical signal is in the cluster effect, which captures 43% of all events.
Downgrades don't recover
Downgrades accumulate over time. The average downgrade produces -0.82% on day one and keeps falling:
T+1: -0.82% → T+5: -0.88% → T+21: -1.00% → T+63: -1.48%
Three months after a downgrade, stocks are still underperforming SPY by 1.48% on average. All four windows are statistically significant (t-stats: -65.9, -40.9, -25.6, -21.9).
This is consistent with the academic literature on analyst recommendations: downgrades reflect information that takes time to be absorbed. Companies downgraded don't just move down on announcement, they continue underperforming for months.
The asymmetry
Upgrades and downgrades aren't mirror images: - Upgrades: drift fades over time (+0.65% → +0.18% at T+63) - Downgrades: drift accelerates over time (-0.82% → -1.48% at T+63)
Upgrades get priced in quickly. Downgrades don't. Whether this is rational (downgrades reflect genuinely deteriorating fundamentals that take quarters to play out) or behavioral (investors anchor to previous price levels after bad news) is an open question.
The Data
Limitations
This isn't a trading strategy. Event study returns don't account for transaction costs, slippage, or the practical difficulty of acting on analyst revisions before prices move. By the time a downgrade is public, the stock is already down.
Same-day execution is assumed. T+1 returns are computed from the trading day after the event date, but in practice revisions often come before market open, giving sophisticated participants a head start.
Market cap filter. We excluded stocks below $1B market cap. Smaller stocks may show different patterns (both stronger signals and worse liquidity).
Survivorship bias is limited. The event study measures returns from the event date forward. Stocks that were delisted create a negative tail in long-window returns, so T+63 figures may be slightly optimistic.
2012–2025 only. FMP's stock_grade coverage before 2012 is sparse. The results cover one extended bull market, one COVID crash-and-recovery, and a period of rapid rate change. A longer history would help.
The SQL
The current upgrade cluster screen for US stocks:
WITH deduped AS (
 SELECT
 symbol, CAST(date AS DATE) AS revision_date, gradingCompany,
 previousGrade, newGrade,
 ROW_NUMBER() OVER (
 PARTITION BY symbol, CAST(date AS DATE), gradingCompany
 ORDER BY dateEpoch DESC
 ) AS rn
 FROM stock_grade
 WHERE CAST(date AS DATE) >= CURRENT_DATE - INTERVAL '30' DAY
 AND action = 'upgrade'
 AND symbol IN (SELECT DISTINCT symbol FROM profile WHERE exchange IN ('NYSE', 'NASDAQ', 'AMEX'))
),
upgrades AS (
 SELECT symbol, revision_date, gradingCompany, previousGrade, newGrade
 FROM deduped WHERE rn = 1
),
clusters AS (
 SELECT
 symbol,
 COUNT(DISTINCT gradingCompany) AS distinct_analysts,
 MIN(revision_date) AS first_upgrade,
 MAX(revision_date) AS last_upgrade,
 STRING_AGG(DISTINCT gradingCompany, ', ' ORDER BY gradingCompany) AS analyst_firms,
 STRING_AGG(DISTINCT newGrade, ', ' ORDER BY newGrade) AS new_grades
 FROM upgrades
 GROUP BY symbol
 HAVING COUNT(DISTINCT gradingCompany) >= 2
)
SELECT clusters.*, mc.marketCap / 1e9 AS mktcap_b
FROM clusters
LEFT JOIN (
 SELECT symbol, marketCap, ROW_NUMBER() OVER (PARTITION BY symbol ORDER BY dateEpoch DESC) AS rn
 FROM key_metrics WHERE period = 'FY' AND marketCap IS NOT NULL
) mc ON clusters.symbol = mc.symbol AND mc.rn = 1
WHERE mc.marketCap > 1e9
ORDER BY distinct_analysts DESC, last_upgrade DESC
LIMIT 50
Takeaway
Analyst upgrades move US stocks by about +0.65% above benchmark on day one. That's real, statistically significant, and holds across 66,742 events over 14 years.
The cluster effect is where it gets interesting: when multiple independent firms upgrade within 30 days, the one-month drift is 5x larger than single-analyst upgrades (+0.92% vs +0.18%). Single-analyst upgrades fade and eventually turn negative by three months.
Downgrades don't behave symmetrically. They keep falling, from -0.82% on day one to -1.48% at three months. The information in a downgrade gets priced in slowly.
What does this mean practically? A single upgrade is a weak signal. Multiple upgrades from different firms within a month is a different kind of signal. Downgrades are worth taking seriously, not just for the day-one move, but for what tends to happen over the following quarter.
Part of a Series: S Global Comparison Event Study | Global | S Uk Lse Event Study | S Germany Xetra Event Study | US
Run It Yourself
Explore the data behind this analysis on Ceta Research. Query our financial data warehouse with SQL, build custom screens, and run your own backtests across 70,000+ stocks on 20 exchanges.
Data: FMP warehouse via Ceta Research, 2012–2025. Event study using individual analyst grade changes (stock_grade table).
Can you replicate these results? Every number in this post is derived from FMP's stock_grade table. The cluster screen SQL above reproduces the current signal. The backtest code is available on GitHub.


