Cash Flow
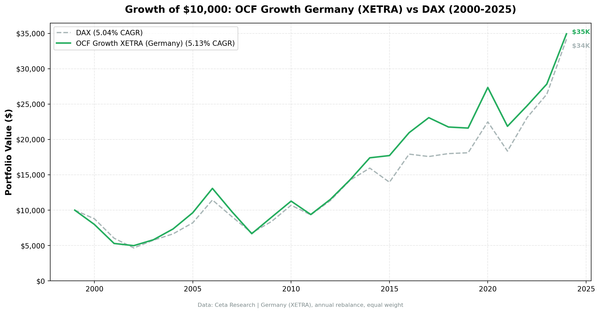
Germany: Roughly Matches the DAX, -50% Max Drawdown
OCF momentum returned 5.1% annually on German stocks vs the DAX's 5.0%, essentially a match (+0.1%). A 36% win rate and a -50.2% max drawdown make it a rough ride for no edge.


Cash Flow
OCF momentum returned 5.1% annually on German stocks vs the DAX's 5.0%, essentially a match (+0.1%). A 36% win rate and a -50.2% max drawdown make it a rough ride for no edge.
Cash Flow
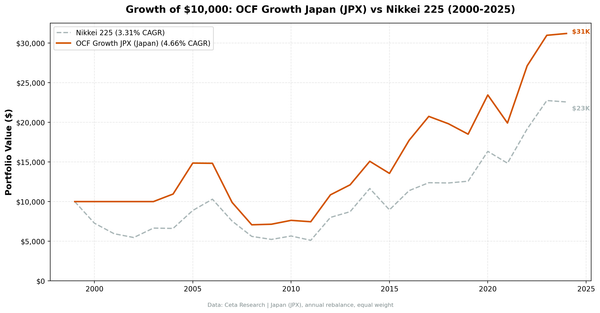
OCF momentum returned 4.7% annually on Japanese stocks vs the Nikkei 225's 3.3%, a +1.4% alpha. The signal now beats the Nikkei, with 4 of 25 cash periods and a -52% drawdown.
earnings
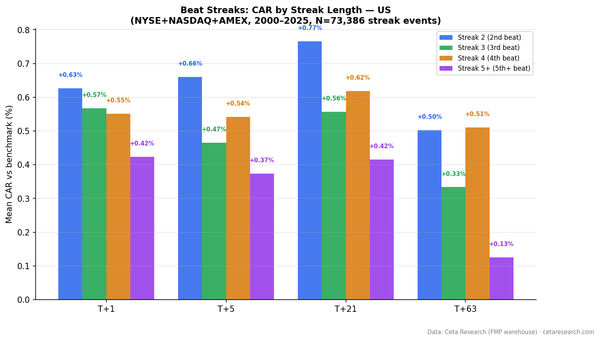
We analyzed 71,150 beat streak events on US exchanges, 2000-2025. A second consecutive beat produces +1.42% T+21 abnormal return vs SPY. Streak 2 and 3 are the sweet spot. Update August 2026: the mirror leg is now computed. Miss streaks drift -2.31% at T+21, so the signal passes its own inverse.
backtests
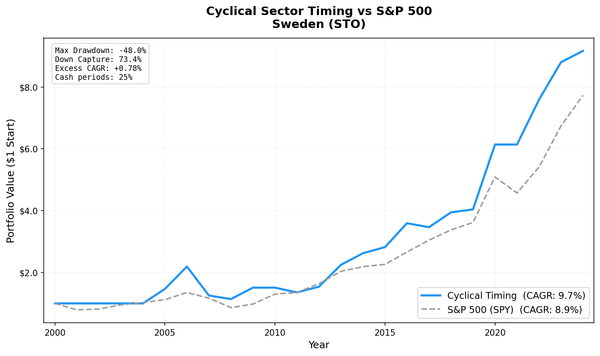
Sweden is one of two dedicated markets in our study with positive excess returns. 9.67% CAGR (+0.78% excess), Sharpe 0.344, high variance. The Swedish industrial economy fires the expansion signal less often but delivers strong results when invested.
event study
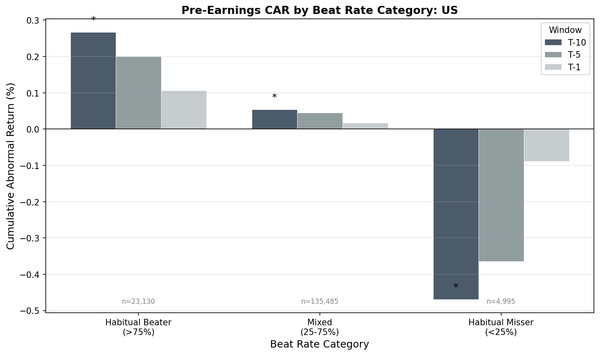
155,684 US earnings events from 2000-2025. Habitual beaters drift +0.289% vs S&P 500 in 10 days before announcements. Habitual missers fall -0.321%. The spread between best and worst beat-rate quintiles is 44bp.
event study
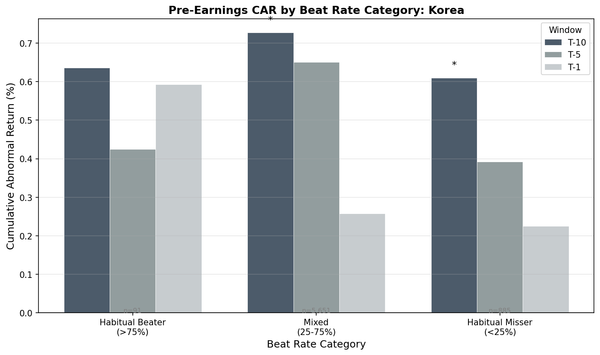
6,348 KOSPI earnings events from 2016-2025. Pre-earnings drift averages +0.745% vs KOSPI in 10 days before announcements. Both habitual missers (+0.593%) and mixed stocks (+0.772%) show the same drift. Beat rate doesn't matter in Korea.
event study
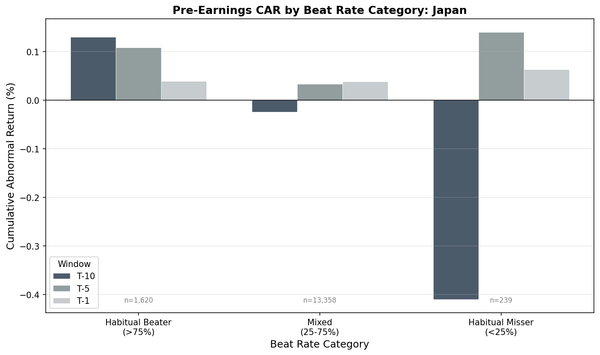
15,167 JPX earnings events from 2017-2025. When benchmarked against the Nikkei 225 instead of EWJ, the pre-earnings drift drops to -0.007% (t=-0.19). Not significant. The original +0.114% result was a benchmark artifact.
event study
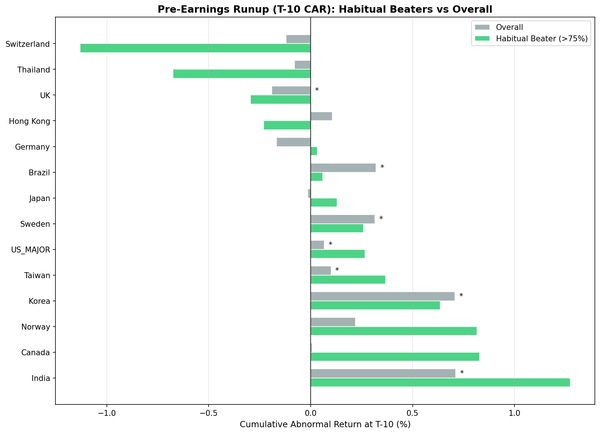
Pre-earnings drift across 13 markets with local currency benchmarks. Korea leads at +0.745% vs KOSPI. Japan's effect disappeared vs Nikkei. Taiwan flipped from negative to positive. Corrected August 2026: UK and Germany rows retracted, India withdrawn as untested.
event-study
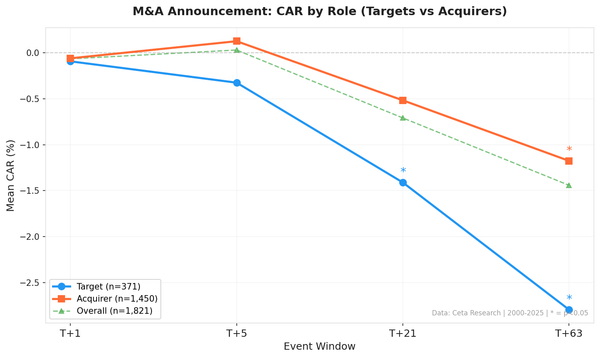
We ran an event study on 1,821 US M&A filings (2000-2025). After stricter data-quality controls, the short-term acquirer signal vanishes. The slow drift that remains is shared by both sides and concentrated in 2018-2025: universe drift, not a deal effect.
P/E compression
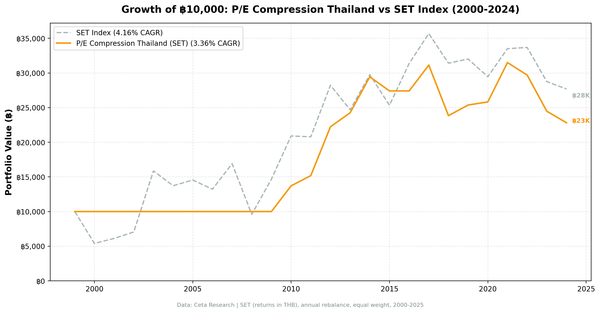
P/E compression on Thai stocks returns 3.36% annually vs 4.16% for the SET Index. The earlier +3.90% alpha was an artifact of thin price data. The strategy had no position at all in 11 of 25 years.
dividend investing
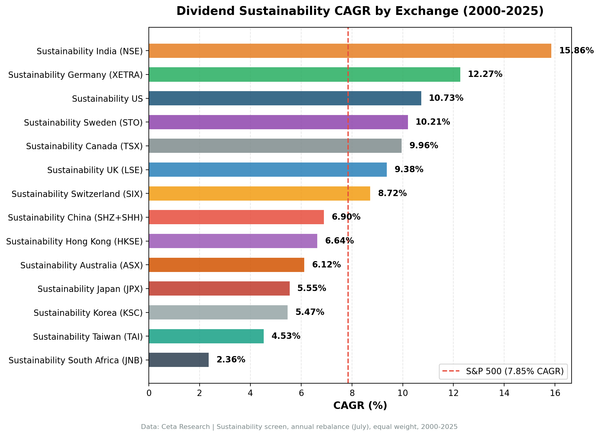
Sustainability score on 13 global exchanges, 2000-2025. All 13 re-tested exchanges beat their local market index. India led at 15.86% CAGR (NSE). Germany 0.652 Sharpe. UK +8.16% vs FTSE 100, largest local-benchmark excess in the series.
dividend investing
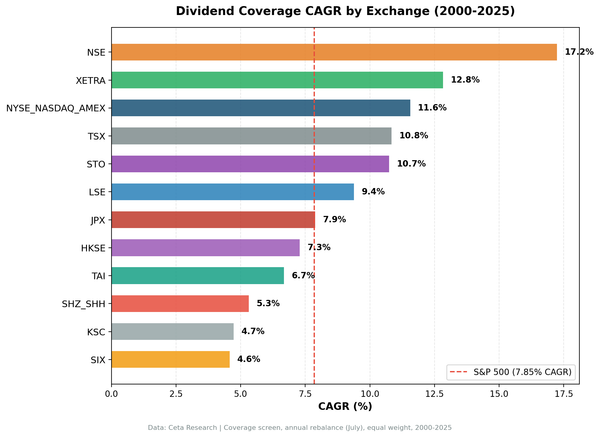
We ran the same FCF-based dividend coverage screen across 12 global exchanges. Six beat the S&P 500. India produced 17.24% CAGR. The screen works best where dividend culture runs deep.