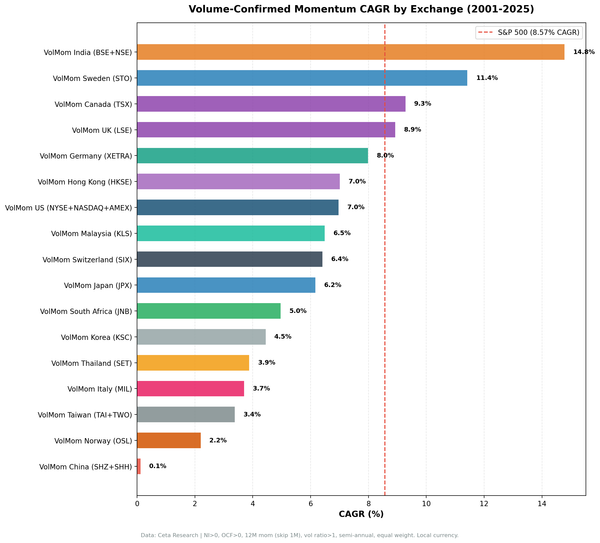
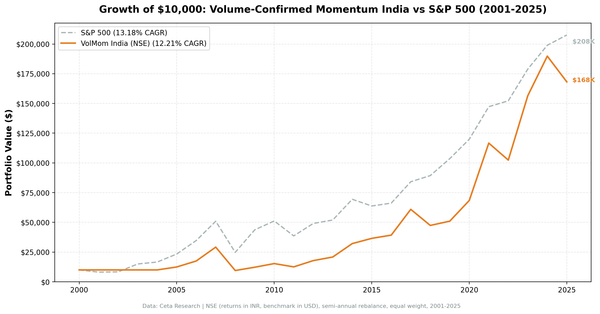
momentum investing
Quality Momentum on Swedish Stocks: 9.76% CAGR with Strong Upswings
Quality + momentum on Stockholm Stock Exchange from 2003 to 2025. 9.76% CAGR vs 7.75% SPY. 2.01% annual alpha with strong momentum capture in bull markets.
momentum investing
Quality + momentum on Stockholm Stock Exchange from 2003 to 2025. 9.76% CAGR vs 7.75% SPY. 2.01% annual alpha with strong momentum capture in bull markets.
momentum investing
We combined quality filters (ROE>15%, low debt, positive cash flow) with 12-month price momentum to screen US stocks from 2000 to 2025. The strategy returned 8.27% annually vs 7.75% for the S&P 500 — with 0% cash periods but 106.7% down capture.
quality investing
D/E < 0.5 + Piotroski F-Score >= 7 across the TSX returned 9.21% CAGR vs 3.95% for TSX Composite (+5.26% excess) over 25 years — with 29.11% down capture. When the Canadian market fell, this portfolio fell far less.
quality investing
D/E < 0.5 + Piotroski F-Score >= 7 on Chinese A-shares (SHH + SHZ), backtested 2000-2025. 5.39% CAGR vs 2.43% SSE Composite. +2.96% excess with 75.04% down capture. Two bubble events: +111.2% in 2006 and +83.8% in 2014. Volatility of 33.24% and max drawdown of -56.24%.
quality investing
We screened XETRA-listed German equities for D/E < 0.5 and Piotroski F-Score >= 7 across 25 years. Result: 6.39% CAGR vs 5.04% for the DAX. +1.35% excess with 51.08% down capture. 0 cash periods, 48 avg stocks.
quality investing
D/E < 0.5 + Piotroski F-Score >= 7 on HKSE-listed stocks, backtested 2000-2025. 3.84% CAGR vs 1.64% Hang Seng. The strategy beat the local benchmark by 2.20% annually, with max drawdown of -35.04% vs -40.45%. Down capture of 86.84% provided meaningful protection through Hong Kong's volatile...
value investing
D/E < 0.5 + Piotroski F-Score >= 7 on NSE, backtested 2000-2025. 13.78% CAGR vs Sensex 12.06%, +1.72% annual excess. Max drawdown -16.61% vs Sensex -32.20%. India delivers sustained alpha with half the drawdown.
quality investing
D/E < 0.5 and Piotroski F-Score >= 7 on JPX stocks across 25 years. 6.09% CAGR vs 3.31% Nikkei 225. +2.78% excess with 52.30% down capture. 114 avg qualifying stocks. Abenomics drove +47.4% in 2012 and +38.9% in 2014.
quality investing
D/E < 0.5 + Piotroski F-Score >= 7 on the Stockholm exchange returned 8.80% CAGR vs 2.55% for OMX Stockholm 30 (+6.25% excess), with 36.25% down capture and 7 protective cash periods. A thin but effective universe of 22 stocks.
quality investing
D/E < 0.5 + Piotroski F-Score >= 7 on the SIX Swiss Exchange produced the highest Sharpe ratio of any market tested (0.432), 8.09% CAGR vs 1.74% for SMI (+6.35% excess), 24.31% down capture, and zero cash periods across 25 years.
quality investing
D/E < 0.5 + Piotroski F-Score >= 7 on TAI and TWO-listed stocks, backtested 2000-2025. 3.18% CAGR vs 4.09% TAIEX, trailing by 0.91% annually. Max drawdown -25.61% vs -41.11%, down capture 63.64%. Better Sharpe ratio (0.156 vs 0.127) through superior downside protection.
quality investing
D/E < 0.5 + Piotroski F-Score >= 7 on SET-listed stocks, backtested 2000-2025. 3.76% CAGR vs 5.13% SET Index, trailing by 1.37% annually. Down capture of 66.82%, max drawdown -35.33% vs -35.59%. Defensive characteristics with reasonable upside participation.