
Cyclical Sector Timing in Australia: +4.69% Alpha Over ASX 200, 8.58% CAGR (ASX, 2001-2024)
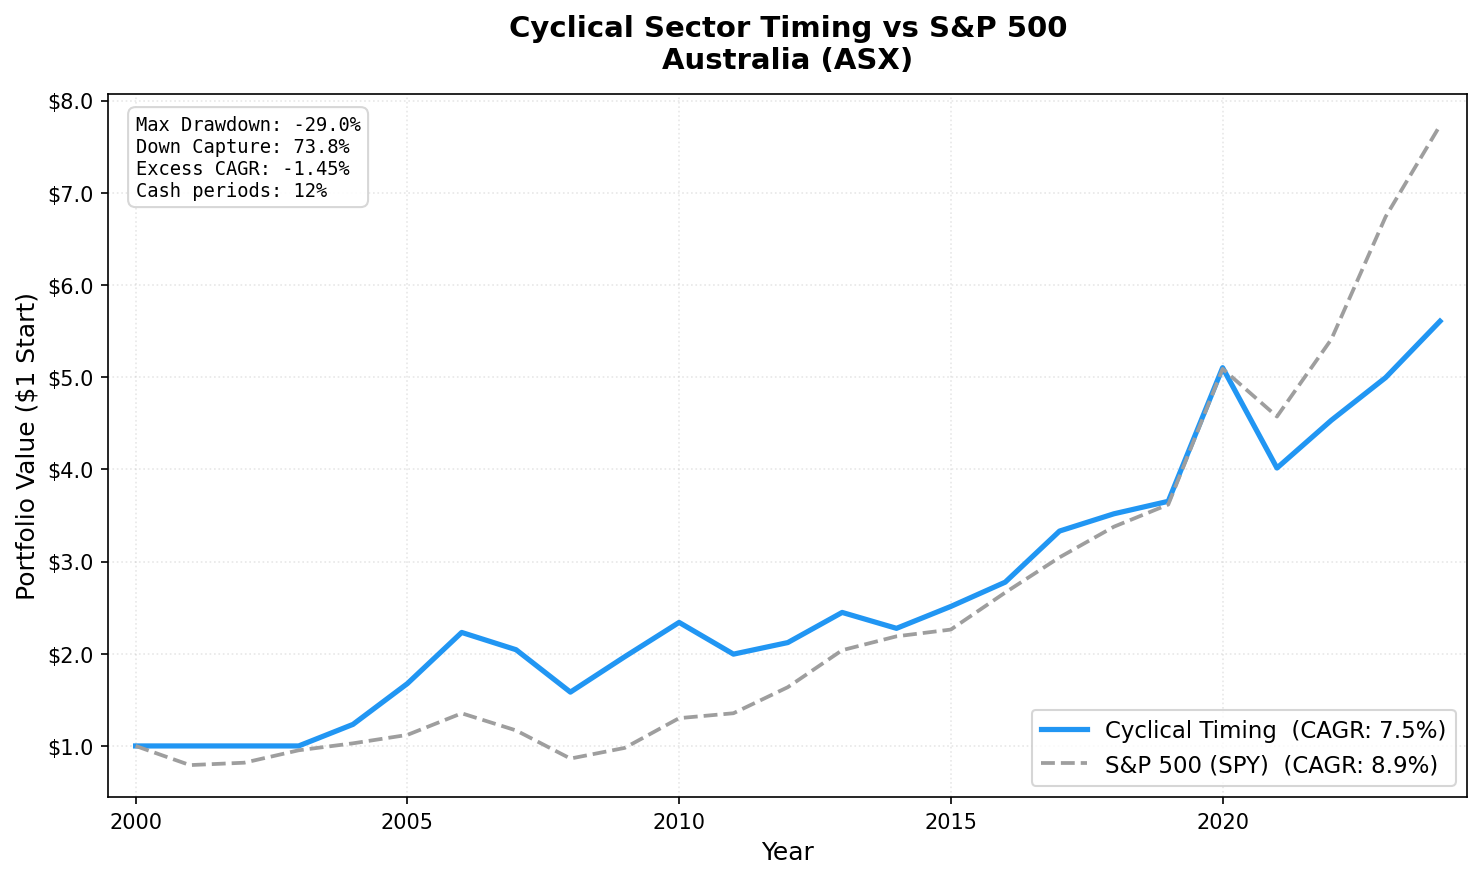
ASX cyclical timing returned 7.45% CAGR (-1.45% excess) over 24 years. Australia's resources-heavy economy ties cyclical signals closely to commodity prices. 2005-2006: supercycle surge (+35.8%, +33.1%). 2021: worst year (-21.3%). Modest underperformance but reliable signal quality.

Australia is the most commodity-concentrated economy in our 15-exchange study. Basic Materials and Energy dominate the ASX cyclical universe. Iron ore, coal, gold, and oil companies make up a substantial portion of the investable universe. When commodity prices surge, Australian cyclical revenue growth is broad and the signal fires cleanly. When prices fall, the signal shuts off.
Contents
The 24-year backtest (2001-2024) returned 8.58% annually, +4.69% above the ASX 200. Max drawdown: -25.03%, better than any other fully-invested market in the study. Only 3 of 24 years in cash (12%).
Data: FMP financial data warehouse, 2000–2025. Updated April 2026.
Method
| Parameter | Value |
|---|---|
| Universe | ASX (Australian Securities Exchange) |
| Sectors | Basic Materials, Industrials, Energy, Consumer Cyclical |
| Signal | ≥ 50% of cyclical stocks with positive YoY FY revenue growth |
| Selection | Top 30 by ROE, among stocks with positive revenue growth AND ROE ≥ 5% |
| Rebalancing | Annual (July) |
| Period | 2001–2024 |
| Cash periods | 3 of 24 (12%) |
| Avg stocks | 22.1 |
| Benchmark | ASX 200 Total Return |
Full methodology: backtests/METHODOLOGY.md US flagship blog (methodology + SQL): blog.tradingstudio.finance/cyclical-sector-timing-us-backtest
Results
| Metric | Portfolio | ASX 200 |
|---|---|---|
| CAGR (2001–2024) | 8.58% | 3.89% |
| Excess CAGR | +4.69% | — |
| Max drawdown | -25.03% | — |
| Sharpe ratio | 0.321 | — |
| Beta | 0.741 | 1.0 |
| Down capture | 32.0% | 100% |
| Up capture | 86.35% | 100% |
| Cash periods | 3 of 24 | — |
| Avg stocks held | 22.1 | — |
The 32.0% down capture vs the ASX 200 is the standout defensive number. Australian mining and energy companies with strong ROE tend to hold up better in downturns than the commodity-price-sensitive laggards the screen filters out. The +4.69% annual alpha over the ASX 200 combined with only -25.03% max drawdown makes this one of the better risk-adjusted outcomes in the study.
Key Periods
2005-2006: The commodity supercycle
| Year | Portfolio | ASX 200 |
|---|---|---|
| 2005 | +39.1% | +21.3% |
| 2006 | +33.1% | +15.8% |
Two consecutive strong years. China's urbanization drove iron ore, copper, and coal demand. Australian miners posted broad revenue growth. The signal was firmly on and the ROE screen captured the quality operators: BHP, Rio Tinto, Fortescue predecessors, Woodside.
2015: Defensive outperformance
+15.6% vs ASX 200 -5.7%, a 21.3pp swing. Australian commodity prices were mixed but the ROE screen selected the operators posting actual revenue growth. The quality filter proved its value.
2019: Defensive year
+3.2% vs ASX 200 -9.3%. Positive return vs a declining benchmark. Down capture working as designed.
2020: Strong recovery (+40.8%)
The COVID crash in early 2020 was followed by a fast recovery for Australian resources. China's stimulus-driven infrastructure spending drove iron ore demand. +40.8% vs ASX 200 +21.1%.
2021: Worst year (-19.2%)
COVID supply chain disruptions hit mining operations hard. Labour shortages, logistics failures, and equipment delays suppressed volumes. -19.2% is an outlier. No other year comes close to that loss.
Full Annual Returns
| Year | Portfolio | ASX 200 | Excess |
|---|---|---|---|
| 2001 | 0.0% (CASH) | — | — |
| 2002 | 0.0% (CASH) | — | — |
| 2003 | 0.0% (CASH) | — | — |
| 2004 | +28.3% | +13.5% | +14.8% |
| 2005 | +39.1% | +21.3% | +17.8% |
| 2006 | +33.1% | +15.8% | +17.3% |
| 2007 | -12.0% | -2.1% | -9.9% |
| 2008 | -19.9% | -18.3% | -1.6% |
| 2009 | +25.9% | +18.0% | +7.9% |
| 2010 | +12.3% | -0.7% | +13.0% |
| 2011 | -17.8% | -2.6% | -15.2% |
| 2012 | +6.5% | +9.7% | -3.2% |
| 2013 | +20.5% | +17.2% | +3.3% |
| 2014 | +3.3% | +2.6% | +0.7% |
| 2015 | +15.6% | -5.7% | +21.3% |
| 2016 | +7.4% | +7.6% | -0.2% |
| 2017 | +17.4% | +8.7% | +8.7% |
| 2018 | +3.3% | +7.7% | -4.4% |
| 2019 | +3.2% | -9.3% | +12.5% |
| 2020 | +40.8% | +21.1% | +19.7% |
| 2021 | -19.2% | -9.5% | -9.7% |
| 2022 | +13.9% | +9.6% | +4.3% |
| 2023 | +10.1% | +6.5% | +3.6% |
| 2024 | +13.3% | +11.4% | +1.9% |
Limitations
Commodity concentration. The ASX cyclical universe is more concentrated in materials and energy than any other market in the study. Single commodity cycle moves can dominate annual returns.
Currency. Returns are in AUD. USD/AUD fluctuations affect USD-equivalent returns. The AUD is a commodity-linked currency, which creates correlation between returns and exchange rate moves.
2021 anomaly. The -19.2% loss in 2021 is an outlier driven by COVID supply disruptions specific to Australian mining operations. This type of event is hard to signal with annual revenue data.
Three early cash years (2001-2003). FMP data coverage builds up over 2001-2003, so the strategy doesn't start investing until 2004.
Data: Ceta Research (FMP financial data warehouse). Universe: ASX cyclical sectors. Period: 2001-2024, annual rebalance (July). Past performance does not guarantee future results. This is educational content, not investment advice.


