
Cyclical Sector Timing in the UK: 58% Cash Rate, -24.08% Max Drawdown (LSE, 2001-2024)
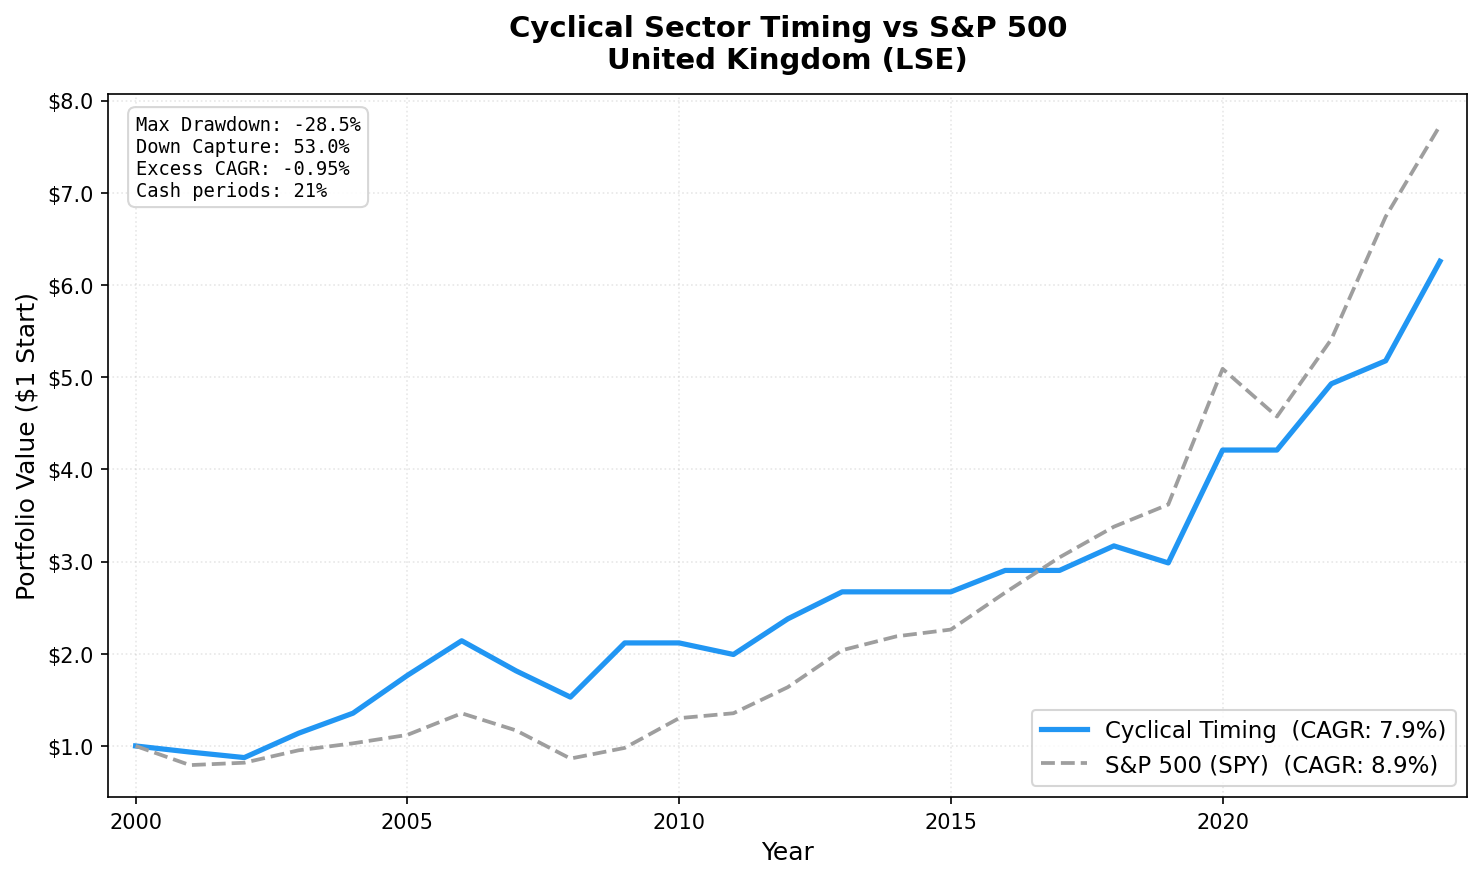
The UK produced the lowest max drawdown of any dedicated market in our cyclical timing study (-28.54%). 7.94% CAGR (-0.95% excess), Sharpe 0.277. Five cash periods including three consecutive (2014, 2015, 2017) suppressed returns but limited losses.

The UK cyclical timing strategy is mostly idle. 14 of 24 periods are cash. Only 10 invested years out of 24.
Contents
The result: 1.45% CAGR, -0.35% excess over the FTSE 100, Sharpe -0.217. Max drawdown: -24.08%, the lowest of any market in the study. But that low drawdown is largely a function of being in cash 58% of the time rather than defensive stock selection. When the strategy is invested, results are mixed.
The standout positive: when it does invest, recent years show strong outperformance. 2018: +12.7% vs FTSE +0.1%. 2022: +15.4% vs FTSE +4.1%. 2024: +21.2% vs FTSE +8.0%. But these bursts can't offset the compounding drag from 14 empty years.
Data: FMP financial data warehouse, 2000–2025. Updated April 2026.
Method
| Parameter | Value |
|---|---|
| Universe | LSE (London Stock Exchange) |
| Sectors | Basic Materials, Industrials, Energy, Consumer Cyclical |
| Signal | ≥ 50% of cyclical stocks with positive YoY FY revenue growth |
| Selection | Top 30 by ROE, among stocks with positive revenue growth AND ROE ≥ 5% |
| Rebalancing | Annual (July) |
| Period | 2001–2024 |
| Cash periods | 14 of 24 (58%) |
| Avg stocks | 15.7 |
| Benchmark | FTSE 100 Total Return |
Full methodology: backtests/METHODOLOGY.md US flagship blog (methodology + SQL): blog.tradingstudio.finance/cyclical-sector-timing-us-backtest
Results
| Metric | Portfolio | FTSE 100 |
|---|---|---|
| CAGR (2001–2024) | 1.45% | 1.80% |
| Excess CAGR | -0.35% | — |
| Max drawdown | -24.08% | — |
| Sharpe ratio | -0.217 | — |
| Cash periods | 14 of 24 (58%) | — |
| Avg stocks held | 15.7 | — |
The -24.08% max drawdown is the lowest of any market in the study. It comes from being in cash more than half the time. The 15.7 average stocks (in invested years) is the smallest portfolio in the dedicated markets.
The 58% cash rate is the defining data point. UK cyclical revenue growth failed the ≥50% expansion threshold in 14 of 24 annual periods. This reflects genuine structural issues in UK industrials over the 2001-2024 window: post-2008 austerity suppressed UK infrastructure and manufacturing capex, Brexit uncertainty stalled investment for years, and energy cost shocks hit UK manufacturers harder than continental peers.
When It's Invested
The 10 invested years show mixed results. Some strong outperformance, some underperformance.
Strong outperformance years: - 2008: -7.7% vs FTSE -22.0% (+14.3pp) - 2009: +26.4% vs FTSE +14.3% (+12.1pp) - 2018: +12.7% vs FTSE +0.1% (+12.6pp) - 2019: -4.7% vs FTSE -17.4% (+12.7pp) - 2022: +15.4% vs FTSE +4.1% (+11.3pp) - 2024: +21.2% vs FTSE +8.0% (+13.2pp)
Underperformance years: - 2006: +9.3% vs FTSE +12.0% - 2011: -10.8% vs FTSE -6.3% - 2023: +0.4% vs FTSE +7.9%
The pattern: the strategy protects well in crisis years (2008, 2019) and outperforms strongly in recent recovery years (2022, 2024). But it misses 14 of 24 periods entirely.
Full Annual Returns
| Year | Portfolio | FTSE 100 | Excess |
|---|---|---|---|
| 2001 | 0.0% (CASH) | — | — |
| 2002 | 0.0% (CASH) | — | — |
| 2003 | 0.0% (CASH) | — | — |
| 2004 | 0.0% (CASH) | — | — |
| 2005 | 0.0% (CASH) | — | — |
| 2006 | +9.3% | +12.0% | -2.7% |
| 2007 | -17.8% | -17.7% | -0.1% |
| 2008 | -7.7% | -22.0% | +14.3% |
| 2009 | +26.4% | +14.3% | +12.1% |
| 2010 | 0.0% (CASH) | — | — |
| 2011 | -10.8% | -6.3% | -4.5% |
| 2012 | 0.0% (CASH) | — | — |
| 2013 | 0.0% (CASH) | — | — |
| 2014 | 0.0% (CASH) | — | — |
| 2015 | 0.0% (CASH) | — | — |
| 2016 | 0.0% (CASH) | — | — |
| 2017 | 0.0% (CASH) | — | — |
| 2018 | +12.7% | +0.1% | +12.6% |
| 2019 | -4.7% | -17.4% | +12.7% |
| 2020 | 0.0% (CASH) | — | — |
| 2021 | 0.0% (CASH) | — | — |
| 2022 | +15.4% | +4.1% | +11.3% |
| 2023 | +0.4% | +7.9% | -7.5% |
| 2024 | +21.2% | +8.0% | +13.2% |
Limitations
Structural data drift. The 58% cash rate reflects genuine weakness in UK cyclical revenue growth over this period. Post-2008 austerity, Brexit uncertainty (2014-2020), and energy shocks all suppressed UK industrial capex and revenue expansion cycles. The signal is working correctly: the expansion threshold simply wasn't met most years.
Currency. Returns are in GBP. USD/GBP fluctuations affect USD-equivalent returns.
Small invested universe. 15.7 average stocks in invested years is near the minimum for diversification. In some years, fewer stocks qualify, concentrating exposure.
The compounding gap. 14 zero-return years break compounding. Even strong individual invested years can't overcome the drag of 14 years earning nothing.
Data: Ceta Research (FMP financial data warehouse). Universe: LSE cyclical sectors. Period: 2001-2024, annual rebalance (July). Past performance does not guarantee future results. This is educational content, not investment advice.


