
Defensive Rotation Backtest: 9.80% CAGR With a Portfolio That Gains

The Defensive Rotation Playbook: 9.80% CAGR and a Portfolio That Gains When Markets Fall
When SPY dropped 26% in 2008, this portfolio lost 11%. When SPY dropped 21% in 2001, this portfolio lost 3%. When SPY dropped 15% in 2007, this portfolio lost 10%. And in 2000, when the dot-com crash hit and SPY fell 15%, this portfolio gained 31%.
Contents
- Method
- What Research Shows
- What We Found
- The down capture is negative
- The tradeoff: misses strong growth rallies
- Overall performance metrics
- The Data
- Annual returns (2000–2024)
- Limitations
- Takeaway
- SQL Screen
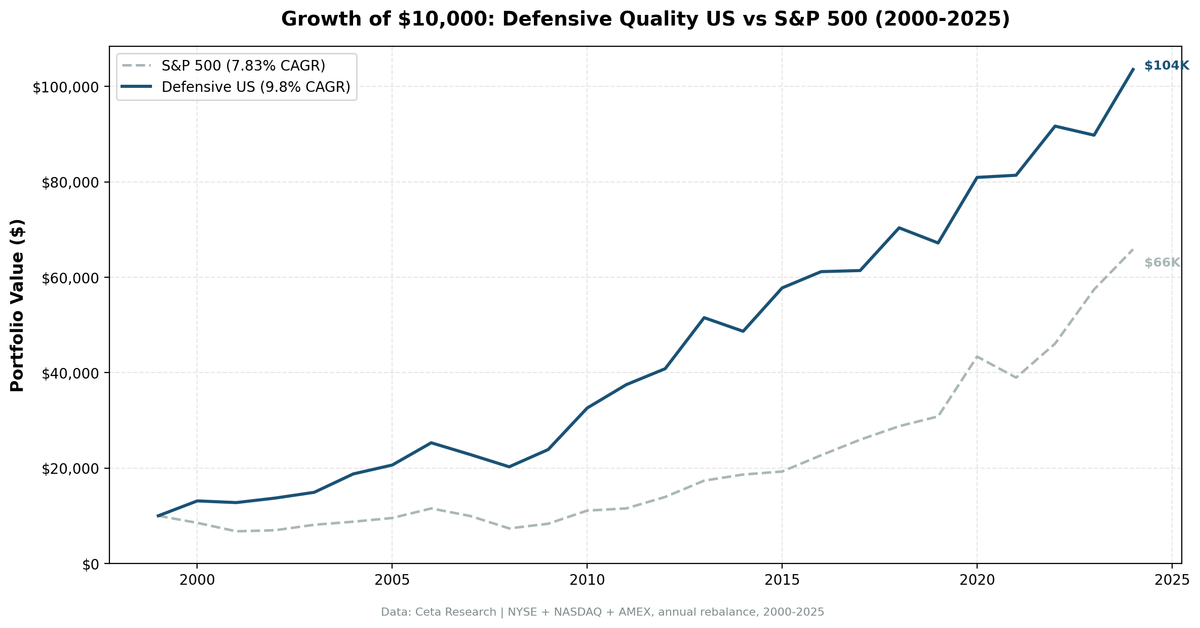
We backtested a quality screen across defensive sectors (Consumer Defensive, Utilities, Healthcare) on all US exchanges from 2000 to 2024. The portfolio returned 9.80% annually vs 7.83% for the S&P 500. But the CAGR doesn't capture the real story. The down capture ratio is -9.5%. That means when the market falls on average, this portfolio gains. Not just protects. Gains.
Method
- Data source: Ceta Research (FMP financial data warehouse)
- Universe: NYSE, NASDAQ, AMEX, market cap above exchange-specific threshold
- Period: 2000–2024 (25 annual rebalance periods)
- Rebalancing: Annual (July), equal weight top 30 by dividend yield
- Benchmark: S&P 500 Total Return (SPY)
- Cash rule: Hold cash if fewer than 10 stocks qualify
Quality filters:
| Criterion | Threshold | Rationale |
|---|---|---|
| Sectors | Consumer Defensive, Utilities, Healthcare | Classic defensive classification |
| Return on Equity | > 6% | Quality floor (utilities capital-intensive, so lower bar) |
| Operating Margin | > 8% | Excludes unprofitable "defensive" names |
| Debt/Equity | < 2.5 | Utilities carry structural leverage — this threshold allows that |
| Dividend Yield | > 0.5% | Confirms income-generating status |
| Ranking | Dividend yield, descending | Income-first selection within quality universe |
Transaction costs: size-tiered (0.1% for market cap > $10B, 0.3% for $2–10B, 0.5% below $2B), one-way. Historical data with 45-day point-in-time lag to prevent look-ahead bias. Full methodology: backtests/METHODOLOGY.md
What Research Shows
Novy-Marx (2013) documented that defensive sector stocks carry two simultaneous premiums: quality (high-ROE companies retain pricing power across cycles) and the low-beta anomaly (low-volatility stocks consistently outperform on a risk-adjusted basis, contrary to what CAPM predicts).
The behavioral explanation: investors systematically underprice boring, dividend-paying businesses. In bull markets, capital flows toward high-growth stories. Defensive stocks get left behind. When cycles turn, the boring compounders hold value while the exciting names collapse. This creates the asymmetry.
The rational view (Baker, Bradley and Wurgler, 2011) attributes the low-beta premium to institutional constraints. Pension funds and endowments can't use leverage, so they reach for beta to hit return targets. This drives up prices on high-beta stocks and creates underpricing in low-beta defensive names.
Both stories predict the same thing. When markets fall hard, defensive quality stocks don't just hold, they often appreciate, as capital rotates into perceived safety.
What We Found
The down capture is negative
A down capture ratio of -9.5% means that in years when the S&P 500 falls, this portfolio has typically gained. The normal defensive strategy you might imagine has a down capture around 60-70% (it falls, but less). At -9.5%, this portfolio does the opposite.
This shows up most clearly in the worst market years:
| Year | Portfolio | S&P 500 | Excess |
|---|---|---|---|
| 2000 | +31.2% | -14.8% | +46.0% |
| 2001 | -2.7% | -20.8% | +18.1% |
| 2007 | -9.7% | -13.7% | +4.0% |
| 2008 | -11.3% | -26.1% | +14.9% |
| 2021 | +0.6% | -10.2% | +10.7% |
The 2000 result stands out. That year, the portfolio held Procter & Gamble, Johnson & Johnson, Duke Energy, and similar names. While tech imploded, staples and utilities were boring and untouched.
In 2008, the portfolio's worst year in the global financial crisis was -11.3%, less than half of SPY's -26.1%. The portfolio had shifted further into utilities and healthcare as markets got more expensive, meaning the defensive character was genuine.
The tradeoff: misses strong growth rallies
This is a real limitation. In growth-driven years, the portfolio underperforms:
| Year | Portfolio | S&P 500 | Excess |
|---|---|---|---|
| 2003 | +8.8% | +16.4% | -7.6% |
| 2012 | +8.9% | +20.9% | -12.0% |
| 2016 | +5.9% | +17.7% | -11.8% |
| 2020 | +20.4% | +40.7% | -20.3% |
| 2023 | -2.1% | +24.6% | -26.7% |
The 2023 gap (-26.7%) is the worst year vs SPY in the set. That year was dominated by tech and AI enthusiasm, exactly the kind of environment where consumer staples and utilities lag badly.
Up capture ratio is 81.6%. The portfolio captures most of the upside but consistently gives back 15-20 percentage points in strong growth years.
Overall performance metrics
| Metric | Portfolio | S&P 500 |
|---|---|---|
| CAGR (2000–2024) | 9.80% | 7.83% |
| Total return | 936% | 559% |
| Max drawdown | -19.9% | -36.3% |
| Annualized volatility | 12.8% | 16.2% |
| Sharpe ratio | 0.608 | 0.360 |
| Sortino ratio | 1.827 | 0.654 |
| Beta | 0.379 | 1.0 |
| Alpha (Jensen) | 5.59% | — |
| Down capture | -9.5% | 100% |
| Win rate vs SPY | 64% | — |
$10,000 invested in 2000 grew to $103,585 in the portfolio vs $65,869 in SPY.
The portfolio held 22.8 stocks on average. Zero cash periods, the US defensive sector universe always had 10+ qualifying companies.
The Data
Annual returns (2000–2024)
| Year | Portfolio | S&P 500 | Excess |
|---|---|---|---|
| 2000 | +31.2% | -14.8% | +46.0% |
| 2001 | -2.7% | -20.8% | +18.1% |
| 2002 | +7.4% | +3.3% | +4.1% |
| 2003 | +8.8% | +16.4% | -7.6% |
| 2004 | +25.8% | +7.9% | +17.9% |
| 2005 | +9.9% | +8.9% | +1.1% |
| 2006 | +22.6% | +20.9% | +1.7% |
| 2007 | -9.7% | -13.7% | +4.0% |
| 2008 | -11.3% | -26.1% | +14.9% |
| 2009 | +17.8% | +13.4% | +4.4% |
| 2010 | +36.4% | +32.9% | +3.5% |
| 2011 | +15.0% | +4.1% | +10.9% |
| 2012 | +8.9% | +20.9% | -12.0% |
| 2013 | +26.2% | +24.5% | +1.7% |
| 2014 | -5.5% | +7.4% | -12.9% |
| 2015 | +18.7% | +3.4% | +15.3% |
| 2016 | +5.9% | +17.7% | -11.8% |
| 2017 | +0.4% | +14.3% | -14.0% |
| 2018 | +14.6% | +10.9% | +3.7% |
| 2019 | -4.5% | +7.1% | -11.6% |
| 2020 | +20.4% | +40.7% | -20.3% |
| 2021 | +0.6% | -10.2% | +10.7% |
| 2022 | +12.7% | +18.3% | -5.7% |
| 2023 | -2.1% | +24.6% | -26.7% |
| 2024 | +15.3% | +14.7% | +0.7% |
Limitations
This isn't a market-timing strategy. The portfolio holds through full cycles. If you want the protection without the growth lag, the portfolio structure has to be acceptable in both environments.
The defensive character comes from sector constraint, not individual stock timing. The screen picks the highest-yielding quality names across Consumer Defensive, Utilities, and Healthcare. It doesn't predict which names will hold or which will fall in any given year. The protection is structural: these sectors collectively exhibit low beta.
Survivorship bias is partially present. The sector classification comes from the current profile snapshot. Companies that exited the market (bankruptcies, delistings) may have been classified differently. This is a partial bias, the screen includes quality filters (ROE > 6%, OPM > 8%) that would have excluded most distressed names before they became problems.
The 2023 underperformance is real and not anomalous. When AI-driven growth dominates market returns, defensive quality will lag badly. The strategy's edge comes from drawdown protection, not growth capture. A year like 2023 should be expected roughly once per decade.
Transaction costs are modeled, not exact. The size-tiered model (0.1%/0.3%/0.5%) approximates realistic costs. Actual costs depend on execution quality, market conditions, and position sizes.
Takeaway
The -9.5% down capture is unusual. Most defensive strategies protect; this one gains. That's the core of the argument for a persistent allocation to quality defensive stocks: the asymmetry is real, it shows up across multiple recession cycles, and the academic literature supports a behavioral explanation that doesn't require it to disappear.
The strategy gives up ground in strong growth years. That's a feature, not a bug, but it means this works best as a core allocation in a diversified portfolio, not as a standalone bet.
The simple SQL screen runs in 60 seconds on the Ceta Research data explorer. The full 25-year backtest lives on GitHub.
Run the current screen: cetaresearch.com/data-explorer Full backtest code: github.com/ceta-research/backtests
SQL Screen
SELECT
 k.symbol,
 p.companyName,
 p.exchange,
 p.sector,
 ROUND(k.returnOnEquityTTM * 100, 2) AS roe_pct,
 ROUND(f.operatingProfitMarginTTM * 100, 2) AS opm_pct,
 ROUND(f.debtToEquityRatioTTM, 2) AS de_ratio,
 ROUND(f.dividendYieldTTM * 100, 2) AS div_yield_pct,
 ROUND(k.marketCap / 1e9, 2) AS mktcap_b
FROM key_metrics_ttm k
JOIN financial_ratios_ttm f ON k.symbol = f.symbol
JOIN profile p ON k.symbol = p.symbol
WHERE p.sector IN ('Consumer Defensive', 'Utilities', 'Healthcare')
 AND k.returnOnEquityTTM > 0.06
 AND f.operatingProfitMarginTTM > 0.08
 AND (f.debtToEquityRatioTTM IS NULL OR f.debtToEquityRatioTTM < 2.5)
 AND f.dividendYieldTTM > 0.005
 AND k.marketCap > 1000000000
 AND p.isActivelyTrading = true
 AND p.exchange IN ('NYSE', 'NASDAQ', 'AMEX')
ORDER BY f.dividendYieldTTM DESC
LIMIT 30
Part of a Series: Global | UK | India
Data: Ceta Research (FMP financial data warehouse). Past performance doesn't guarantee future results.


