
Dividend Sustainability on Swedish Stocks: 10.21% CAGR Over 25 Years
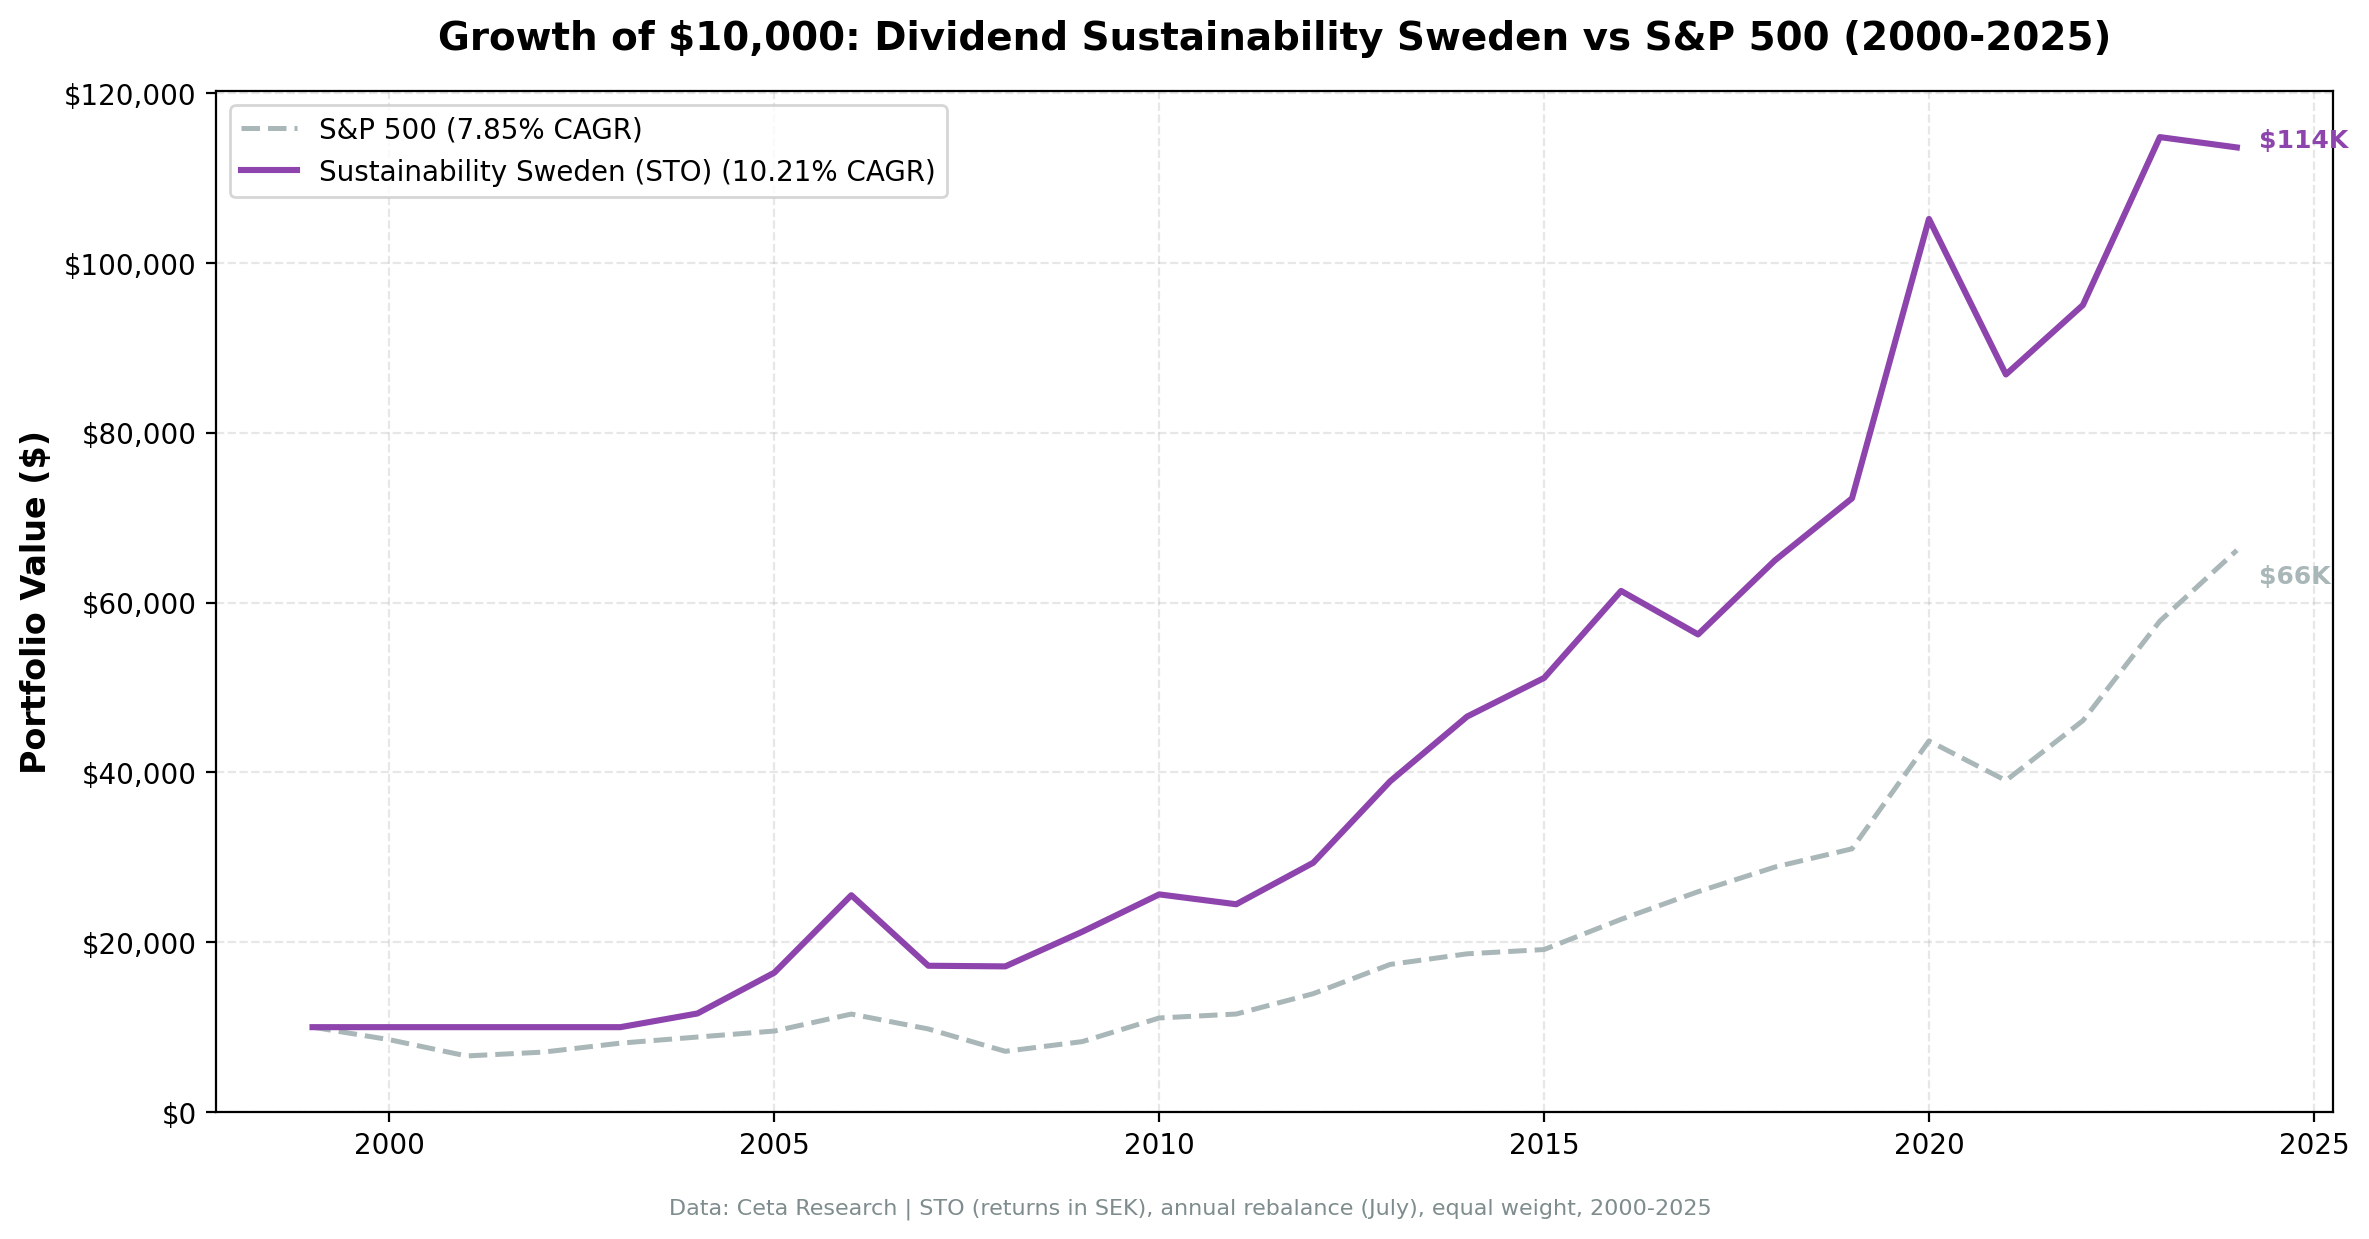
The dividend sustainability screen on Stockholm stocks returned 10.21% CAGR over 25 years with 7.65% annual excess over the OMX Stockholm 30. Explosive upside (+55.6% in 2006, +45.5% in 2020) with 72% win rate vs local benchmark.

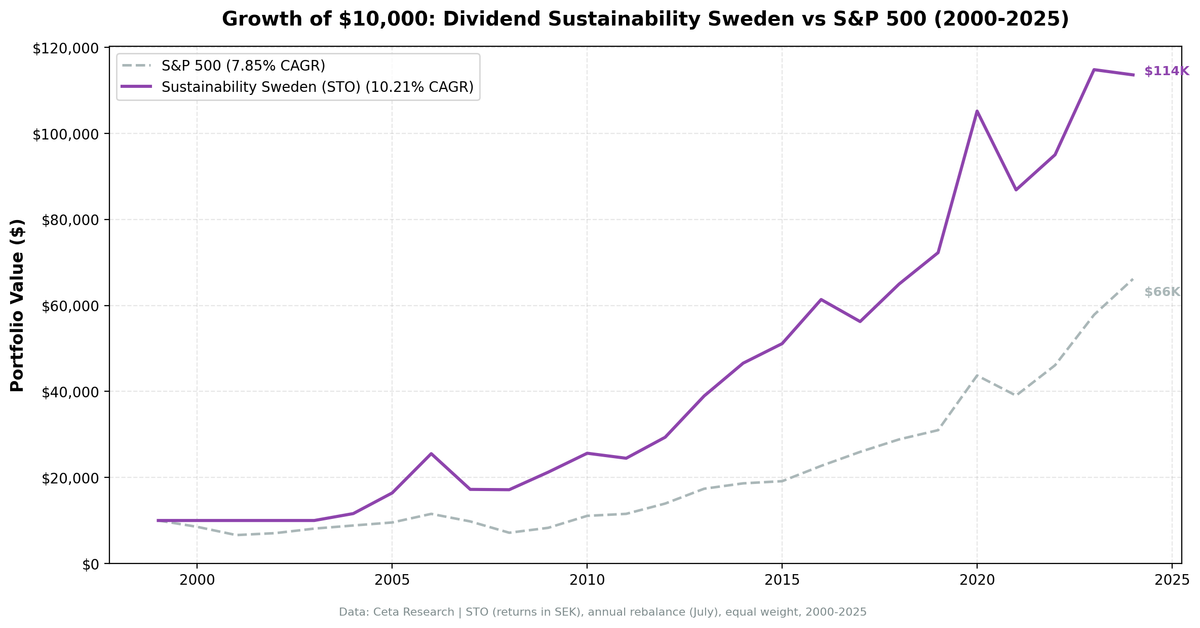
Sweden's sustainability screen returned 10.21% CAGR over 25 years, beating the OMX Stockholm 30 by 7.65% annually. The strategy turned $10,000 into roughly $114,000. What stands out is the explosive upside when the screen finds qualifying stocks: 2006 returned +55.6%, 2013 hit +32.7%, and 2020 delivered +45.5%. The flip side is higher volatility (19.65%) and a wider max drawdown (-32.83%) than some other European exchanges. This is a boom-and-bust market where the sustainability filter captures the booms and limits (but doesn't eliminate) the busts.
Contents
- Method
- The Screen (SQL)
- What We Found
- 25 years of data. 7.65% annual excess over OMX Stockholm 30.
- Year-by-year returns
- 2005-2006: the Swedish explosion
- 2007: the sharp correction
- 2008: the resilient hold
- Limitations
- Takeaway
- Part of a Series
- References
- Run This Screen Yourself
Data: FMP financial data warehouse, 2000-2025. Updated May 2026.
Method
We applied the same 5-component sustainability score used in our US dividend sustainability study. Five dimensions scored 0-2 each (payout ratio, debt/equity, FCF coverage, ROE, Piotroski F-Score), total 0-10. Minimum score 7, yield above 2%, top 30 by score, equal weight, annual July rebalance. See the US blog for full methodology and score breakdown.
Universe: STO (Stockholm), market cap > 5B SEK (~$460M USD) Period: 2000-2025 (25 years) Benchmark: OMX Stockholm 30 (OMXS30, SEK) Execution: Next-day close (market-on-close after signal)
The Screen (SQL)
WITH latest_ratios AS (
    SELECT r.symbol, r.dividendPayoutRatio, r.debtToEquityRatio,
           r.dividendYield, r.date,
        ROW_NUMBER() OVER (PARTITION BY r.symbol ORDER BY r.date DESC) AS rn
    FROM financial_ratios r
    JOIN profile p ON r.symbol = p.symbol
    WHERE r.period = 'FY'
      AND r.dividendPayoutRatio > 0
      AND r.dividendYield IS NOT NULL
      AND p.exchange IN ('STO')
),
latest_cf AS (
    SELECT c.symbol, c.freeCashFlow, c.commonDividendsPaid, c.date,
        ROW_NUMBER() OVER (PARTITION BY c.symbol ORDER BY c.date DESC) AS rn
    FROM cash_flow_statement c
    JOIN profile p ON c.symbol = p.symbol
    WHERE c.period = 'FY'
      AND c.commonDividendsPaid < 0
      AND p.exchange IN ('STO')
),
latest_metrics AS (
    SELECT k.symbol, k.returnOnEquity, k.marketCap, k.date,
        ROW_NUMBER() OVER (PARTITION BY k.symbol ORDER BY k.date DESC) AS rn
    FROM key_metrics k
    JOIN profile p ON k.symbol = p.symbol
    WHERE k.period = 'FY'
      AND k.marketCap IS NOT NULL
      AND p.exchange IN ('STO')
),
latest_scores AS (
    SELECT symbol, piotroskiScore FROM scores
),
scored AS (
    SELECT r.symbol, r.date,
        ROUND(r.dividendPayoutRatio * 100, 1) AS payout_pct,
        ROUND(r.debtToEquityRatio, 2) AS debt_equity,
        ROUND(c.freeCashFlow / NULLIF(ABS(c.commonDividendsPaid), 0), 2) AS fcf_coverage,
        ROUND(k.returnOnEquity * 100, 1) AS roe_pct,
        s.piotroskiScore AS piotroski,
        ROUND(r.dividendYield * 100, 2) AS yield_pct,
        ROUND(k.marketCap / 1e9, 1) AS mktcap_bn,
        CASE WHEN r.dividendPayoutRatio < 0.5 THEN 2
             WHEN r.dividendPayoutRatio < 0.8 THEN 1 ELSE 0 END AS c_payout,
        CASE WHEN r.debtToEquityRatio >= 0 AND r.debtToEquityRatio < 0.5 THEN 2
             WHEN r.debtToEquityRatio >= 0 AND r.debtToEquityRatio < 1.5 THEN 1
             ELSE 0 END AS c_debt,
        CASE WHEN c.freeCashFlow > 0 AND c.commonDividendsPaid < 0
                  AND c.freeCashFlow / ABS(c.commonDividendsPaid) > 2 THEN 2
             WHEN c.freeCashFlow > 0 AND c.commonDividendsPaid < 0
                  AND c.freeCashFlow / ABS(c.commonDividendsPaid) > 1 THEN 1
             ELSE 0 END AS c_fcf,
        CASE WHEN k.returnOnEquity > 0.15 THEN 2
             WHEN k.returnOnEquity > 0.08 THEN 1 ELSE 0 END AS c_roe,
        CASE WHEN s.piotroskiScore >= 7 THEN 2
             WHEN s.piotroskiScore >= 5 THEN 1 ELSE 0 END AS c_piotroski
    FROM latest_ratios r
    JOIN latest_cf c ON r.symbol = c.symbol AND c.rn = 1
    JOIN latest_metrics k ON r.symbol = k.symbol AND k.rn = 1
    LEFT JOIN latest_scores s ON r.symbol = s.symbol
    WHERE r.rn = 1
      AND r.dividendYield > 0.02
      AND k.marketCap > 5e9
)
SELECT symbol, date, payout_pct, debt_equity, fcf_coverage, roe_pct, piotroski,
       yield_pct, mktcap_bn,
       c_payout + c_debt + c_fcf + c_roe + COALESCE(c_piotroski, 0) AS sustainability_score,
       c_payout, c_debt, c_fcf, c_roe, COALESCE(c_piotroski, 0) AS c_piotroski
FROM scored
WHERE c_payout + c_debt + c_fcf + c_roe + COALESCE(c_piotroski, 0) >= 7
ORDER BY sustainability_score DESC, yield_pct DESC
LIMIT 30
[Run this query on Ceta Research][SUSTAINABILITY_SWEDEN_QUERY_URL]
What We Found
25 years of data. 7.65% annual excess over OMX Stockholm 30.
| Metric | Sustainability (Sweden) | OMX Stockholm 30 |
|---|---|---|
| CAGR | 10.21% | 2.55% |
| Volatility | 19.65% | - |
| Max Drawdown | -32.83% | - |
| Sharpe Ratio | 0.418 | - |
| Sortino Ratio | 0.981 | - |
| Win Rate (annual) | 72% | - |
| Up Capture | 124.5% | - |
| Down Capture | 32.9% | - |
| Beta | 0.725 | - |
| Alpha | 7.81% | - |
| Avg Stocks per Period | 22.7 | - |
| Cash Periods | 4 of 25 | - |
| Avg Sustainability Score | 8.1/10 | - |
The strategy had 4 cash years (2000-2003) when Swedish financial data coverage was insufficient, then produced 21 years of active returns. When benchmarked against the local OMX Stockholm 30 instead of SPY, the picture improves substantially. The OMXS30 returned just 2.55% annualized over the period, making the sustainability screen's 7.81% alpha and 72% win rate genuinely impressive. Up capture of 124.5% shows the portfolio more than kept pace during bull years, while down capture of 32.9% shows meaningful downside protection against the local benchmark.
Beta of 0.725 reflects moderate sensitivity to Swedish market moves.
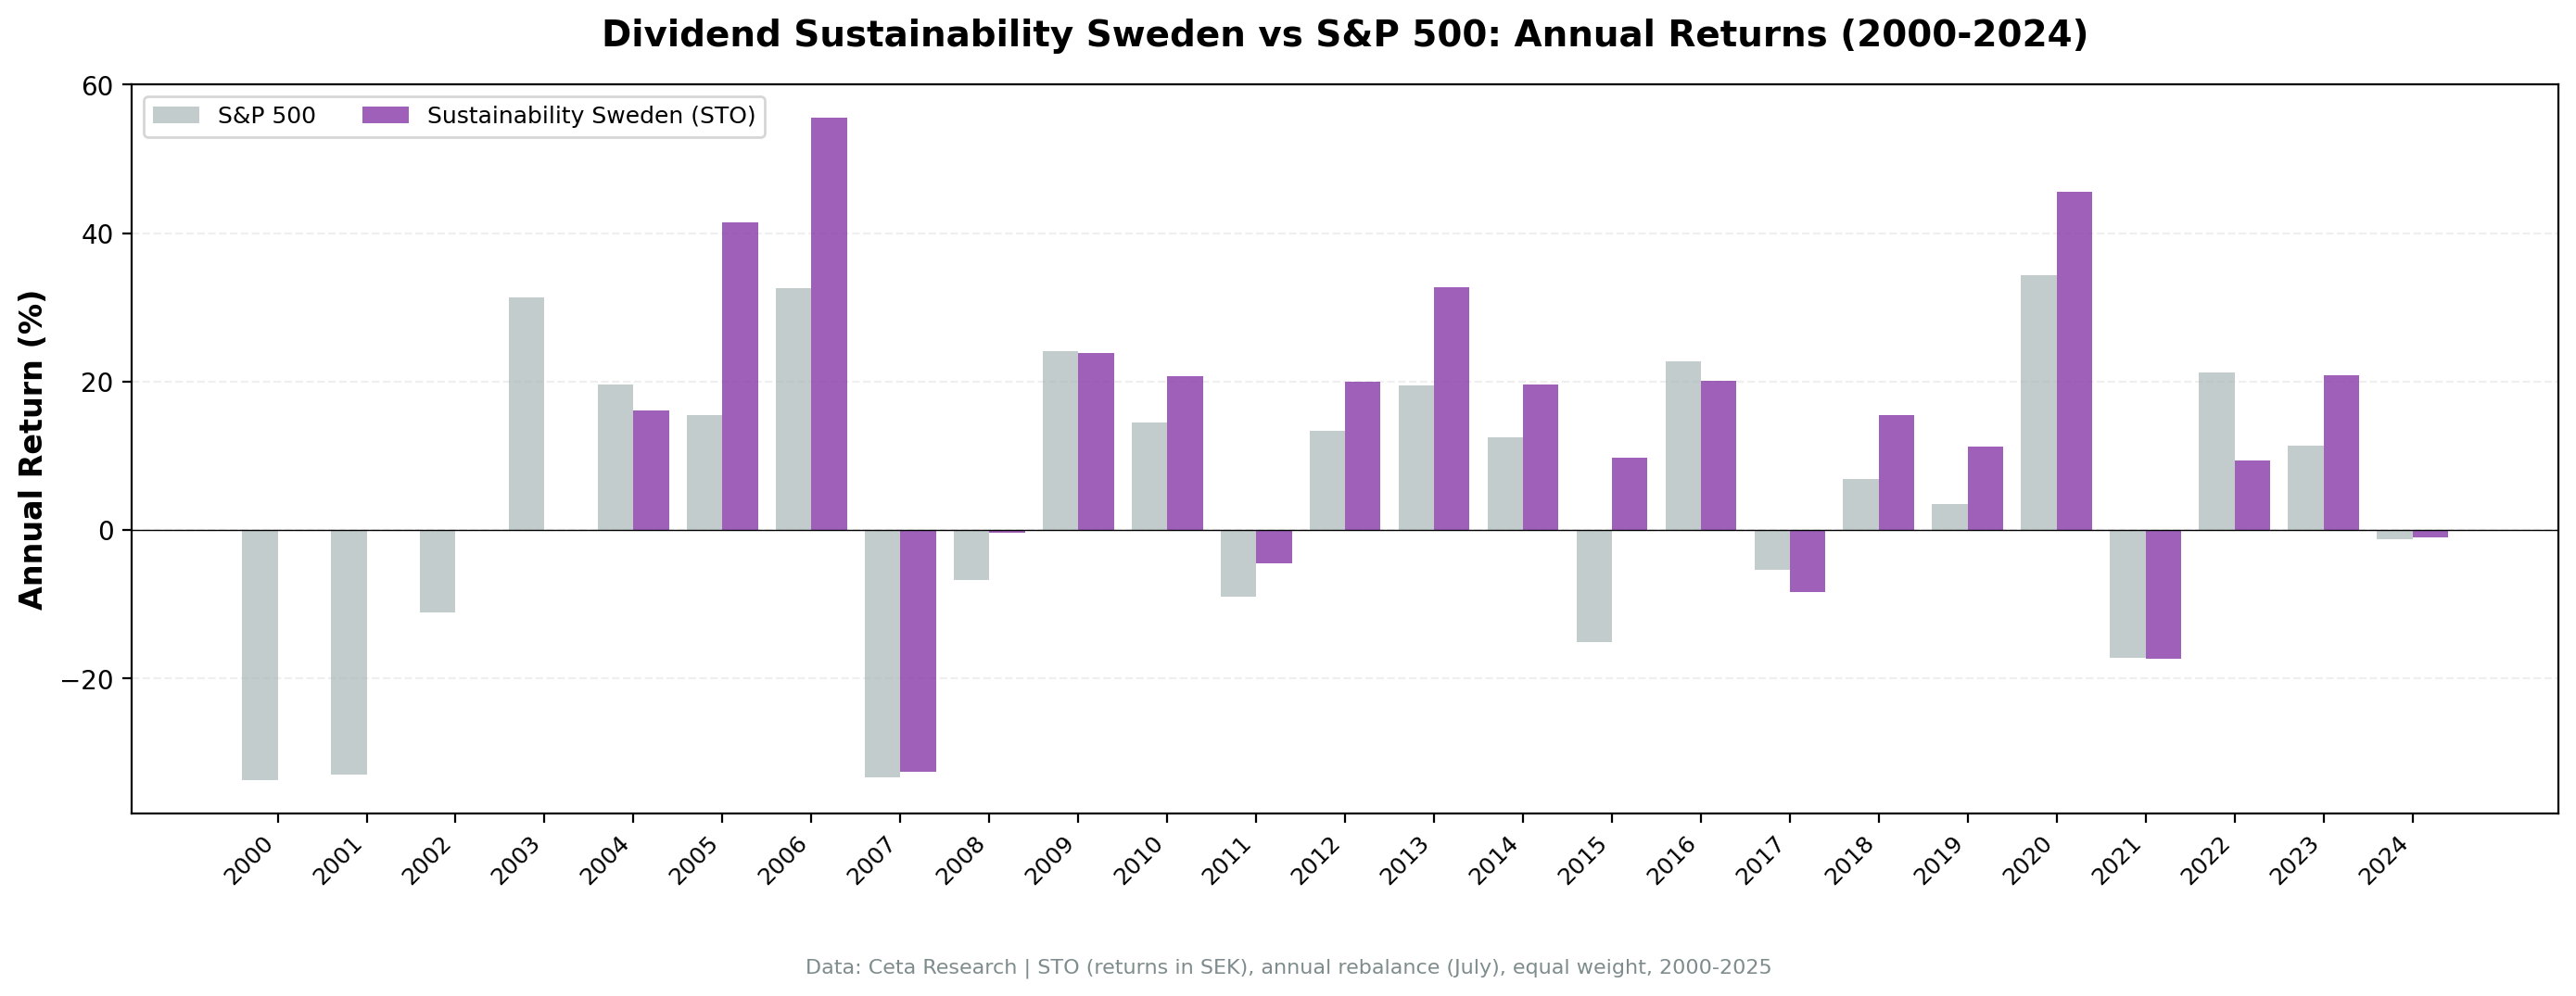
Year-by-year returns
| Year | Sustainability | OMX Stockholm 30 | Excess |
|---|---|---|---|
| 2000 | 0.0% (cash) | - | 0.0% |
| 2001 | 0.0% (cash) | - | 0.0% |
| 2002 | 0.0% (cash) | - | 0.0% |
| 2003 | 0.0% (cash) | - | 0.0% |
| 2004 | +16.1% | +19.6% | -3.5% |
| 2005 | +41.4% | +15.5% | +25.9% |
| 2006 | +55.6% | +32.6% | +23.0% |
| 2007 | -32.5% | -33.4% | +0.8% |
| 2008 | -0.4% | -6.7% | +6.3% |
| 2009 | +23.8% | +24.1% | -0.3% |
| 2010 | +20.7% | +14.5% | +6.2% |
| 2011 | -4.5% | -9.0% | +4.5% |
| 2012 | +20.0% | +13.3% | +6.6% |
| 2013 | +32.7% | +19.5% | +13.2% |
| 2014 | +19.6% | +12.5% | +7.0% |
| 2015 | +9.8% | -15.1% | +24.9% |
| 2016 | +20.1% | +22.8% | -2.7% |
| 2017 | -8.4% | -5.3% | -3.0% |
| 2018 | +15.5% | +6.9% | +8.6% |
| 2019 | +11.2% | +3.5% | +7.8% |
| 2020 | +45.5% | +34.3% | +11.2% |
| 2021 | -17.4% | -17.3% | -0.1% |
| 2022 | +9.4% | +21.2% | -11.8% |
| 2023 | +20.8% | +11.3% | +9.5% |
| 2024 | -1.1% | -1.2% | +0.2% |
2005-2006: the Swedish explosion
+41.4% in 2005, +55.6% in 2006. Two back-to-back years of exceptional returns. Sweden's export-driven industrials (think Atlas Copco, Sandvik, Alfa Laval) were riding global demand for machinery and automation. Companies that scored 7+ on sustainability were exactly the ones with low debt, strong cash flows, and high ROE from booming order books.
2007: the sharp correction
-32.5%, the strategy's worst single year. Swedish industrials got hit hard when global trade slowed. This is the price of sector concentration in a small market. The D/E filter protected against the most leveraged names, but the broad industrial selloff dragged everything down. The OMXS30 fared even worse (-33.4%), so the screen still edged the local benchmark.
2008: the resilient hold
-0.4% while the OMXS30 dropped 6.7%. After the brutal 2007, the July 2008 rebalance picked up quality stocks trading at depressed valuations. These companies survived the crisis and posted a nearly flat return while the broader Swedish market declined.
Limitations
- 4 cash years. Swedish financial data coverage before 2004 was insufficient. The effective backtest is 21 years, not 25.
- Moderate beta (0.725). Swedish sustainability stocks move with the local market. Down capture of 32.9% is wider than Germany or Switzerland.
- Small universe. With an average of 22.7 stocks and a 5B SEK threshold, the strategy occasionally can't find 30 qualifying names, increasing concentration risk.
Takeaway
Sweden's sustainability screen works, but with more volatility than Germany or Switzerland. 10.21% CAGR and 7.81% alpha over the OMX Stockholm 30 across 25 years. The strategy's character is feast-or-famine: +55.6% in 2006, -32.5% in 2007. The sustainability filter captures Sweden's world-class industrials when they're firing on all cylinders and limits damage when they're not. When benchmarked against the local market (which itself delivered only 2.55% CAGR), the screen's value becomes clear: 72% win rate and meaningful downside protection. If your frame of reference is the Stockholm market, this strategy adds real value.
Part of a Series
This analysis is part of our dividend sustainability global exchange comparison: - Dividend Sustainability Score: US Stocks - 10.73% CAGR, full methodology - [Dividend Sustainability on Indian Stocks (NSE)][INDIA_BLOG_URL] - 15.86% CAGR, the standout - [Dividend Sustainability on German Stocks (XETRA)][GERMANY_BLOG_URL] - 12.27% CAGR, best Sharpe (0.652) - [Dividend Sustainability on Swiss Stocks (SIX)][SWITZERLAND_BLOG_URL] - 8.72% CAGR - [Dividend Sustainability: 13-Exchange Global Comparison][COMPARISON_BLOG_URL] - full comparison table
References
- DeAngelo, H., DeAngelo, L. & Skinner, D. (1992). "Dividends and Losses." Journal of Finance, 47(5), 1837-1863.
- Piotroski, J. (2000). "Value Investing: The Use of Historical Financial Statement Information to Separate Winners from Losers." Journal of Accounting Research, 38, 1-41.
- Benartzi, S., Michaely, R. & Thaler, R. (1997). "Do Changes in Dividends Signal the Future or the Past?" Journal of Finance, 52(3), 1007-1034.
Run This Screen Yourself
Via web UI: [Run the sustainability screen on Ceta Research][SUSTAINABILITY_SWEDEN_QUERY_URL]. The query is pre-loaded. Hit "Run" and see what passes today.
Get your API key at cetaresearch.com. The full backtest code (Python + DuckDB) is on GitHub.
Data: Ceta Research, FMP financial data warehouse. Universe: STO, market cap > 5B SEK. Annual rebalance (July), equal weight top 30 by sustainability score, 2000-2025.
Past performance does not guarantee future results. This is educational content, not investment advice.


