
EV/EBITDA Sector-Relative Value on Germany: 8.60% CAGR Across All 25

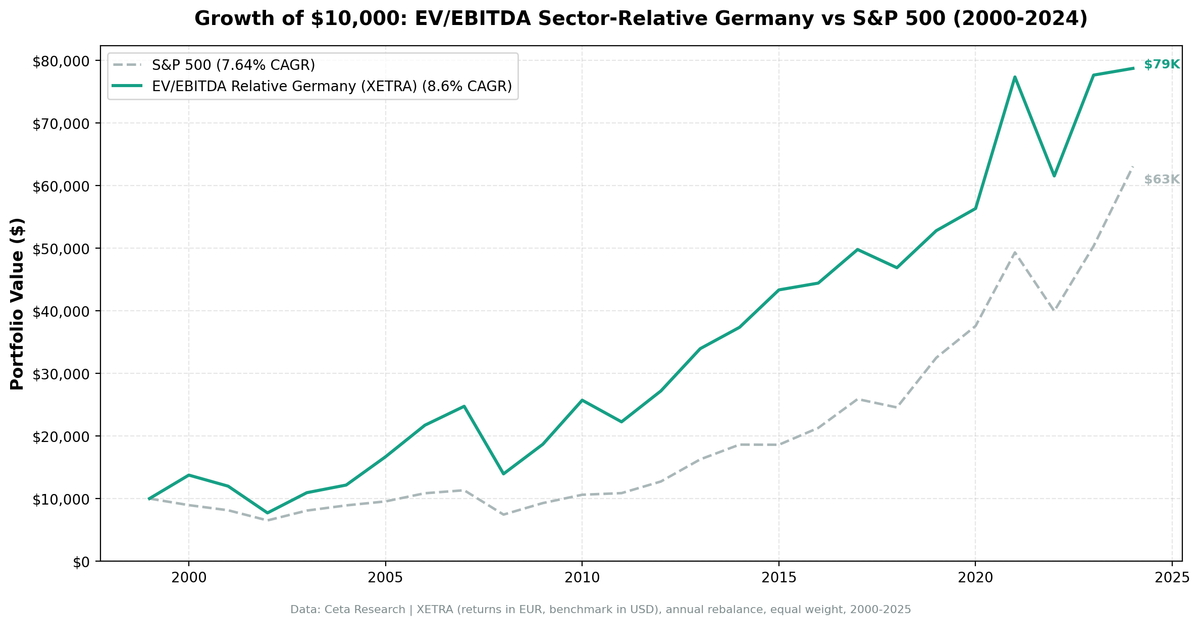
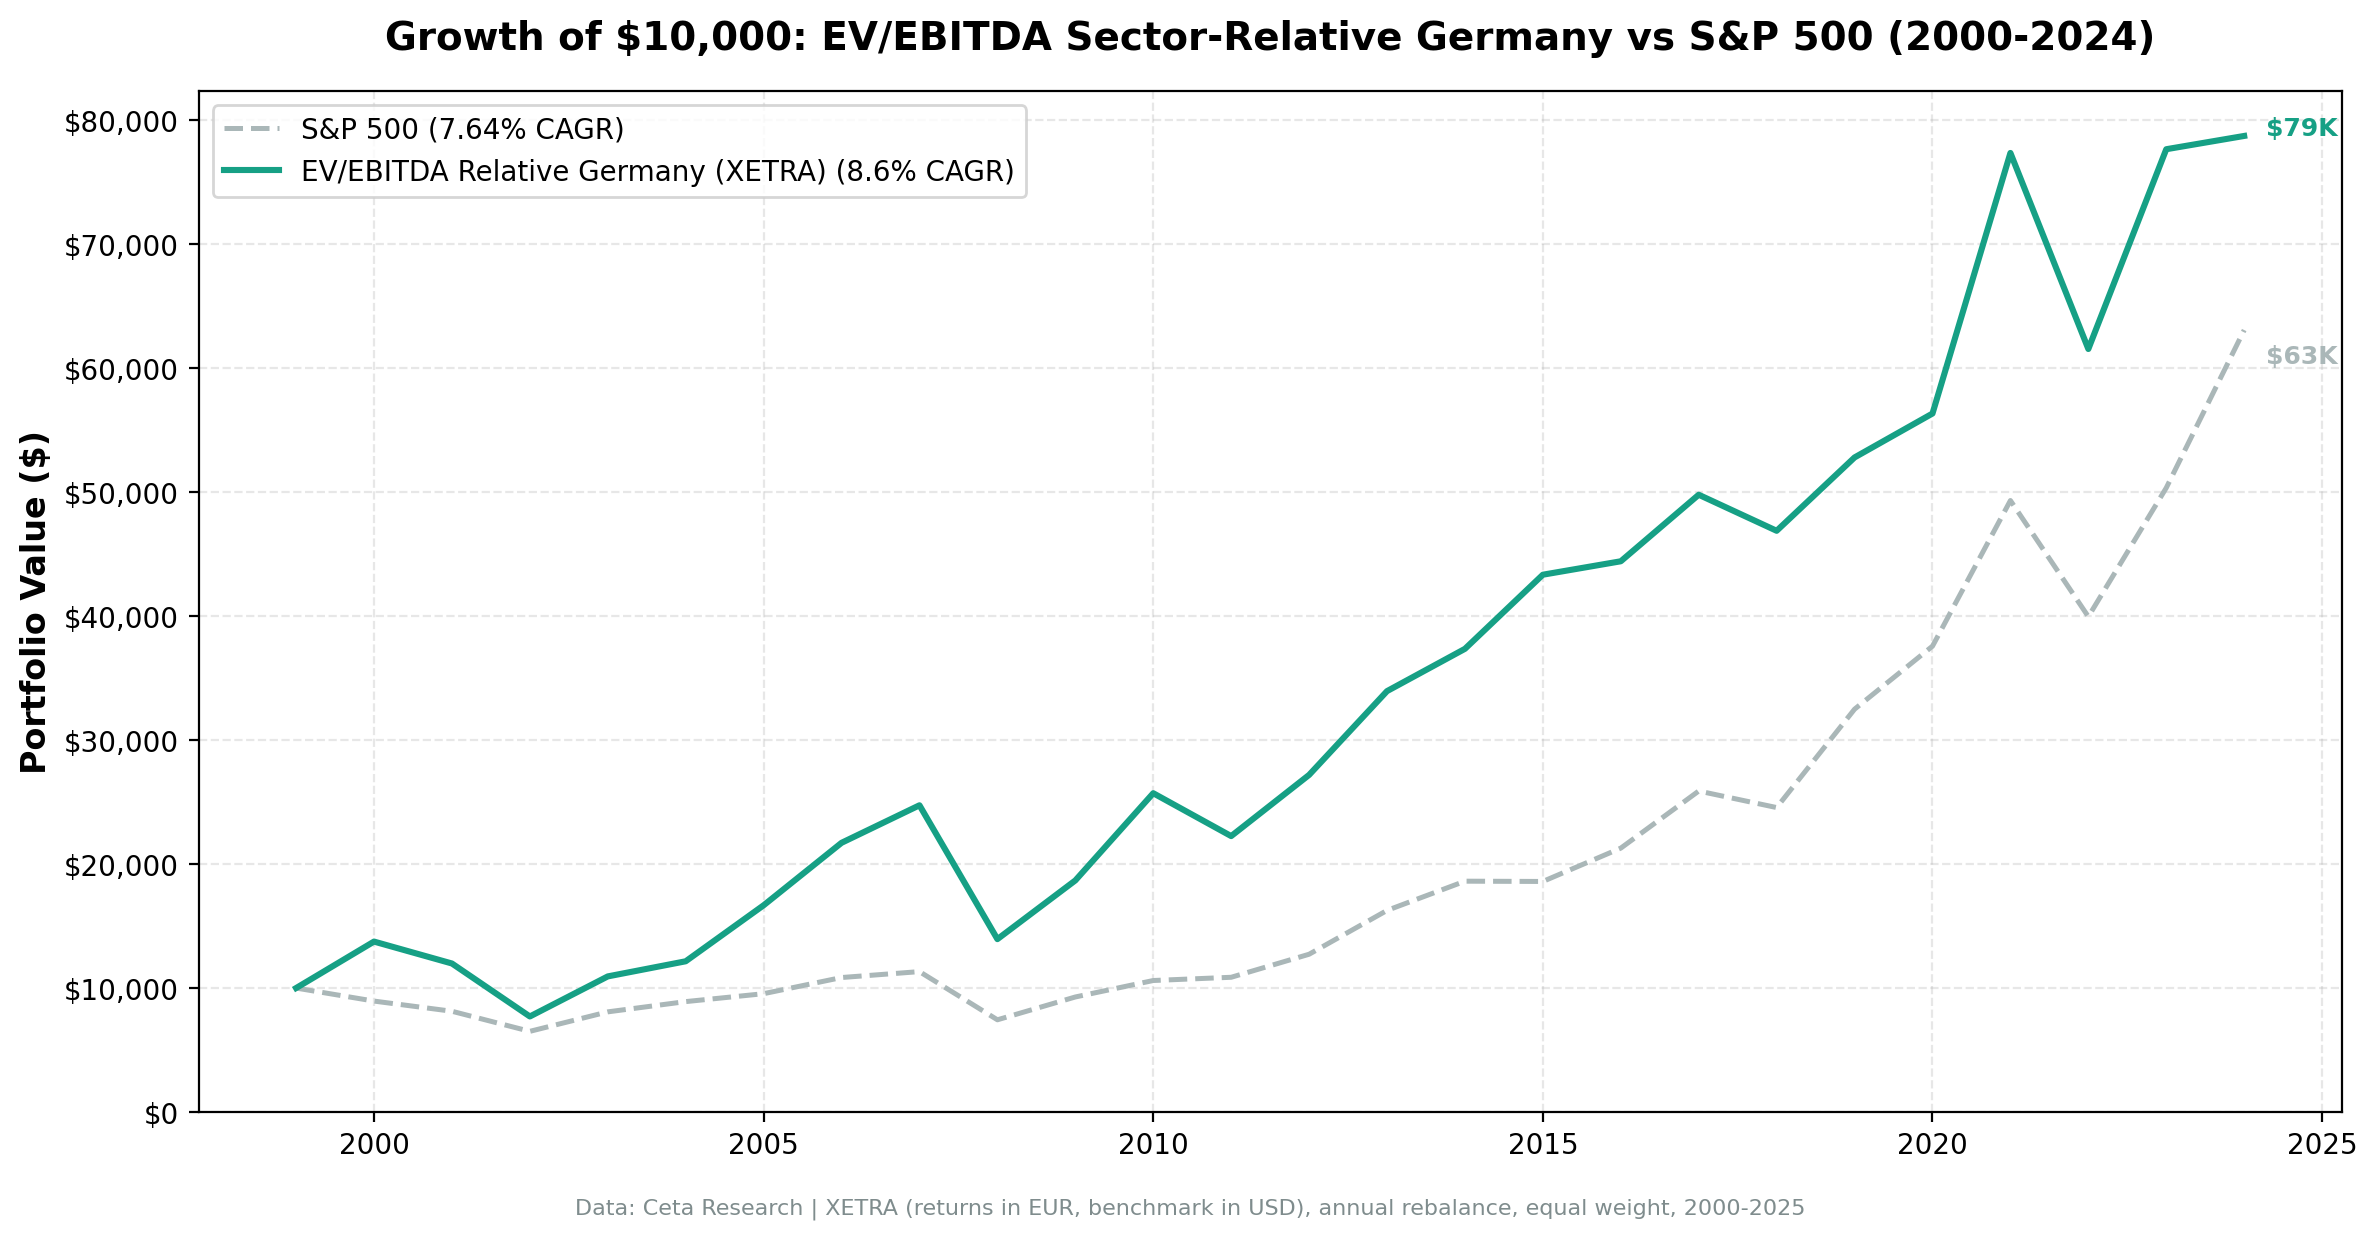
We ran a sector-relative EV/EBITDA screen on 25 years of German stock data from XETRA. The signal: buy when a stock's EV/EBITDA falls below 70% of its sector median, filtered for quality (ROE > 8%, D/E < 2.0, MCap > €500M). The strategy returned 8.60% annually vs 7.64% for the S&P 500, with zero cash periods across all 25 years. The win rate was only 48%, but the few alpha years were large enough to drive meaningful long-run outperformance. Germany's result is a study in asymmetric returns: losing more often, but the wins compound.
Contents
- Method
- The Screen
- Sector-Relative EV/EBITDA Screen for XETRA (SQL)
- What We Found
- 25 years. Zero cash. 48% win rate. Still +0.96% annual alpha.
- Why 48% win rate still generates alpha
- Year-by-year returns
- 2000: +48% excess while the dot-com bubble burst
- 2002: Germany's own crash
- 2005, 2006, 2007: three years of clean outperformance
- 2008: the deep drawdown
- 2016-2020: the growth-regime drag
- 2021-2023: recovery
- Backtest Methodology
- Limitations
- Conclusion
Method
| Parameter | Detail |
|---|---|
| Data source | Ceta Research (FMP financial data warehouse) |
| Universe | XETRA, MCap > €500M |
| Signal | Stock EV/EBITDA < 70% of sector median (30%+ discount to peers) |
| EV/EBITDA range | 0.5-25x |
| Quality filters | ROE > 8%, D/E < 2.0 |
| Portfolio | Top 30 by deepest discount, equal weight |
| Rebalancing | Annual (January) |
| Cash rule | Hold cash if fewer than 10 stocks qualify |
| Period | 2000-2025 (25 years, 0 cash periods) |
| Benchmark | S&P 500 Total Return (SPY, USD) |
Financial data sourced from key_metrics_ttm for EV/EBITDA and market cap, financial_ratios_ttm for debt metrics, profile for sector classification. 45-day lag on all financial statements to prevent look-ahead bias.
The Screen
Sector-Relative EV/EBITDA Screen for XETRA (SQL)
WITH universe AS (
 SELECT k.symbol, p.companyName, p.exchange, p.sector,
 k.evToEBITDATTM AS ev_ebitda, k.returnOnEquityTTM AS roe,
 fr.debtToEquityRatioTTM AS de, k.marketCap
 FROM key_metrics_ttm k
 JOIN financial_ratios_ttm fr ON k.symbol = fr.symbol
 JOIN profile p ON k.symbol = p.symbol
 WHERE k.evToEBITDATTM BETWEEN 0.5 AND 25
 AND k.returnOnEquityTTM > 0.08
 AND (fr.debtToEquityRatioTTM IS NULL OR (fr.debtToEquityRatioTTM >= 0 AND fr.debtToEquityRatioTTM < 2.0))
 AND k.marketCap > 500000000
 AND p.sector IS NOT NULL
 AND p.exchange IN ('XETRA')
),
sector_medians AS (
 SELECT exchange, sector,
 PERCENTILE_CONT(0.5) WITHIN GROUP (ORDER BY ev_ebitda) AS median_ev_ebitda,
 COUNT(*) AS n_sector_stocks
 FROM universe GROUP BY exchange, sector HAVING COUNT(*) >= 5
)
SELECT u.symbol, u.companyName, u.exchange, u.sector,
 ROUND(u.ev_ebitda, 2) AS ev_ebitda_ttm,
 ROUND(sm.median_ev_ebitda, 2) AS sector_median_ev_ebitda,
 ROUND(u.ev_ebitda / sm.median_ev_ebitda, 3) AS ev_ratio_to_sector,
 ROUND((1 - u.ev_ebitda / sm.median_ev_ebitda) * 100, 1) AS discount_pct,
 ROUND(u.roe * 100, 1) AS roe_pct,
 ROUND(u.de, 2) AS debt_to_equity,
 ROUND(u.marketCap / 1e9, 2) AS mktcap_b
FROM universe u JOIN sector_medians sm ON u.exchange = sm.exchange AND u.sector = sm.sector
WHERE u.ev_ebitda / sm.median_ev_ebitda < 0.70
ORDER BY u.ev_ebitda / sm.median_ev_ebitda ASC LIMIT 30
Run this screen on Ceta Research
What We Found
25 years. Zero cash. 48% win rate. Still +0.96% annual alpha.
| Metric | EV/EBITDA Sector-Relative (Germany) | S&P 500 |
|---|---|---|
| CAGR | 8.60% | 7.64% |
| Total Return | 687.41% | 530.71% |
| Sharpe Ratio | 0.284 | 0.322 |
| Sortino Ratio | 0.491 | 0.556 |
| Calmar Ratio | 0.196 | - |
| Max Drawdown | -43.93% | -34.90% |
| Up Capture | 106.52% | 100% |
| Down Capture | 66.14% | 100% |
| Win Rate vs SPY | 48% | - |
| Avg Stocks per Year | 19.4 | - |
| Cash Periods | 0 of 25 | - |
The XETRA universe consistently produced qualifying stocks every single year from 2000 to 2025. Germany's sector diversity, particularly in industrials, chemicals, financials, and consumer names, ensured the discount signal always found enough targets.
The numbers here don't look as clean as Switzerland or the US. Sharpe 0.284, MaxDD -43.93%, win rate 48%. But the CAGR beats SPY, the terminal wealth is higher, and the zero cash periods means full participation across all 25 years.
Why 48% win rate still generates alpha
The win rate of 48% below 50% seems like a failure. It's not. The years the strategy beat SPY, it beat it by a lot. The years it lost, it often lost by a moderate margin.
Consider the distribution:
- 2000: +48.0% excess
- 2005: +30.0% excess
- 2010: +23.4% excess
- 2015: +16.1% excess
Those four years alone generated enormous cumulative gaps. The losing years were smaller and more spread out. That asymmetry, large wins vs modest losses, is what makes a 48% win rate compound into positive alpha over 25 years.
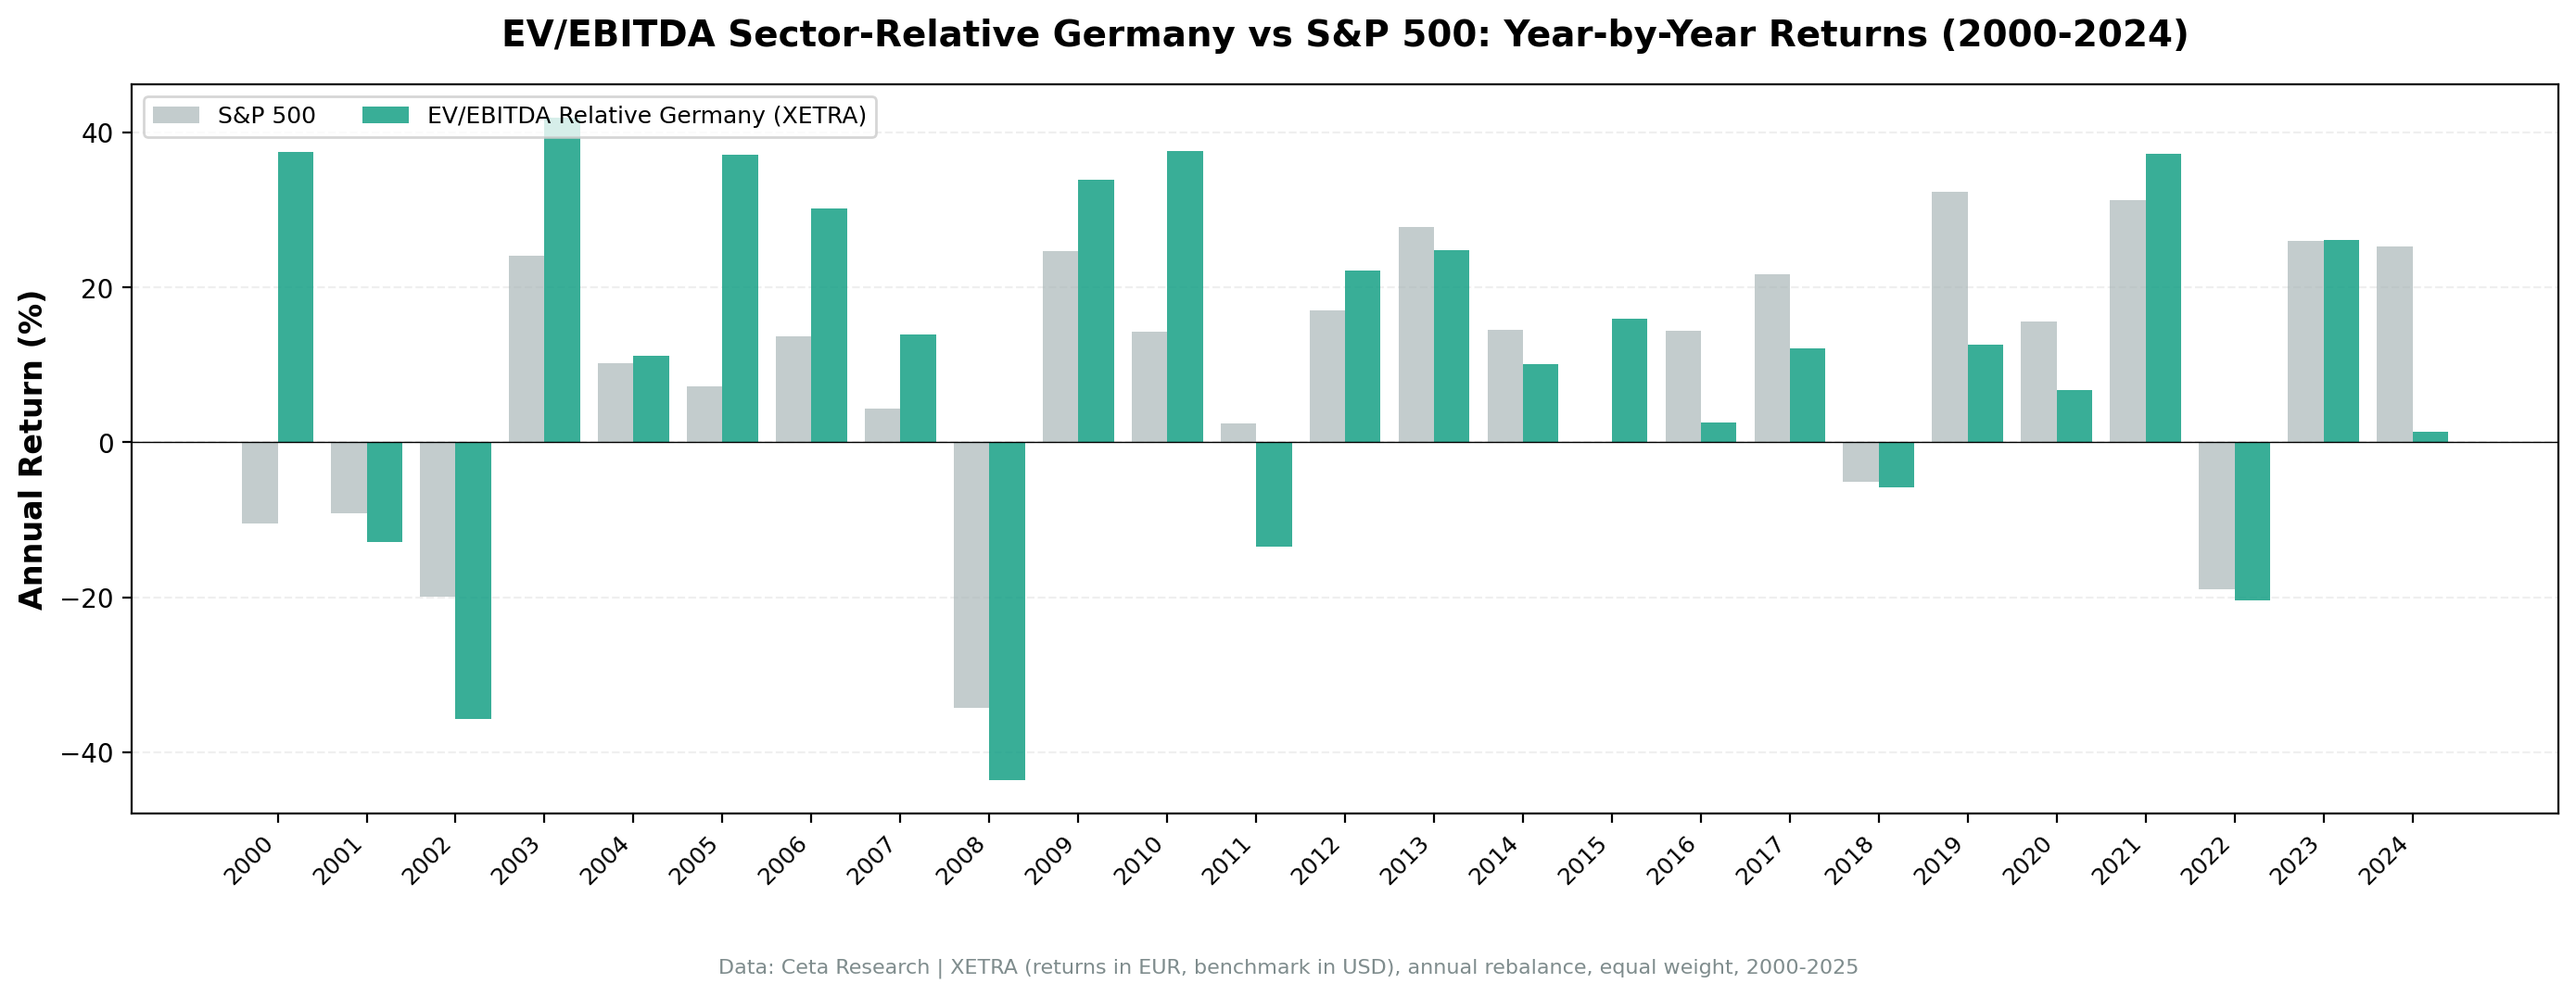
Year-by-year returns
| Year | Strategy | S&P 500 | Excess |
|---|---|---|---|
| 2000 | +37.5% | -10.5% | +48.0% |
| 2001 | -12.9% | -9.2% | -3.7% |
| 2002 | -35.7% | -19.9% | -15.7% |
| 2003 | +41.9% | +24.1% | +17.8% |
| 2004 | +11.2% | +10.2% | +0.9% |
| 2005 | +37.1% | +7.2% | +30.0% |
| 2006 | +30.2% | +13.7% | +16.6% |
| 2007 | +13.9% | +4.4% | +9.5% |
| 2008 | -43.6% | -34.3% | -9.3% |
| 2009 | +33.9% | +24.7% | +9.2% |
| 2010 | +37.7% | +14.3% | +23.4% |
| 2011 | -13.4% | +2.5% | -15.9% |
| 2012 | +22.2% | +17.1% | +5.1% |
| 2013 | +24.9% | +27.8% | -2.9% |
| 2014 | +10.1% | +14.5% | -4.4% |
| 2015 | +16.0% | -0.1% | +16.1% |
| 2016 | +2.5% | +14.4% | -11.9% |
| 2017 | +12.1% | +21.6% | -9.6% |
| 2018 | -5.8% | -5.2% | -0.7% |
| 2019 | +12.6% | +32.3% | -19.7% |
| 2020 | +6.7% | +15.6% | -8.9% |
| 2021 | +37.3% | +31.3% | +6.0% |
| 2022 | -20.4% | -19.0% | -1.4% |
| 2023 | +26.2% | +26.0% | +0.2% |
| 2024 | +1.4% | +25.3% | -23.9% |
2000: +48% excess while the dot-com bubble burst
The single best year in this 25-year record. German industrials, chemicals, and financial sector names at EV/EBITDA discounts had nothing to do with the US tech bubble. While the S&P 500 dropped -10.5%, these companies kept compounding. The sector-relative signal ensured we were in names cheap relative to their German peers, not compared to global growth stocks with inflated multiples.
That one year's excess return, +48 percentage points vs SPY, set a cumulative lead that the strategy broadly maintained for over a decade.
2002: Germany's own crash
The Neuer Markt bubble collapse hit Germany specifically. While the US had already digested much of the dot-com damage, German small-cap tech and media names imploded in 2002. The strategy returned -35.7%, worse than SPY's -19.9%. The quality filters helped (ROE > 8%, D/E < 2.0 kept out the most speculative names), but German-listed industrial and financial names still fell sharply in the broader selloff.
2005, 2006, 2007: three years of clean outperformance
The pre-crisis European expansion drove German exporters and industrials to strong earnings. Sector discounts closed as fundamentals improved. Three consecutive years of 9-30% excess returns built a substantial lead over SPY heading into 2008.
2008: the deep drawdown
The max drawdown of -43.93% traces almost entirely to 2008, when the portfolio fell -43.6%. German industrials and financials were directly exposed to the global credit crisis. No quality filter fully protects a value-tilted portfolio when credit markets freeze and global trade collapses simultaneously.
The down-capture of 66.14% (average across all years) reflects the reality that Germany's export-heavy economy amplifies global cycles. Switzerland's 35% down-capture shows what a defensive, less-cyclical market looks like by comparison.
2016-2020: the growth-regime drag
Five of these six years produced negative excess returns, with 2019 (-19.7%) particularly painful. Global capital was repricing toward US tech assets, and European value stocks, even cheap ones, weren't the destination. German industrial and automotive sectors faced structural headwinds from China slowdown and trade policy uncertainty.
2021-2023: recovery
The value rotation of 2021-2022 helped. German value stocks outperformed the US in 2021 (+6.0% excess) and held up well in 2022 while SPY fell -19.0%. The strategy clawed back some of the growth-regime underperformance. 2023 nearly matched SPY (+0.2% excess). Then 2024 saw a -23.9% gap as Germany entered recession and US tech surged.
Backtest Methodology
Full methodology: backtests/METHODOLOGY.md
| Parameter | Choice |
|---|---|
| Universe | XETRA, MCap > €500M |
| Signal | EV/EBITDA < 70% of sector median, range 0.5-25x |
| Quality | ROE > 8%, D/E < 2.0 |
| Portfolio | Top 30 by deepest discount, equal weight |
| Rebalancing | Annual (January) |
| Cash rule | Hold cash if < 10 qualify |
| Benchmark | S&P 500 Total Return (SPY, USD) |
| Period | 2000-2025 (25 years) |
| Data | Point-in-time (45-day lag on FY financial statements) |
| Transaction costs | 0.1% one-way (size-tiered by market cap) |
Limitations
MaxDD -43.93%. Worse than SPY's -34.90%. Germany's industrial and export-heavy composition means downturns can be severe. The single worst year (2008) drove essentially the entire max drawdown.
Win rate 48%. The strategy underperforms SPY in more individual years than it outperforms. Conviction is required to hold through prolonged losing streaks like 2016-2020.
Currency effects. Returns are in EUR. The benchmark (SPY) is in USD. EUR/USD fluctuation adds noise to the comparison. European investors get the full EUR return; USD-based investors carry FX exposure.
Sector concentration risk. XETRA is overweight industrials and chemicals relative to a global benchmark. Without a sector cap, the portfolio can cluster in these sectors. Cyclical sector concentration amplifies exposure to global trade and manufacturing cycles.
2024 recession sensitivity. Germany's structural challenges (automotive transition, energy costs, China competition) created a difficult environment for industrial value stocks in 2024. The -23.9% excess return that year reflects both a German-specific problem and a global value-vs-growth rotation.
Conclusion
Sector-relative EV/EBITDA on XETRA delivered 8.60% CAGR over 25 years, with zero cash periods and +0.96% annual alpha vs SPY. The win rate of 48% is below 50%, but the asymmetry of the return distribution, large wins, moderate losses, is what generates alpha over a full cycle.
Germany is a cyclical, export-driven market. The signal works when global trade expands and sector discounts close on the back of improving earnings. It doesn't work when capital floods into US tech or when German industry faces structural headwinds. Both regimes appeared in this 25-year window.
The early record (2000-2015) is strong. The recent record (2016-2024) is mixed. The question for any investor considering this strategy is whether the German economy's structural challenges are cyclical or permanent.
Part of a Series: Sweden | Global | US | UK | Switzerland | Japan | India | Hong Kong
Run It Yourself
Explore the data behind this analysis on Ceta Research. Query our financial data warehouse with SQL, build custom screens, and run your own backtests across 70,000+ stocks on 20 exchanges.
Data: Ceta Research (FMP financial data warehouse). Returns in EUR (local currency). Benchmark S&P 500 in USD. Past performance doesn't guarantee future results. See full methodology at github.com/ceta-research/backtests.


