
GARP on German Stocks: Beats the DAX by 4.4% Annually Over 25 Years
GARP on XETRA stocks from 2000 to 2025. 9.52% CAGR vs the DAX's 5.12%. 4.40% annual excess, 65% down capture, Sharpe 2.5x the index. Germany is one of the few markets where GARP generates real alpha vs its local benchmark.

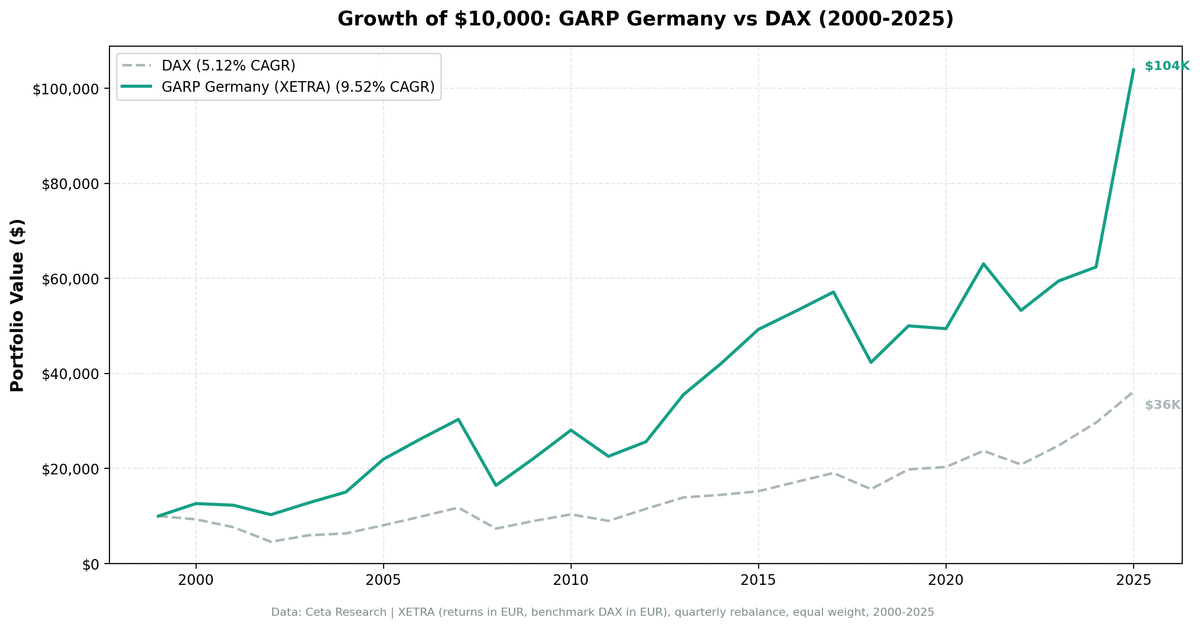
We ran the Growth at a Reasonable Price (GARP) strategy on German stocks (XETRA) from 2000 to 2025. The result: 9.52% CAGR vs the DAX's 5.12%, with a maximum drawdown of -48.42% against the DAX's -65.15%. A $10,000 investment grew to $103,888 in Germany GARP vs $36,177 in the DAX. The strategy outperformed its local benchmark by 4.40 percentage points annually.
Contents
- Method
- What is GARP?
- What We Found
- 9.52% CAGR. 4.40% above the DAX. 65% down capture.
- Year-by-Year Returns
- 2000–2002: where the edge is built
- 2003: the recovery year
- The middle decade: consistent tracking
- 2016–2020: structural lag
- 2025: the exceptional year
- The Down Capture Story
- Limitations
- Takeaway
- Part of a Series
- Run This Screen Yourself
- References
Data: FMP financial data warehouse, 2000–2025. Updated March 2026.
Method
Data source: Ceta Research (FMP financial data warehouse) Universe: XETRA (Deutsche Börse), market cap > €500M (European thresholds in local currency) Period: 2000–2025 (25 years, 103 quarterly periods) Rebalancing: Quarterly (January, April, July, October), equal weight Benchmark: DAX (^GDAXI, in EUR, local currency comparison) Returns: Calculated in EUR Cash rule: Hold cash if fewer than 10 stocks qualify
Financial data uses a 45-day lag on annual filings. All signal filters use fiscal year data as available at each rebalance date.
What is GARP?
GARP, Growth at a Reasonable Price, is Peter Lynch's framework from One Up on Wall Street (1989). The PEG ratio (P/E divided by earnings growth rate) is the key metric. PEG < 1.5 means you're paying at most 1.5× the growth rate in valuation terms.
All six filters must pass at each quarterly rebalance:
| Filter | Threshold | Why |
|---|---|---|
| PEG ratio | 0 < PEG < 1.5 | Not overpaying for growth |
| P/E ratio | 5 < P/E < 50 | Exclude distressed and speculative |
| Revenue growth (YoY) | > 15% | Must be demonstrably growing |
| ROE | > 10% | Quality filter |
| Debt/Equity | < 2.0 | Leverage constraint |
| Market cap | > €500M | Institutional-grade European stocks |
The portfolio holds the top 30 by lowest PEG ratio, equal weight.
What We Found

9.52% CAGR. 4.40% above the DAX. 65% down capture.
| Metric | GARP Germany | DAX |
|---|---|---|
| CAGR | 9.52% | 5.12% |
| Total Return | 939% | 262% |
| Max Drawdown | -48.42% | -65.15% |
| Volatility | 21.62% | 22.49% |
| Sharpe Ratio | 0.348 | 0.139 |
| Up Capture | 95.61% | n/a |
| Down Capture | 64.52% | n/a |
| Beta | 0.773 | n/a |
| Cash Periods | 0 of 103 | n/a |
| Avg Stocks | 16.5 | n/a |
Germany GARP was fully invested every quarter. The average portfolio held 16.5 stocks, fewer than other markets, reflecting Germany's more concentrated mid-large cap universe on XETRA.
The standout number is down capture: 64.52%. In quarters when the DAX fell, Germany GARP fell only 65% as much. Combined with slightly lower volatility (21.6% vs 22.5% for the DAX), the strategy delivered substantially better risk-adjusted returns than its local benchmark.
The Sharpe ratio (0.348 vs 0.139 for DAX) is roughly 2.5 times that of the index. Germany GARP didn't just beat the DAX on return; it delivered that return with lower volatility and much smaller drawdowns.
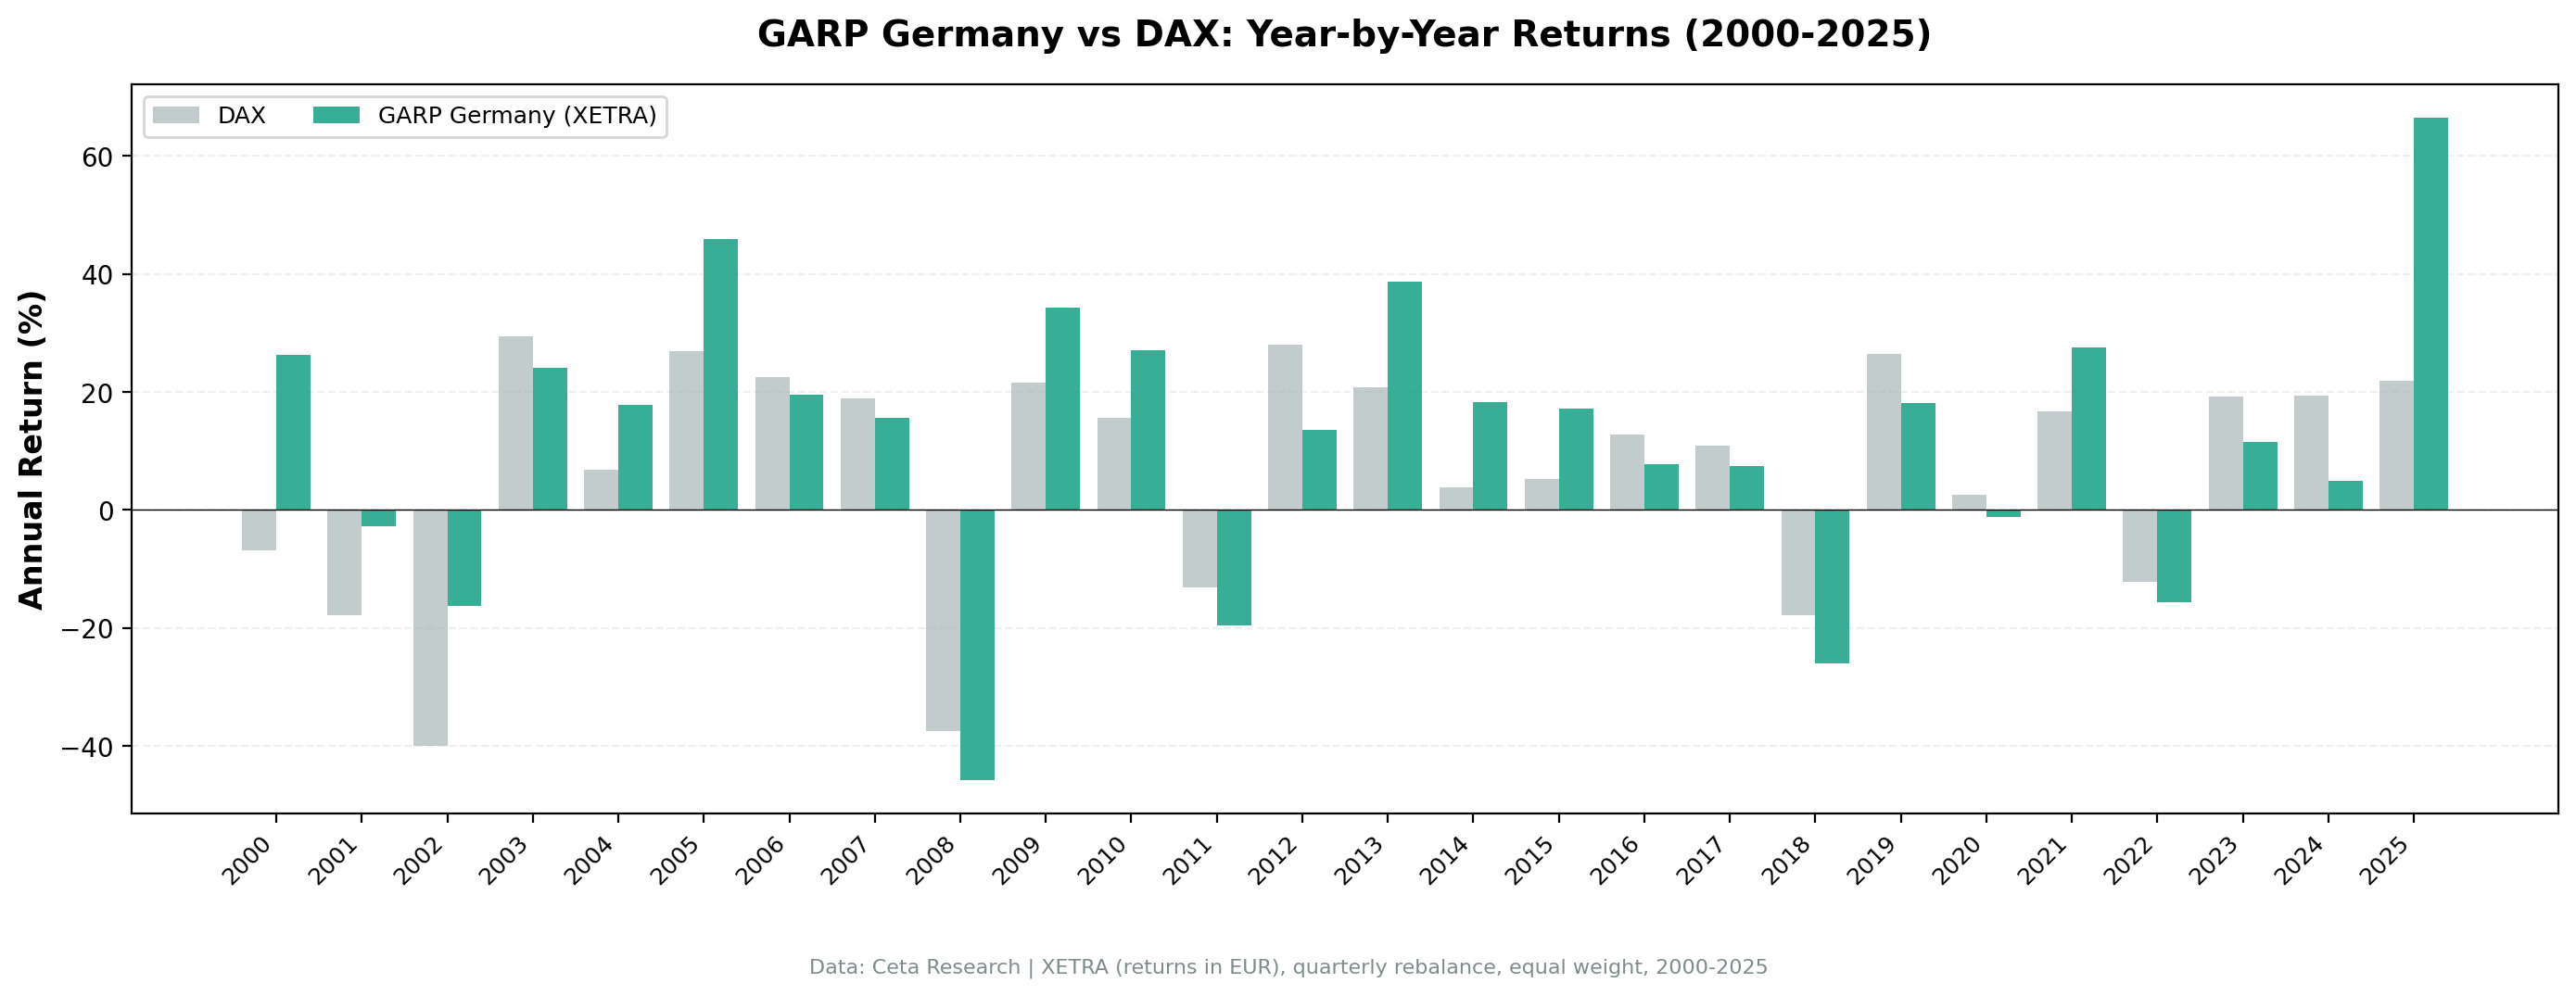
Year-by-Year Returns
| Year | GARP Germany | DAX | Excess |
|---|---|---|---|
| 2000 | +26.3% | -6.8% | +33.1% |
| 2001 | -2.7% | -17.8% | +15.1% |
| 2002 | -16.2% | -39.9% | +23.7% |
| 2003 | +24.1% | +29.4% | -5.3% |
| 2004 | +17.9% | +6.8% | +11.1% |
| 2005 | +45.9% | +27.0% | +18.9% |
| 2006 | +19.6% | +22.6% | -3.0% |
| 2007 | +15.6% | +19.0% | -3.4% |
| 2008 | -45.8% | -37.4% | -8.3% |
| 2009 | +34.4% | +21.6% | +12.7% |
| 2010 | +27.0% | +15.6% | +11.4% |
| 2011 | -19.6% | -13.1% | -6.5% |
| 2012 | +13.6% | +28.0% | -14.5% |
| 2013 | +38.7% | +20.8% | +17.8% |
| 2014 | +18.4% | +3.9% | +14.5% |
| 2015 | +17.1% | +5.3% | +11.8% |
| 2016 | +7.8% | +12.8% | -5.0% |
| 2017 | +7.5% | +11.0% | -3.5% |
| 2018 | -25.9% | -17.8% | -8.1% |
| 2019 | +18.1% | +26.5% | -8.4% |
| 2020 | -1.2% | +2.5% | -3.7% |
| 2021 | +27.6% | +16.7% | +10.9% |
| 2022 | -15.5% | -12.2% | -3.4% |
| 2023 | +11.6% | +19.2% | -7.6% |
| 2024 | +5.0% | +19.4% | -14.5% |
| 2025 | +66.5% | +22.0% | +44.5% |
2000–2002: where the edge is built
The DAX lost 6.8%, 17.8%, and 39.9% in the three years following the dot-com peak. Germany GARP fell in 2002 (-16.2%) but avoided 2001's crash (-2.7%) and held strongly positive in 2000 (+26.3%). The quality and valuation filters kept highly leveraged tech and telecom names out of the portfolio precisely when those sectors were destroying capital.
Three years of relative outperformance in 2000, 2001, and 2002 (+33.1%, +15.1%, +23.7%) built the foundation for Germany GARP's long-run excess return. Much of the 4.40% annual excess traces back to those years.
2003: the recovery year
Germany GARP returned +24.1% while the DAX rebounded +29.4%. The screen lagged the bounce by about 5 points, but it still participated strongly. Unlike a pure defensive strategy that sits out recoveries, GARP held companies that were growing into their valuations, so it captured most of the upside when the market turned.
The middle decade: consistent tracking
From 2004 to 2017, Germany GARP tracked the DAX reasonably closely with a positive bias. Strong years (2005: +18.9% excess, 2009: +12.7%, 2010: +11.4%, 2013: +17.8%, 2014: +14.5%, 2015: +11.8%) balanced against weaker years (2012: -14.5%). The consistent investment, zero cash periods, reflects Germany's deep qualifying GARP universe throughout.
2016–2020: structural lag
Germany GARP trailed from 2016–2020 as the DAX benefited from QE-driven multiple expansion. The strategy's PEG cap and ROE requirement excluded many DAX companies during this period of low-rate, low-growth valuations.
2025: the exceptional year
2025 returned +66.5% vs the DAX's +22.0%. German industrial companies with genuine revenue growth, benefiting from European defense spending and the post-pandemic manufacturing cycle, found PEG ratios below 1.5 while growing at 20%+. The GARP screen found exactly what it was designed for. A single year at the extreme isn't a trend, but it shows the screen still works when conditions align.
The Down Capture Story
The most compelling metric for German investors is the 64.52% down capture. When the DAX had negative quarters, Germany GARP fell only 65% as much on average.
The screen's structural bias toward quality (ROE > 10%, D/E < 2.0) keeps financially stressed companies out. In German industrial markets, heavily leveraged companies and those with thin margins tend to fall hardest in downturns. GARP naturally excludes these.
The 2000–2002 period is the clearest example. The DAX lost nearly 70% peak-to-trough during the dot-com crash. Germany GARP's peak-to-trough drawdown over the same period was much shallower because it held companies that were actually growing at reasonable valuations, not dot-com infrastructure plays.
For a European investor building a systematic German equity portfolio, this is the practical case: not just better absolute returns than the DAX, but better risk-adjusted returns. The Sharpe ratio difference (0.348 vs 0.139) says the strategy generates roughly 2.5 times the return per unit of risk.
Limitations
Currency comparison. Germany GARP returns are in EUR. International investors also face EUR/USD exchange rate movements. The DAX comparison is apples-to-apples on currency.
Small portfolio. Germany GARP held an average of 16.5 stocks, near the minimum threshold. Fewer stocks means more idiosyncratic risk and more dependence on individual company performance.
XETRA universe. Only German companies on XETRA are included. Many German companies list on Frankfurt's non-XETRA segments or trade OTC. This may exclude some smaller qualifying companies.
Survivorship bias. Company profiles use current exchange listings. German companies that delisted, merged, or failed during 2000–2025 aren't tracked through their terminal events.
2003 recovery. The DAX rebounded strongly in 2003 (+29.4%) while GARP returned +24.1%, lagging by about 5 points. Investors who entered at the 2002 trough would have seen GARP participate in the recovery but trail the index that year.
Takeaway
Germany GARP returns 9.52% per year over 25 years, beating the DAX by 4.40 percentage points annually. A $10,000 investment in GARP grew to $103,888 vs $36,177 in the DAX index. The maximum drawdown (-48.42%) is substantially shallower than the DAX's (-65.15%). Sharpe ratio is roughly 2.5 times the index.
The case for Germany GARP is concrete: a systematic quality-growth screen on German stocks outperforms the local market on both absolute and risk-adjusted terms. The down capture (65%) shows the screen provides genuine crash protection without sacrificing much upside (96% up capture).
The 4.40% annual excess is driven partly by the early 2000s crash protection and partly by consistent alpha generation in specific years. It's not a lucky single period: the win rate vs DAX over 25 years is 55.3%.
Part of a Series
This post is part of our GARP global exchange comparison:
- GARP on US Stocks (NYSE + NASDAQ + AMEX). 25 years, underperforms SPY
- GARP on Indian Stocks (NSE). Barely beats Sensex, strong vs SPY due to India's growth premium
- GARP: 17-Exchange Global Comparison. Full results across 17 markets
Run This Screen Yourself
The current GARP screen (German stocks on XETRA, TTM data):
WITH latest_income AS (
    SELECT symbol, revenue, dateEpoch,
           ROW_NUMBER() OVER (PARTITION BY symbol ORDER BY dateEpoch DESC) AS rn
    FROM income_statement WHERE period = 'FY' AND revenue > 0
),
rev_growth AS (
    SELECT c.symbol,
           ROUND((c.revenue - p.revenue) / ABS(p.revenue) * 100, 1) AS rev_growth_pct
    FROM latest_income c
    JOIN latest_income p ON c.symbol = p.symbol AND c.rn = 1 AND p.rn = 2
    WHERE p.revenue > 0 AND (c.revenue - p.revenue) / ABS(p.revenue) > 0.15
)
SELECT f.symbol, p.companyName, p.sector,
    ROUND(f.priceToEarningsGrowthRatioTTM, 3) AS peg_ratio,
    ROUND(f.priceToEarningsRatioTTM, 2) AS pe_ratio,
    ROUND(k.returnOnEquityTTM * 100, 1) AS roe_pct,
    ROUND(f.debtToEquityRatioTTM, 2) AS debt_to_equity,
    g.rev_growth_pct,
    ROUND(k.marketCap / 1e9, 2) AS mktcap_b_eur
FROM financial_ratios_ttm f
JOIN key_metrics_ttm k ON f.symbol = k.symbol
JOIN profile p ON f.symbol = p.symbol
JOIN rev_growth g ON f.symbol = g.symbol
WHERE f.priceToEarningsGrowthRatioTTM > 0 AND f.priceToEarningsGrowthRatioTTM < 1.5
  AND f.priceToEarningsRatioTTM > 5 AND f.priceToEarningsRatioTTM < 50
  AND k.returnOnEquityTTM > 0.10
  AND f.debtToEquityRatioTTM >= 0 AND f.debtToEquityRatioTTM < 2.0
  AND k.marketCap > 500000000
  AND p.exchange IN ('XETRA')
QUALIFY ROW_NUMBER() OVER (PARTITION BY f.symbol ORDER BY f.priceToEarningsGrowthRatioTTM ASC) = 1
ORDER BY f.priceToEarningsGrowthRatioTTM ASC LIMIT 30
Run this screen on Ceta Research
The full backtest code (Python + DuckDB) is on GitHub.
References
- Lynch, P. (1989). One Up on Wall Street. Simon & Schuster.
- Fama, E. & French, K. (1998). "Value Versus Growth: The International Evidence." Journal of Finance, 53(6), 1975–1999.
- Griffin, J. & Karolyi, G. (1998). "Another Look at the Role of the Industrial Structure of Markets for International Diversification Strategies." Journal of Financial Economics, 50(3), 351–373.
Data: Ceta Research, FMP financial data warehouse. Universe: XETRA. Quarterly rebalance, equal weight, transaction costs included, 2000–2025. Returns in EUR.
Past performance does not guarantee future results. This is educational content, not investment advice.


