
GARP on Indian Stocks: Barely Beats the Sensex (+0.63% Annually)
We tested Peter Lynch's GARP strategy on NSE stocks from 2000 to 2025. Against the Sensex benchmark, the excess is 0.63% per year. Against SPY, the apparent 3.73% excess reflects India's growth premium, not GARP alpha. 11.75% CAGR with higher risk than the index.


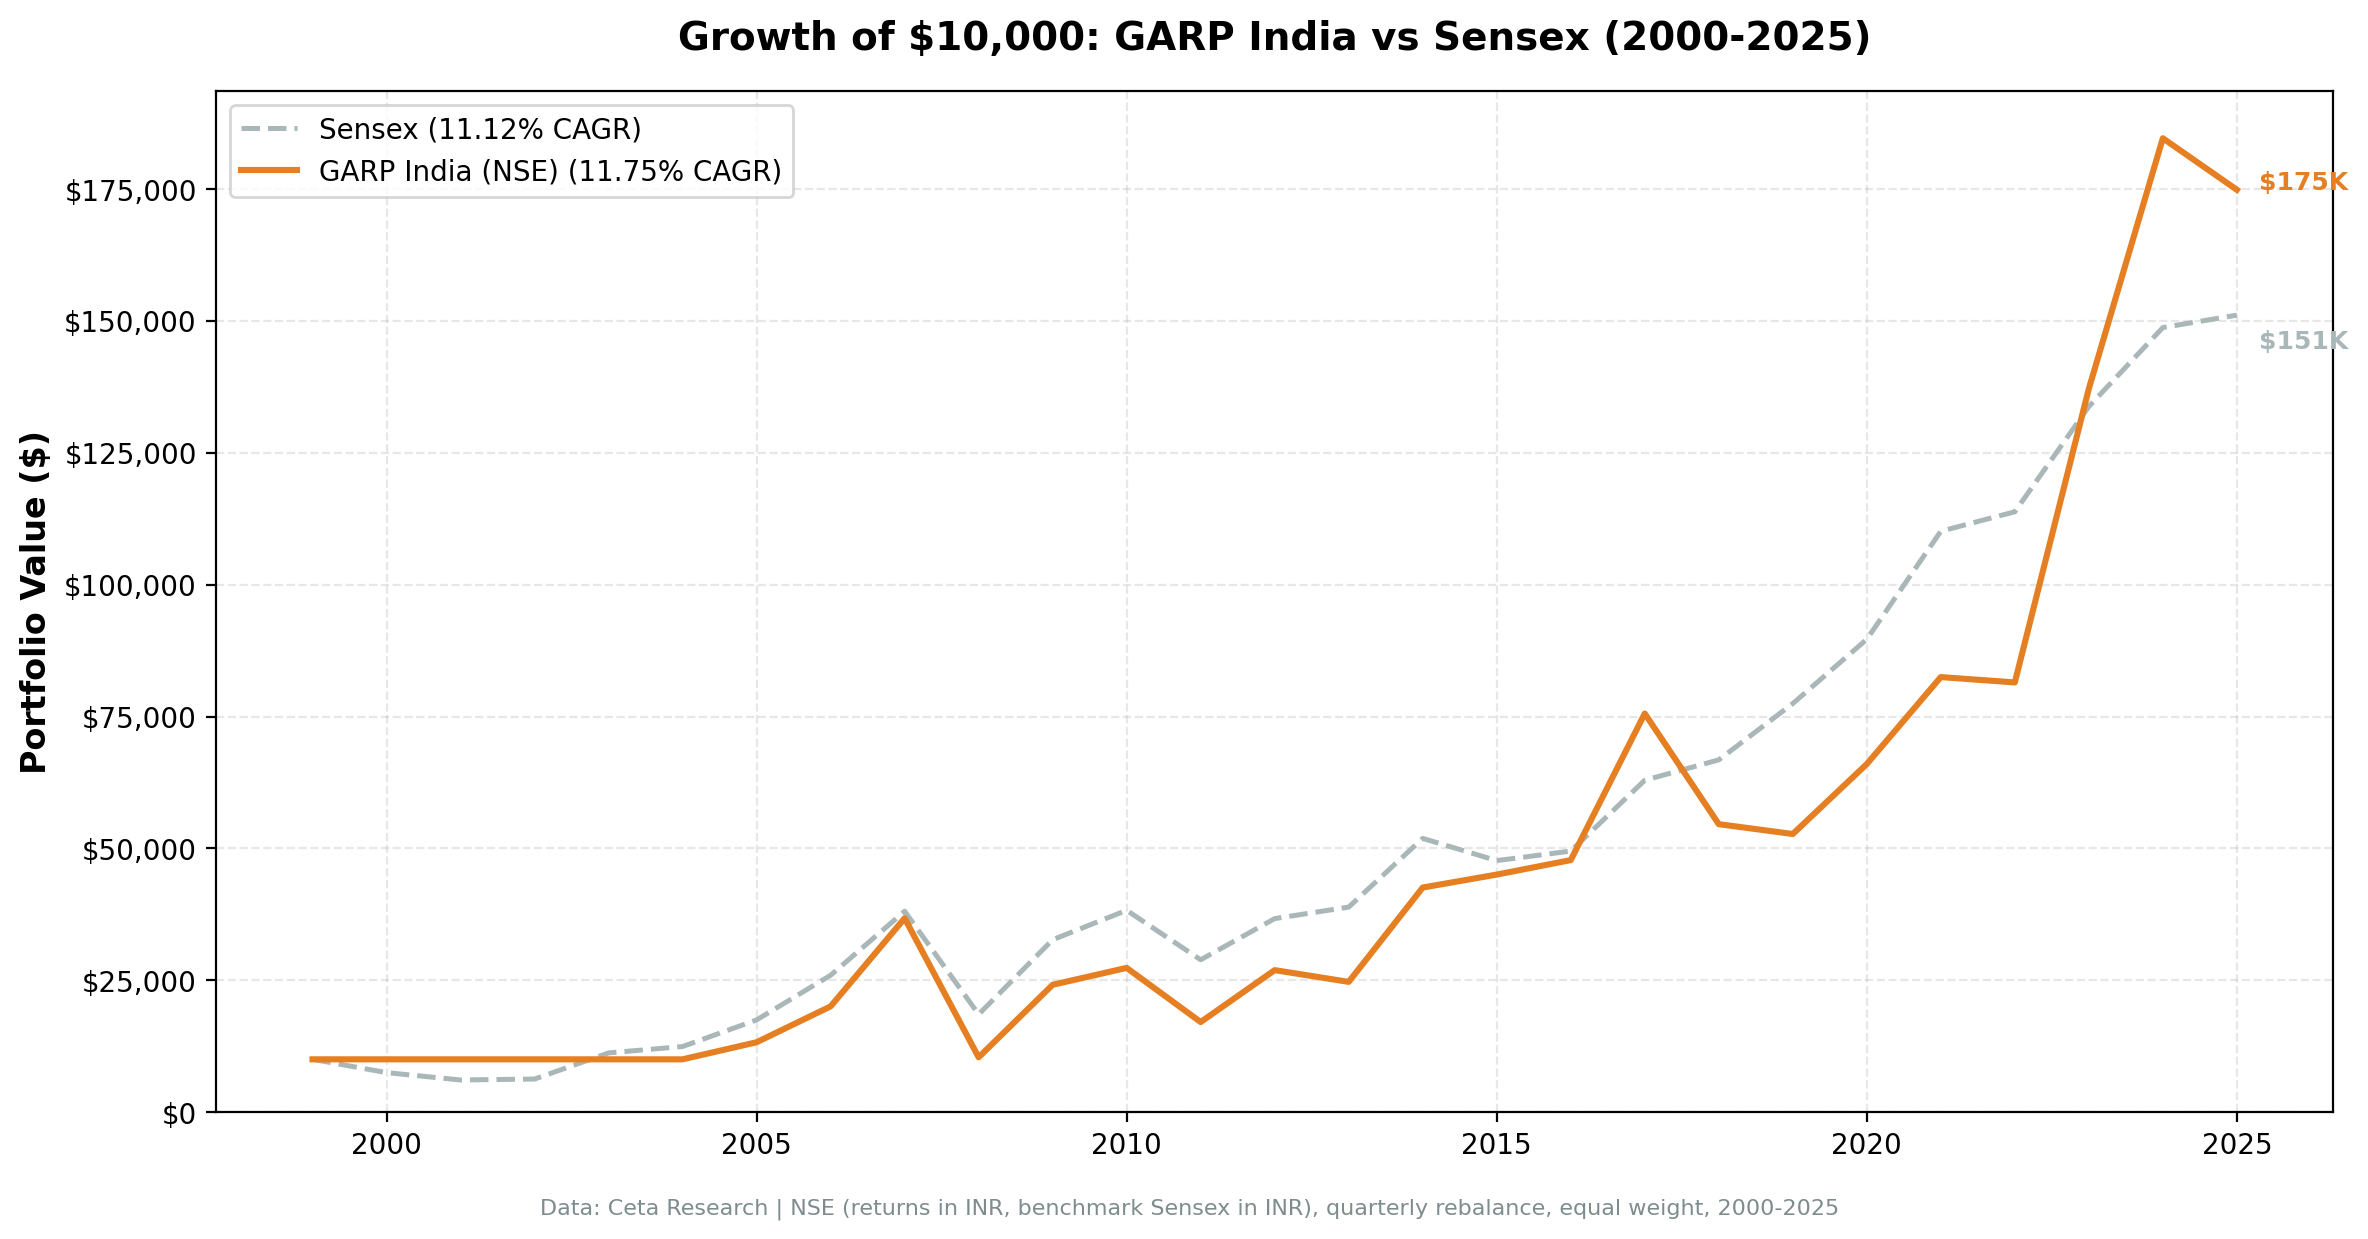
We ran the Growth at a Reasonable Price (GARP) strategy (PEG < 1.5, revenue growth > 15%, ROE > 10%) on Indian stocks (NSE) from 2000 to 2025. The result: 11.75% annualized vs the Sensex's 11.12%. Against India's own benchmark, the margin is 0.63% per year. Against SPY's 8.02% in USD, the apparent excess is +3.73%, but that gap reflects India's stronger growth cycle, not the GARP signal itself. A $10,000 investment grew to $174,833.
Contents
- Method
- What is GARP?
- What We Found
- 11.75% CAGR. +0.63% above Sensex. Marginal edge on returns, higher risk.
- Year-by-Year Returns
- Cash in 2000–2004: missed a major Sensex rally
- 2005–2007: genuine outperformance
- 2008 and 2009: the crash and recovery
- The volatile middle years
- 2023 and 2024: the strongest stretch
- The Honest Assessment
- Limitations
- Takeaway
- Part of a Series
- Run This Screen Yourself
- References
Data: FMP financial data warehouse, 2000–2025. Updated March 2026.
Method
Data source: Ceta Research (FMP financial data warehouse) Universe: NSE, market cap > ₹20B (Indian Rupee) Period: 2000–2025 (25 years, 103 quarterly periods) Rebalancing: Quarterly (January, April, July, October), equal weight Benchmark: Sensex (^BSESN, in INR, local currency comparison) Returns: Calculated in INR (Indian Rupee) Cash rule: Hold cash if fewer than 10 stocks qualify
Financial data uses a 45-day lag on annual filings. PEG ratios, P/E, ROE, and debt-to-equity come from fiscal year filings as available at each rebalance date.
What is GARP?
GARP, Growth at a Reasonable Price, is Peter Lynch's framework from One Up on Wall Street (1989). The PEG ratio (P/E divided by earnings growth rate) is the central metric. A PEG of 1.0 means you're paying one dollar of P/E for each percentage point of growth. Lynch argued that PEG < 1.0 was cheap; we screen at PEG < 1.5.
All six filters must pass at each quarterly rebalance:
| Filter | Threshold | Why |
|---|---|---|
| PEG ratio | 0 < PEG < 1.5 | Not overpaying for growth |
| P/E ratio | 5 < P/E < 50 | Exclude distressed and speculative |
| Revenue growth (YoY) | > 15% | Must be demonstrably growing |
| ROE | > 10% | Quality filter |
| Debt/Equity | < 2.0 | Leverage constraint |
| Market cap | > ₹20B | Institutional-grade Indian stocks |
The portfolio holds the top 30 by lowest PEG ratio, equal weight.
What We Found
11.75% CAGR. +0.63% above Sensex. Marginal edge on returns, higher risk.
| Metric | GARP India | Sensex |
|---|---|---|
| CAGR | 11.75% | 11.12% |
| Total Return | 1,648% | 1,411% |
| Max Drawdown | -73.42% | -51.34% |
| Volatility | 32.23% | 23.83% |
| Sharpe Ratio | 0.163 | 0.194 |
| Up Capture | 113.3% | n/a |
| Down Capture | 105.3% | n/a |
| Cash Periods | 22 of 103 | n/a |
| Avg Stocks (invested) | 25.5 | n/a |
The return edge vs Sensex is 0.63% per year. The risk taken to get there is substantially higher: 32.2% annualized volatility vs 23.8% for the Sensex, and a -73.42% maximum drawdown vs -51.34% for the index.
The Sharpe ratio (0.163 vs 0.194) shows the Sensex has better risk-adjusted returns than India GARP over this period. The screen finds higher absolute CAGR but at a worse return-to-risk trade.
The up/down capture vs the Sensex (113%/105%) shows the portfolio amplifies both bull markets and bear markets relative to the Indian index. The slight gap between them is far smaller than the defensive asymmetry that appears when comparing to SPY in USD. That comparison masked a currency and economic growth effect, not a stock selection edge.
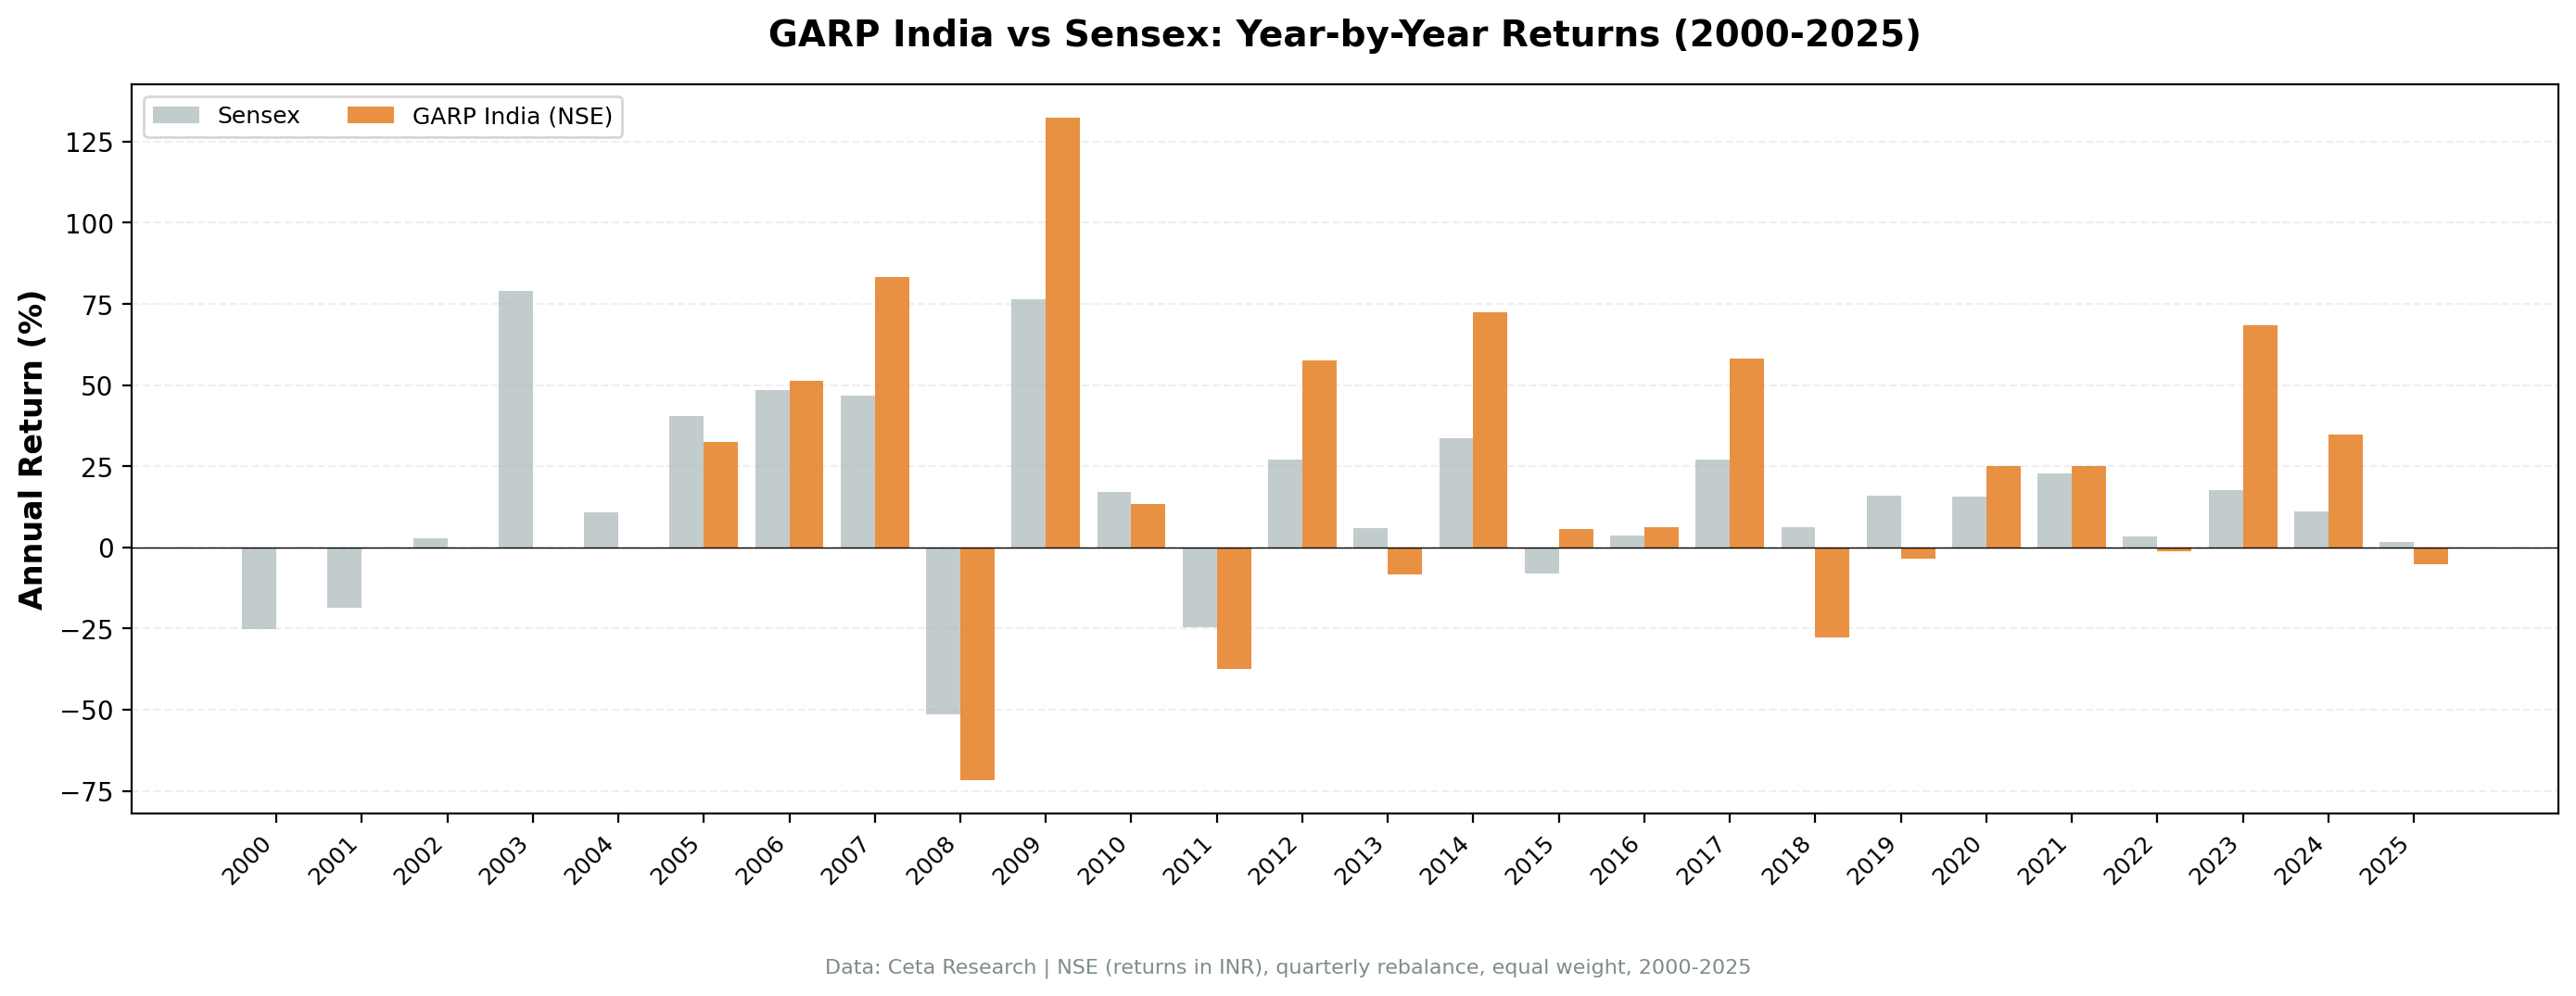
Year-by-Year Returns
| Year | GARP India | Sensex | Excess |
|---|---|---|---|
| 2000–2004 | 0.00% (cash) | varies | n/a |
| 2005 | +32.4% | +40.6% | -8.2% |
| 2006 | +51.4% | +48.5% | +2.9% |
| 2007 | +83.4% | +46.8% | +36.6% |
| 2008 | -71.7% | -51.3% | -20.4% |
| 2009 | +132.4% | +76.3% | +56.1% |
| 2010 | +13.3% | +17.1% | -3.8% |
| 2011 | -37.6% | -24.5% | -13.0% |
| 2012 | +57.6% | +27.0% | +30.6% |
| 2013 | -8.3% | +6.0% | -14.2% |
| 2014 | +72.5% | +33.5% | +39.0% |
| 2015 | +5.8% | -8.1% | +13.9% |
| 2016 | +6.1% | +3.8% | +2.3% |
| 2017 | +58.2% | +27.1% | +31.0% |
| 2018 | -27.8% | +6.2% | -33.9% |
| 2019 | -3.4% | +16.0% | -19.4% |
| 2020 | +25.2% | +15.7% | +9.4% |
| 2021 | +25.0% | +22.9% | +2.1% |
| 2022 | -1.2% | +3.4% | -4.6% |
| 2023 | +68.4% | +17.5% | +50.8% |
| 2024 | +34.6% | +11.2% | +23.4% |
| 2025 | -5.3% | +1.6% | -6.9% |
Cash in 2000–2004: missed a major Sensex rally
During 2000–2004, the GARP screen found fewer than 10 qualifying Indian companies. NSE didn't have enough mid-to-large cap companies simultaneously showing 15%+ revenue growth, PEG < 1.5, and ROE > 10%. The screen went to cash.
The outcome vs the Sensex was mixed. India's market was volatile in 2000 (-25%) and 2001 (-19%), and cash avoided those falls. But 2003 saw the Sensex surge +79%, and cash missed the entire recovery. The net effect of the 2000–2004 cash periods is a drag on GARP's long-run relative performance.
2005–2007: genuine outperformance
When the signal fired in 2005, it found what it was designed for: fast-growing Indian companies at reasonable valuations. IT services, pharmaceuticals, and infrastructure companies were expanding at 20 to 40% annually with PEG ratios below 1.5. 2007 delivered +83% vs Sensex's +47%, a 37-point gap that reflects real informational edge in a period when systematic factor investing in India was nascent.
2008 and 2009: the crash and recovery
The 2008 crash took India GARP down 71.7% vs the Sensex's 51.3%. Concentrated growth stocks in an emerging market sell off harder. 2009 recovered +132.4% vs Sensex +76.3%, another large positive year. The crash and recovery net out to roughly the same trajectory, but the drawdown was severe.
The volatile middle years
From 2010–2022, the pattern is alternating strong years (2012: +31% excess, 2014: +39%, 2017: +31%) and weak years (2011: -13%, 2013: -14%, 2018: -34%, 2019: -19%). 2018 was the worst miss: GARP -27.8% while the Sensex returned +6.2%, a 34-point gap in a single year. The NBFC crisis froze credit, hitting growth companies hard.
2023 and 2024: the strongest stretch
2023 returned +68.4% vs Sensex +17.5%, and 2024 returned +34.6% vs Sensex +11.2%. These two years built back accumulated underperformance. India's manufacturing buildout, digital economy growth, and improving corporate governance created genuine GARP opportunities. Combined, they added roughly 74 percentage points of excess in two years.
The Honest Assessment
The 0.63% excess vs Sensex over 25 years is thin: positive, but not the kind of edge you'd build a thesis on. There are years where the screen clearly outperforms (2007, 2009, 2014, 2023, 2024) and years where it clearly underperforms (2005, 2008, 2018, 2019, 2025). The net result over 25 years is barely ahead of the index.
The apparent +3.73% excess vs SPY comes from India's stronger economic growth cycle relative to US equities. A simple Sensex index fund would have shown similar "excess" vs SPY. GARP's contribution is the marginal 0.63% above Sensex, real but barely measurable.
What the screen does provide: access to concentrated growth cycles when they appear. The exceptional years (2007, 2009, 2023, 2024) are real and meaningful. But the strategy also suffers concentrated drawdowns when conditions shift, as in 2008, 2011, 2018, and 2019.
For Indian investors, GARP is a reasonable systematic approach to a growth-focused portfolio. Don't expect to beat the Sensex consistently. Expect higher volatility, occasional large outperformance, and a portfolio that requires conviction to hold through the bad years.
Limitations
Currency risk. Returns are in INR. An INR/USD depreciation reduces the USD equivalent of returns. The Sensex comparison avoids this, but international investors face it.
High volatility. 32.2% annualized volatility is 35% higher than the Sensex (23.8%). The -73.42% maximum drawdown is severe. An investor who entered in 2007 and needed to exit in 2009 would have been down 71.7%.
Liquidity. India's mid-cap segment has thinner order books. Transaction costs modeled here are size-tiered but may not fully capture real market impact.
Thin coverage in early years. The 2000–2004 cash periods reflect real data limitations. The 2003 Sensex rally (+79%) was missed entirely. This drag affects the long-run relative return.
Survivorship bias. Profiles use current exchange listings. Indian companies that delisted or failed aren't tracked through failure.
Takeaway
India GARP returns 11.75% over 25 years, barely ahead of the Sensex's 11.12%. The risk-adjusted case is weaker than the index: higher volatility, deeper drawdowns, lower Sharpe. Against SPY, India GARP shows +3.73%, driven by India's growth premium, not GARP-specific alpha.
The screen does find genuine opportunities in specific cycles (2007, 2009, 2014, 2023–2024). The problem is that the years of underperformance (2008, 2011, 2018, 2019) offset those gains over the full period. India is the strongest GARP market globally, but the edge vs the local index is thin.
Part of a Series
This post is part of our GARP global exchange comparison:
- GARP on US Stocks (NYSE + NASDAQ + AMEX). 25 years, underperforms SPY
- GARP on German Stocks (XETRA). Beats the DAX by 4.4% per year, 65% down capture
- GARP: 17-Exchange Global Comparison. Full results across 17 markets
Run This Screen Yourself
Current GARP screen (Indian stocks, TTM data):
WITH latest_income AS (
    SELECT symbol, revenue, dateEpoch,
           ROW_NUMBER() OVER (PARTITION BY symbol ORDER BY dateEpoch DESC) AS rn
    FROM income_statement WHERE period = 'FY' AND revenue > 0
),
rev_growth AS (
    SELECT c.symbol,
           ROUND((c.revenue - p.revenue) / ABS(p.revenue) * 100, 1) AS rev_growth_pct
    FROM latest_income c
    JOIN latest_income p ON c.symbol = p.symbol AND c.rn = 1 AND p.rn = 2
    WHERE p.revenue > 0 AND (c.revenue - p.revenue) / ABS(p.revenue) > 0.15
)
SELECT f.symbol, p.companyName, p.sector,
    ROUND(f.priceToEarningsGrowthRatioTTM, 3) AS peg_ratio,
    ROUND(f.priceToEarningsRatioTTM, 2) AS pe_ratio,
    ROUND(k.returnOnEquityTTM * 100, 1) AS roe_pct,
    ROUND(f.debtToEquityRatioTTM, 2) AS debt_to_equity,
    g.rev_growth_pct,
    ROUND(k.marketCap / 1e9, 2) AS mktcap_b_inr
FROM financial_ratios_ttm f
JOIN key_metrics_ttm k ON f.symbol = k.symbol
JOIN profile p ON f.symbol = p.symbol
JOIN rev_growth g ON f.symbol = g.symbol
WHERE f.priceToEarningsGrowthRatioTTM > 0 AND f.priceToEarningsGrowthRatioTTM < 1.5
  AND f.priceToEarningsRatioTTM > 5 AND f.priceToEarningsRatioTTM < 50
  AND k.returnOnEquityTTM > 0.10
  AND f.debtToEquityRatioTTM >= 0 AND f.debtToEquityRatioTTM < 2.0
  AND k.marketCap > 20000000000
  AND p.exchange IN ('NSE')
QUALIFY ROW_NUMBER() OVER (PARTITION BY f.symbol ORDER BY f.priceToEarningsGrowthRatioTTM ASC) = 1
ORDER BY f.priceToEarningsGrowthRatioTTM ASC LIMIT 30
Run this screen on Ceta Research
The full backtest code (Python + DuckDB) is on GitHub.
References
- Lynch, P. (1989). One Up on Wall Street. Simon & Schuster.
- Bae, K., Stulz, R. & Tan, H. (2008). "Do Local Analysts Know More? A Cross-Country Study of the Performance of Local Analysts and Foreign Analysts." Journal of Financial Economics, 88(3), 581–606.
- Rouwenhorst, K. (1999). "Local Return Factors and Turnover in Emerging Stock Markets." Journal of Finance, 54(4), 1439–1464.
Data: Ceta Research, FMP financial data warehouse. Universe: NSE. Quarterly rebalance, equal weight, transaction costs included, 2000–2025. Returns in INR.
Past performance does not guarantee future results. This is educational content, not investment advice.


