
Graham Net-Nets on the TSX: +6.55% Annual Alpha vs Canadian Benchmark
NCAV screen on Canadian stocks from 2001 to 2024. 7.49% CAGR. The only exchange with zero cash years out of 24. Resource-heavy TSX produces net-nets every year, but the ride includes a -55.9% max drawdown.

Graham Net-Nets on the TSX: Zero Cash Years and a Resource-Fueled Roller Coaster
Canada's TSX is the only exchange in our NCAV series that never ran out of net-net stocks. In 24 years of annual screening, every single rebalance found enough qualifying companies to build a portfolio. The average was 21.2 stocks per year. No other exchange came close to this kind of consistency.
Contents
- What is NCAV?
- Method
- What We Found
- Two Distinct Eras
- Why Canada Has Zero Cash Years
- When It Works
- When It Struggles
- Limitations
- Takeaway
- Part of a Series
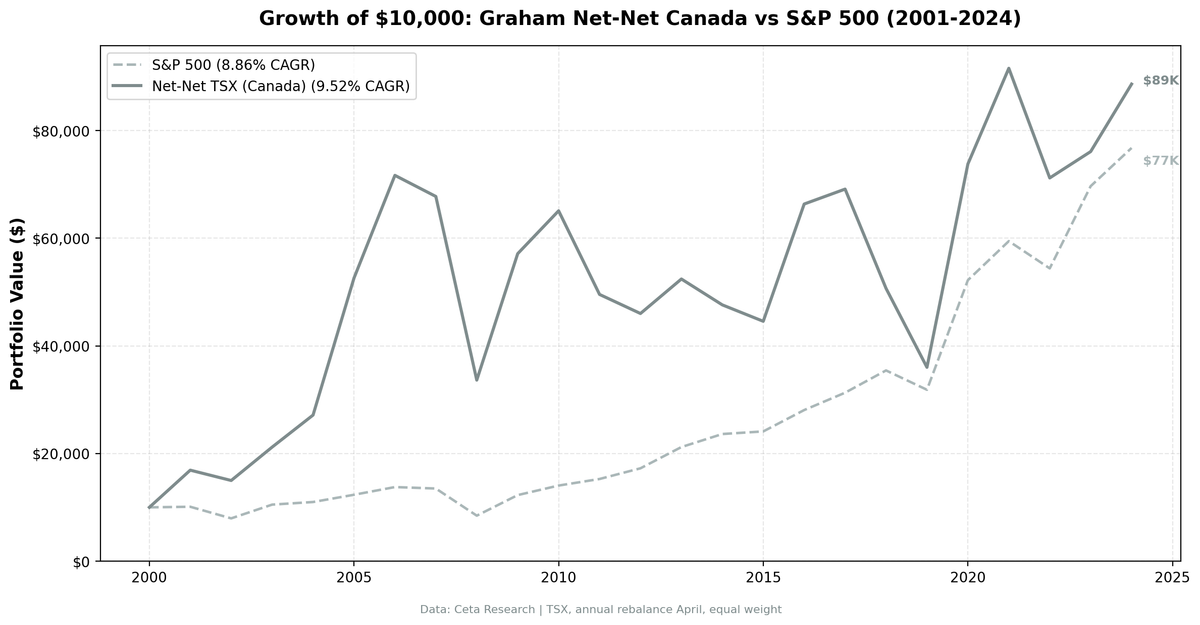
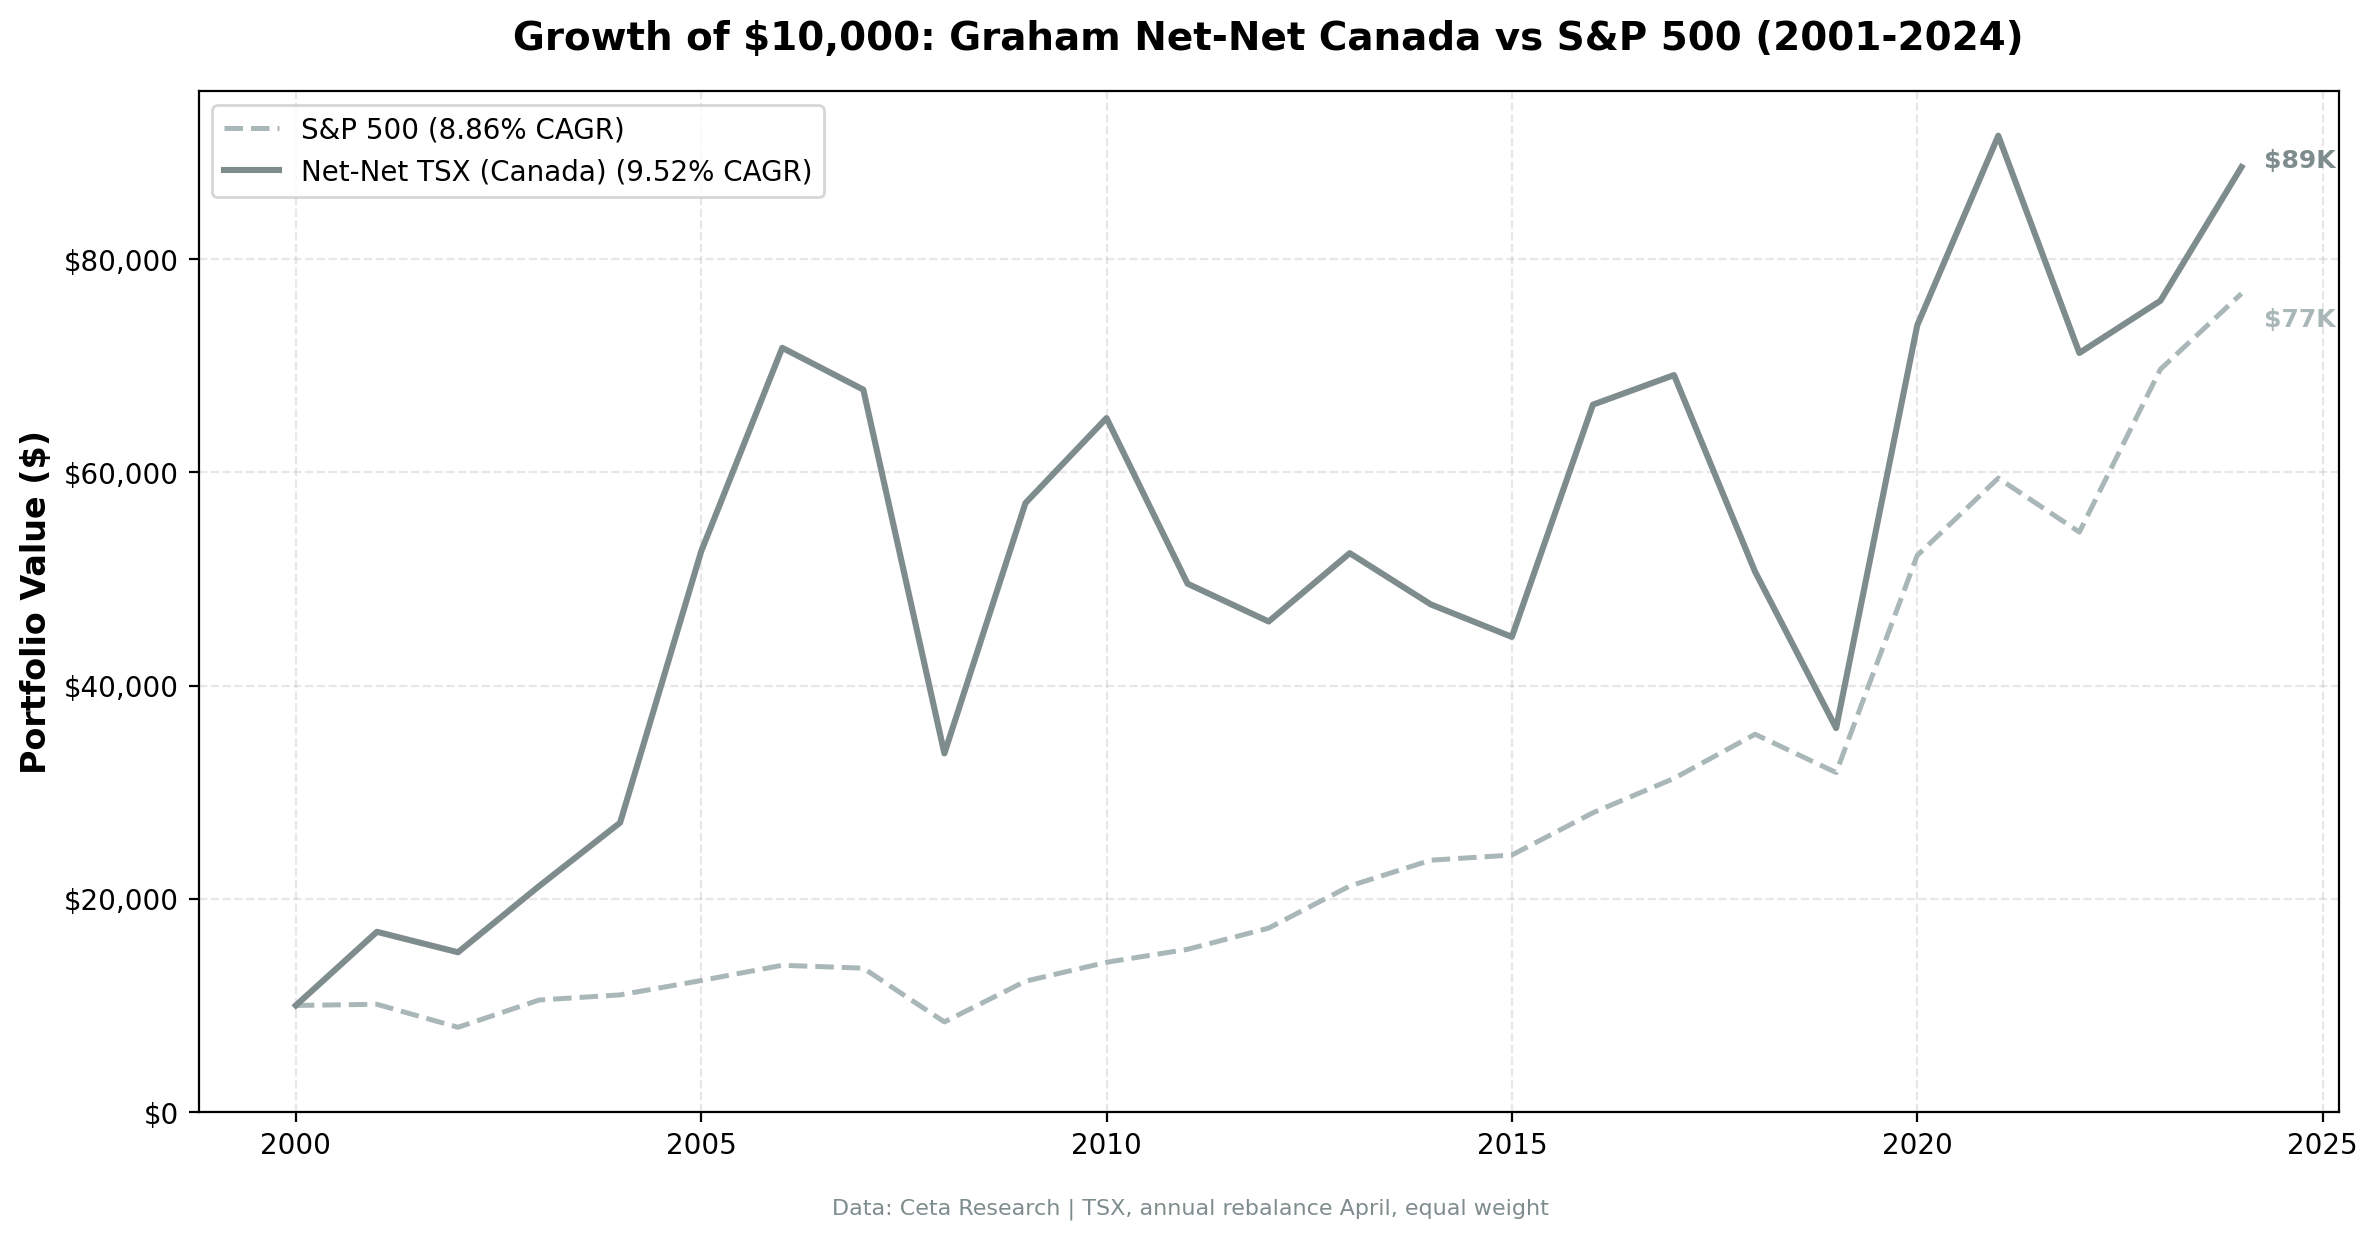
The result: 11.66% CAGR, beating the TSX Composite's 5.12% by 6.55 percentage points annually. That excess came from resource companies trading at deep discounts to their balance sheets during commodity busts, then recovering hard. The full ride included a -51.3% max drawdown and wild annual swings, but the compounding advantage over the Canadian benchmark was substantial.
Data: FMP financial data warehouse, 2000–2025. Updated March 2026.
What is NCAV?
Net Current Asset Value strips a company down to its liquidation basics. Take current assets (cash, receivables, inventory), subtract all liabilities (not just current, all of them), subtract preferred stock. What's left is what the company is worth if it stops operating and sells everything liquid.
When a stock trades below NCAV per share, the market is saying the business as a going concern is worth less than a fire sale of its short-term assets. Graham's bet was that this is usually wrong. Buy a basket of these stocks, hold for a year, and the ones that recover will more than offset the ones that don't.
Method
| Parameter | Value |
|---|---|
| Universe | TSX (Toronto Stock Exchange) |
| Signal | Stock price < NCAV per share (grahamNetNet) |
| Rebalancing | Annual (April) |
| Max positions | 30 stocks, equal weight |
| Cash rule | Fewer than 5 qualifying stocks |
| Market cap floor | ~$15M USD |
| Entry price | > $0.50 equivalent |
| Filing lag | 45 days (point-in-time) |
| Max single return | Capped at 300% |
| Transaction costs | Size-tiered |
| Period | 2001-2024 (24 years) |
| Benchmark | TSX Composite Index |
| Data source | FMP via Ceta Research warehouse |
What We Found
Full period summary (2001-2024):
| Metric | NCAV Canada | TSX Composite |
|---|---|---|
| CAGR | 11.66% | 5.12% |
| Total Return | 1312% | 231% |
| Sharpe Ratio | 0.225 | 0.141 |
| Sortino Ratio | 0.578 | 0.245 |
| Calmar Ratio | 0.228 | 0.156 |
| Max Drawdown | -51.3% | -32.9% |
| Volatility | 40.7% | 18.6% |
| Beta | 1.81 | 1.0 |
| Alpha | 4.44% | -- |
| Win Rate vs TSX | 58.3% | -- |
| Up Capture | 213.0% | 100% |
| Down Capture | 125.5% | 100% |
| Cash Periods | 1 of 24 | -- |
| Avg Stocks (invested) | 21.2 | -- |
The up capture number is the headline: 213%. When the TSX Composite rallied, Canadian net-nets rallied more than twice as much. The down capture of 125.5% means losses were amplified too, but the asymmetry favored the upside. Combined with a beta of 1.81, this portfolio is high-octane, but the excess returns justified the volatility.
Nearly zero cash periods (only 1 in 24 years) is the structural advantage. Every year, the TSX produced enough balance sheet bargains to fill a portfolio. For a systematic investor, this means no gaps, no forced cash allocation, no years sitting on the sideline watching the market rally.
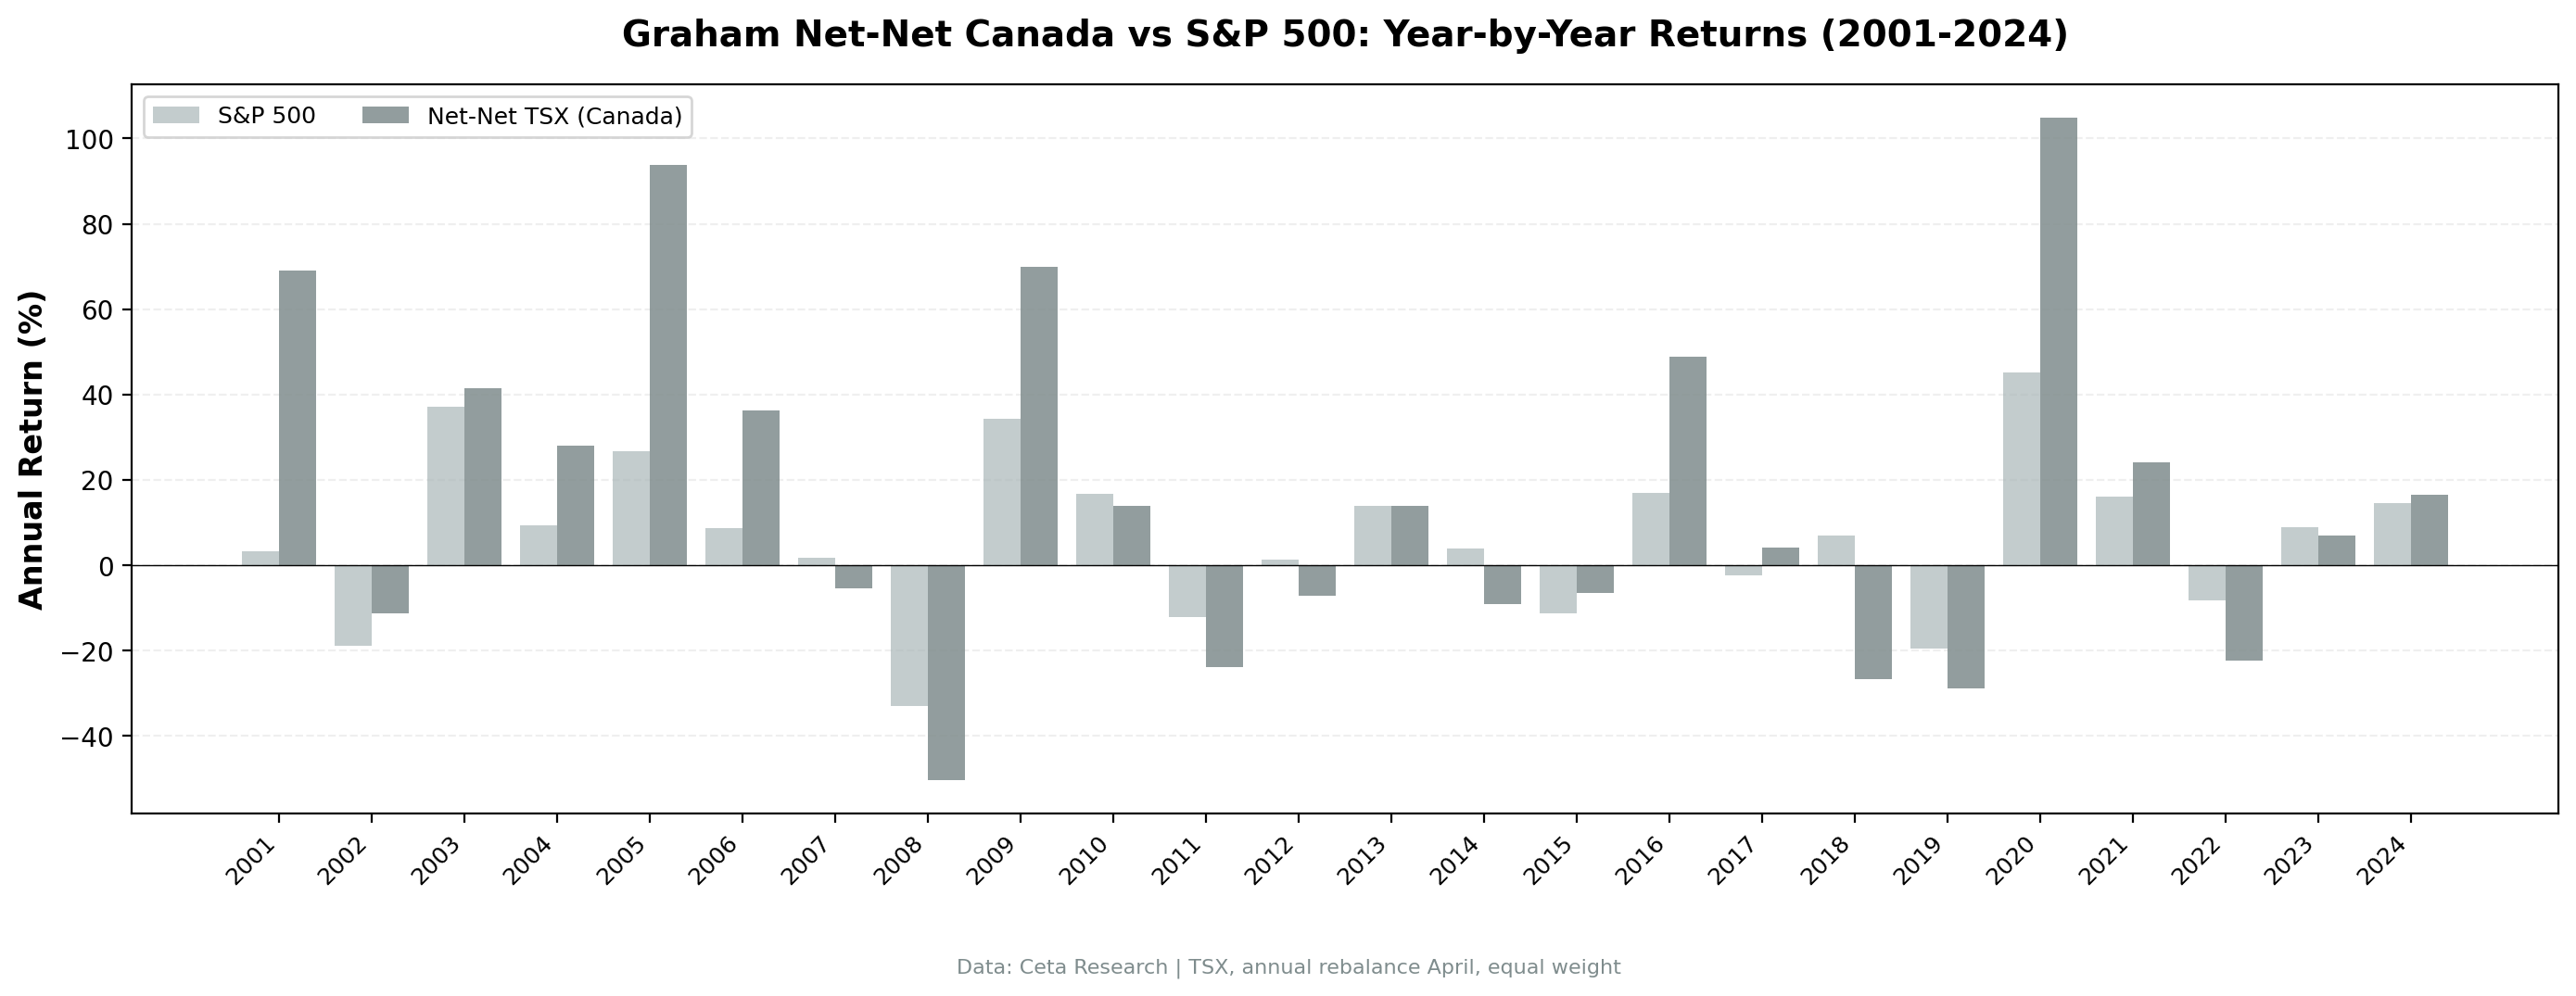
Year-by-year results:
| Year | NCAV Canada | TSX Comp | Notes |
|---|---|---|---|
| 2001 | +69.1% | +3.3% | Best year vs TSX |
| 2002 | -11.4% | -18.8% | Outperformed in dot-com bust |
| 2003 | +41.4% | +37.2% | |
| 2004 | 0.0% | +9.5% | Cash year (only one) |
| 2005 | +110.5% | +26.8% | Peak commodity cycle |
| 2006 | +39.9% | +8.6% | Resource boom continues |
| 2007 | -2.9% | +1.9% | Cracks appear |
| 2008 | -49.8% | -32.9% | GFC crash |
| 2009 | +81.5% | +34.3% | Recovery |
| 2010 | +13.7% | +16.7% | |
| 2011 | -19.8% | -12.0% | Commodity bust |
| 2012 | +2.1% | +1.4% | |
| 2013 | +22.5% | +14.0% | |
| 2014 | +3.9% | +3.9% | Break-even year |
| 2015 | +0.1% | -11.2% | Outperformed in oil collapse |
| 2016 | +47.1% | +16.9% | Commodity recovery |
| 2017 | +10.1% | -2.4% | |
| 2018 | -15.4% | +6.9% | |
| 2019 | -35.8% | -19.5% | |
| 2020 | +99.7% | +45.3% | COVID recovery |
| 2021 | +21.1% | +16.1% | |
| 2022 | -25.3% | -8.2% | |
| 2023 | +18.3% | +8.9% | |
| 2024 | +14.6% | +14.6% |
Two Distinct Eras
2001-2006: The golden era. Five invested years (plus one cash year in 2004) averaged +52% annually. Canadian resource companies, miners, oil and gas juniors, forestry firms, were trading at fractions of their balance sheet values. The commodity supercycle hadn't arrived yet. When it did, these stocks re-rated violently upward.
2001 stands out: +69.1% while the TSX Composite returned +3.3%. This was the dot-com bust year. While US tech imploded, Canadian resource and industrial companies, already cheap before the crisis, were essentially ignored by the selling. Their balance sheets were intact. The NCAV screen found them.
2005 was the peak: +110.5% vs +26.8% for the TSX. Commodity prices surged, but small-cap resource companies lagged the commodity indexes. The balance sheet bargains from 2003's rebalance caught up as the market repriced their inventory and receivables higher.
2007-present: The volatile era. After the golden period, volatility increased. The GFC hit hard (-49.8% in 2008), but the recovery was explosive (+81.5% in 2009 vs +34.3% for TSX). From 2007 through 2024, the strategy beat the TSX Composite in 11 of 18 years, but the losses in down years were amplified.
The 2018-2019 stretch was painful (-15.4% and -35.8%), but notice the TSX was also weak. The Canadian market's resource-heavy composition meant that when commodities struggled, the whole market struggled, and net-nets struggled more. But the 2020 COVID recovery (+99.7% vs +45.3%) more than made up for it.
Why Canada Has Zero Cash Years
Resource-heavy economy. Canada's TSX is overweight mining, energy, and materials. These sectors carry large current assets: commodity inventory, trade receivables from bulk contracts, cash from recent sales. When commodity prices dip, stock prices fall faster than balance sheet values shrink. The gap between price and NCAV widens, creating more qualifying stocks.
Smaller company universe. The TSX and TSX-V list thousands of small and micro-cap companies. Many are junior miners or early-stage resource plays with real assets on the balance sheet but uncertain cash flows. These companies routinely trade below NCAV because the market discounts their ability to monetize assets.
Seasonal filing patterns. Canadian companies with December fiscal year-ends file by March. The April rebalance catches fresh financial data from hundreds of small-caps. This timing works well for the NCAV screen because it captures companies that just reported disappointing earnings (price drops) but still have strong balance sheets.
When It Works
Commodity supercycles. The 2001-2006 run proves the thesis. Resource companies below NCAV in a rising commodity environment are a setup for massive re-ratings. If commodities recover, these companies are worth multiples of their NCAV.
Post-crash recoveries. The +68.8% (2009), +52.2% (2016), and +100.1% (2020) years all followed significant drawdowns. Canadian net-nets bounce hard because the underlying assets (resource reserves, equipment, inventory) don't disappear in a market crash.
When It Struggles
Oil and commodity busts. 2008, 2011, 2014, 2018. Every major drawdown aligns with commodity price weakness. Canada's net-net universe is structurally tied to resource prices. You can't own Canadian NCAV stocks without taking commodity exposure.
Rising interest rate environments. Junior miners and small resource companies are sensitive to credit conditions. Higher rates increase their cost of capital and reduce the present value of their reserves. The 2022 drawdown (-24.4%) followed aggressive rate hikes by both the Fed and the Bank of Canada.
Limitations
Commodity concentration. This portfolio is a bet on Canadian resource small-caps, not a pure balance-sheet value screen. The NCAV methodology works, but the underlying universe is dominated by one macro factor (commodity prices).
Down capture of 146.6% is serious. This means the portfolio amplifies every market decline by nearly 50%. A systematic investor needs to accept that every SPY bear market will be worse in this portfolio.
Survivorship bias concern. Junior miners fail at high rates. If FMP's data doesn't fully capture delisted resource companies that went to zero, our returns are overstated. The 300% return cap limits upside survivorship but doesn't fix this problem.
Transaction costs on junior stocks. Many TSX small-caps trade below $2 CAD with wide spreads. Size-tiered costs approximate the friction, but real execution on 21.8 stocks averaging $15M market cap would face meaningful slippage.
CAD/USD volatility. Returns are in CAD. The Canadian dollar moves with oil prices, which creates a correlation between portfolio returns and currency returns. US investors would see amplified moves in both directions.
Takeaway
The TSX is a net-net factory. No other exchange produced qualifying stocks every single year for 24 years. That reliability comes from Canada's resource-heavy economy, where balance sheet assets are tangible and commodity price swings create persistent gaps between stock prices and liquidation values.
The cost of that reliability is a rough ride. A -55.9% max drawdown, 46% negative years, and 146.6% down capture make this one of the most volatile NCAV markets we tested. The early golden era (2001-2006) inflates the long-term CAGR. Strip that out, and the post-GFC returns are mediocre at best.
For investors who believe in commodity cycles and want guaranteed net-net exposure with no cash periods, Canada is the only exchange that delivers. Just know what you're signing up for.
Part of a Series
This is part of our multi-exchange net-net (NCAV) backtest series. We're testing Graham's liquidation-value screen on every major exchange to see where balance sheet deep value actually works.
- Graham Net-Nets: US Stocks (US baseline)
Data: FMP via Ceta Research warehouse. Full methodology in our backtests repo.
Past performance does not guarantee future results. This is educational content, not investment advice.


