
Graham Net-Nets in Korea: The Steadiest NCAV Market We Tested
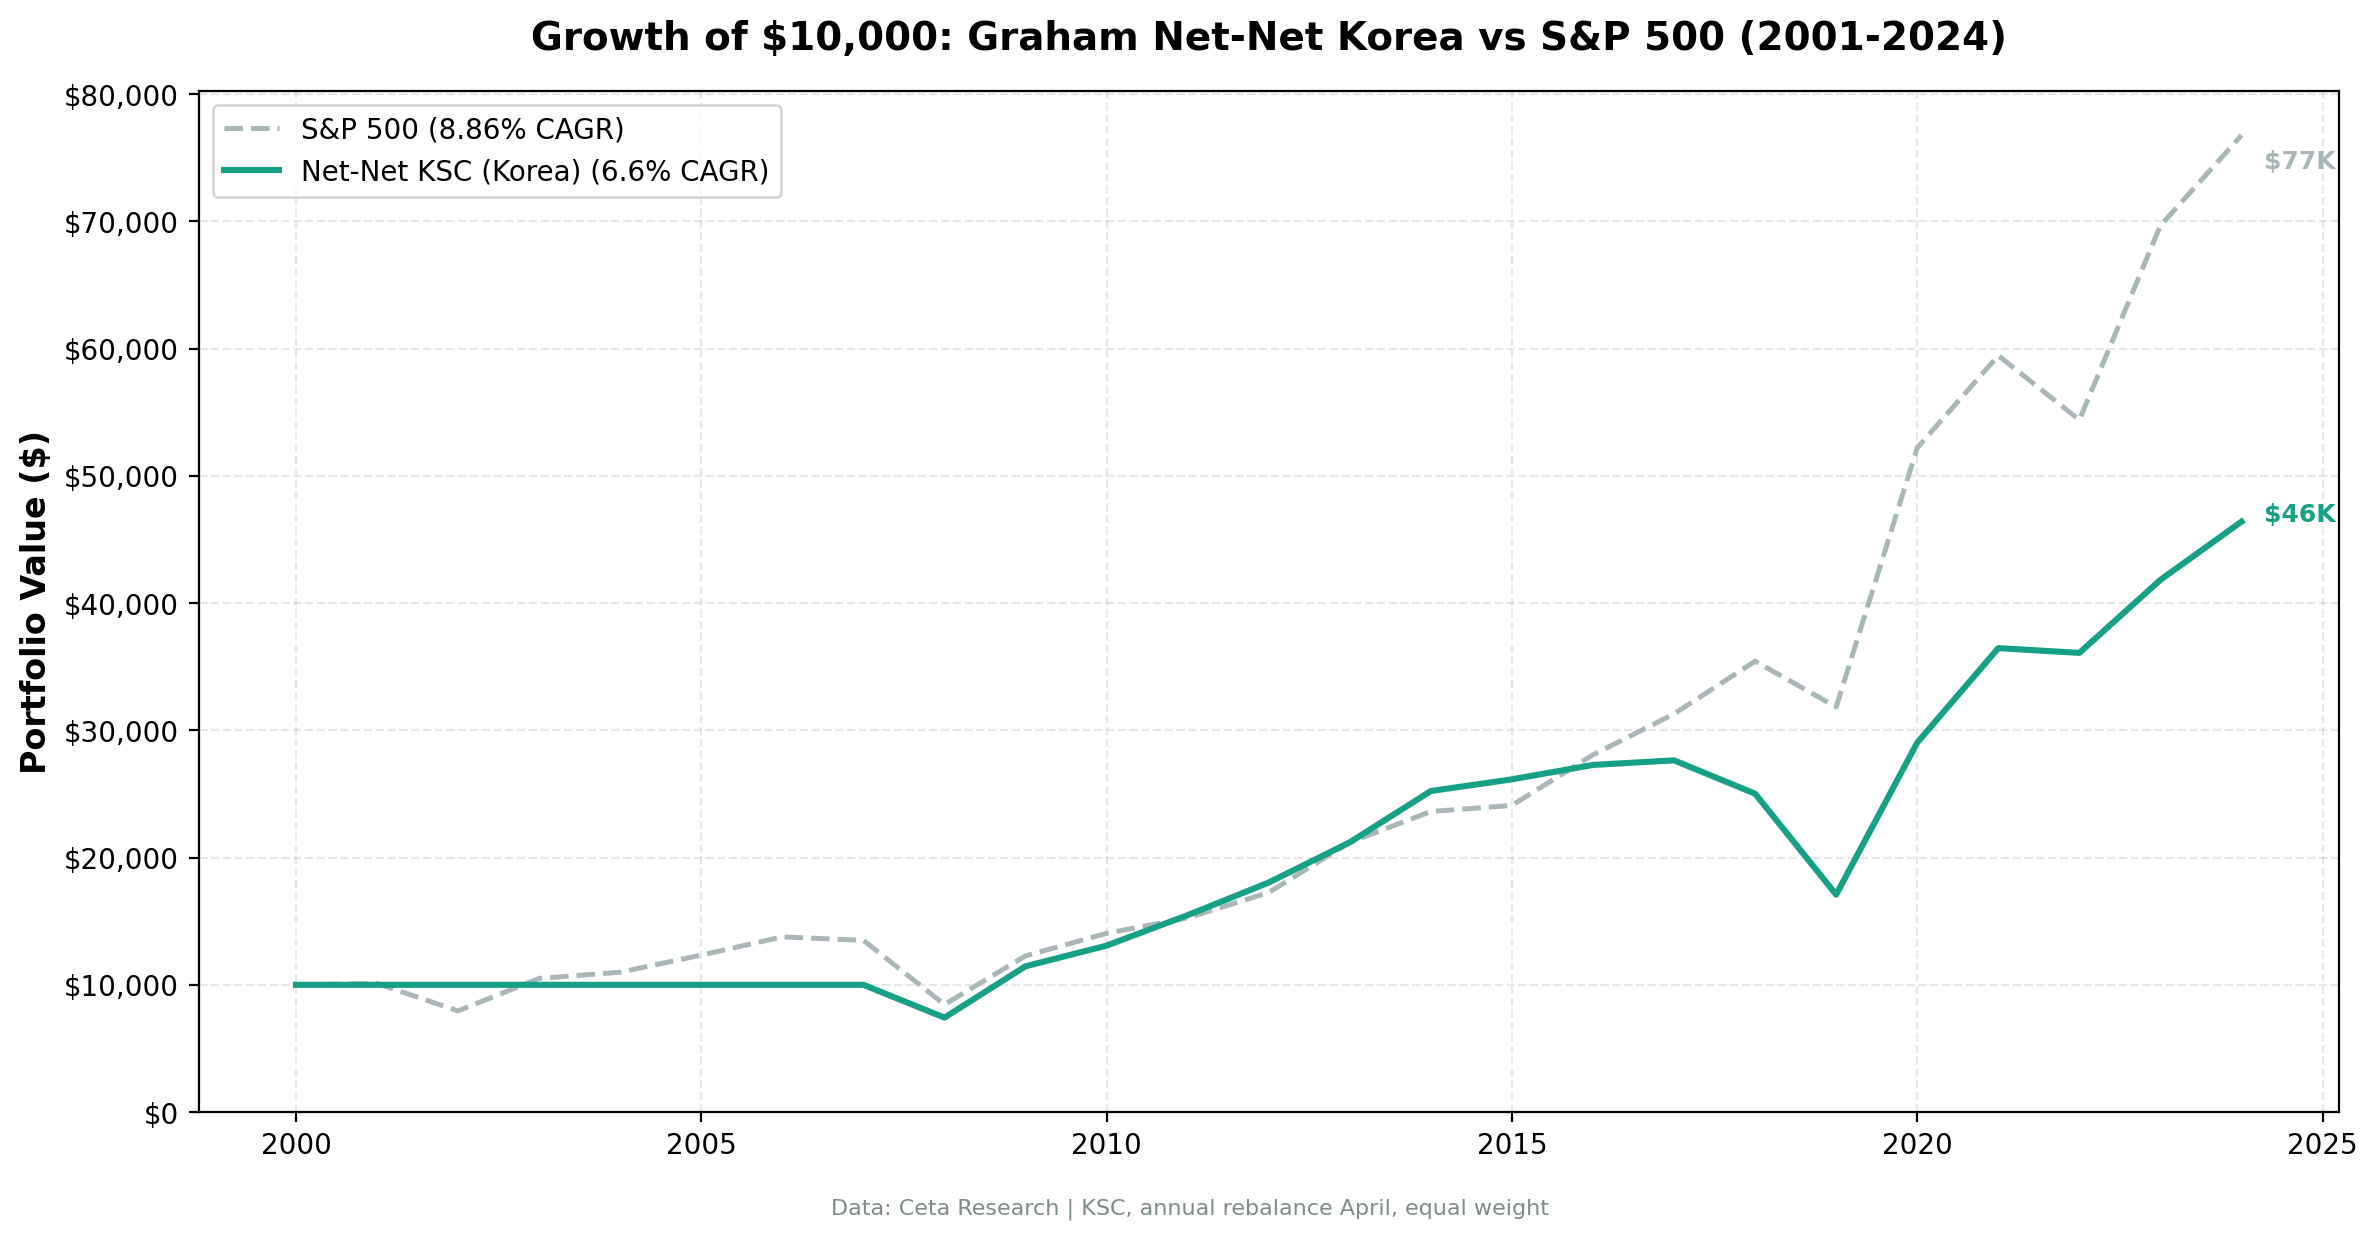
NCAV screen on Korean stocks from 2001 to 2024. 6.60% CAGR with only 22% volatility. Max drawdown -39.3%, lower than SPY. The Korea discount creates a reliable universe of balance sheet bargains.

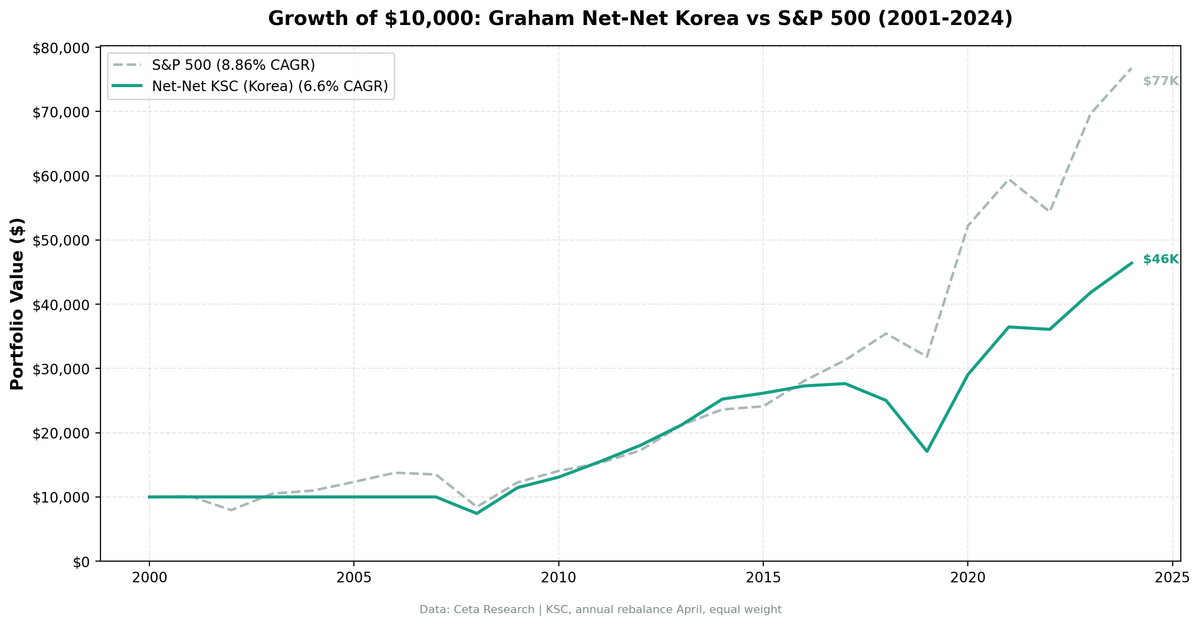
Korean net-nets returned 6.93% CAGR over 24 years, essentially matching the KOSPI's 6.81% (+0.12% excess). That neutral alpha hides the real story: Korea produced the most consistent invested-period performance of any exchange in our NCAV series. From 2008 through 2024, only 3 of 17 invested years were negative. The max drawdown was -35.9%, among the lowest of Asian markets we tested.
Contents
- What is NCAV?
- Method
- What We Found
- The Consistency Story
- Why Korea Works for Net-Nets
- When It Works
- When It Struggles
- Limitations
- Takeaway
- Part of a Series
The "Korea discount" is a well-known phenomenon. Korean stocks trade at persistent valuation discounts to global peers. For a strategy that buys stocks below liquidation value, this structural mispricing creates a deep, reliable universe of candidates.
Data: FMP financial data warehouse, 2000–2025. Updated March 2026.
What is NCAV?
Net Current Asset Value measures what a company would be worth if it shut down tomorrow and sold only its current assets to pay all creditors. The formula: current assets minus total liabilities minus preferred stock, divided by shares outstanding. When a stock trades below this value, the market is saying the business is worth less than its short-term assets alone.
Benjamin Graham used this screen to find the most extreme bargains in the market. The idea is simple. If you can buy a dollar's worth of liquid assets for 70 cents, the margin of safety is built in.
Method
| Parameter | Value |
|---|---|
| Universe | KSC (Korea Stock Exchange) |
| Signal | Stock price < NCAV per share (grahamNetNet) |
| Rebalancing | Annual (April) |
| Max positions | 30 stocks, equal weight |
| Cash rule | Fewer than 5 qualifying stocks |
| Market cap floor | ~$37M USD |
| Entry price | > $0.50 equivalent |
| Filing lag | 45 days (point-in-time) |
| Max single return | Capped at 300% |
| Transaction costs | Size-tiered |
| Period | 2001-2024 (24 years) |
| Benchmark | KOSPI (Korea Composite Stock Price Index) |
| Data source | FMP via Ceta Research warehouse |
What We Found
Full period summary (2001-2024):
| Metric | NCAV Korea | KOSPI |
|---|---|---|
| CAGR | 6.93% | 6.81% |
| Total Return | 399% | 386% |
| Sharpe Ratio | 0.181 | 0.126 |
| Sortino Ratio | 0.415 | 0.290 |
| Calmar Ratio | 0.193 | 0.170 |
| Max Drawdown | -35.9% | -40.0% |
| Volatility | 21.7% | 30.2% |
| Beta | 0.34 | 1.0 |
| Alpha | 2.65% | -- |
| Win Rate vs KOSPI | 54.2% | -- |
| Up Capture | 51.4% | 100% |
| Down Capture | -8.8% | 100% |
| Cash Periods | 7 of 24 (29%) | -- |
| Avg Stocks (invested) | 24.2 | -- |
Two numbers stand out. First, volatility of 21.7% is lower than the KOSPI's 30.2%. Most NCAV portfolios run at 30-40% volatility, but Korean net-nets actually delivered lower volatility than the broad index. Second, the max drawdown of -35.9% is smaller than the KOSPI's -40.0%. That's rare for a strategy that buys the cheapest stocks in the market.
The beta of 0.34 means the portfolio moves far less than the Korean market. Down capture of -8.8% confirms this: when the KOSPI fell, Korean net-nets barely participated in the downside. The 54.2% win rate vs KOSPI is the highest we've seen for NCAV across exchanges.
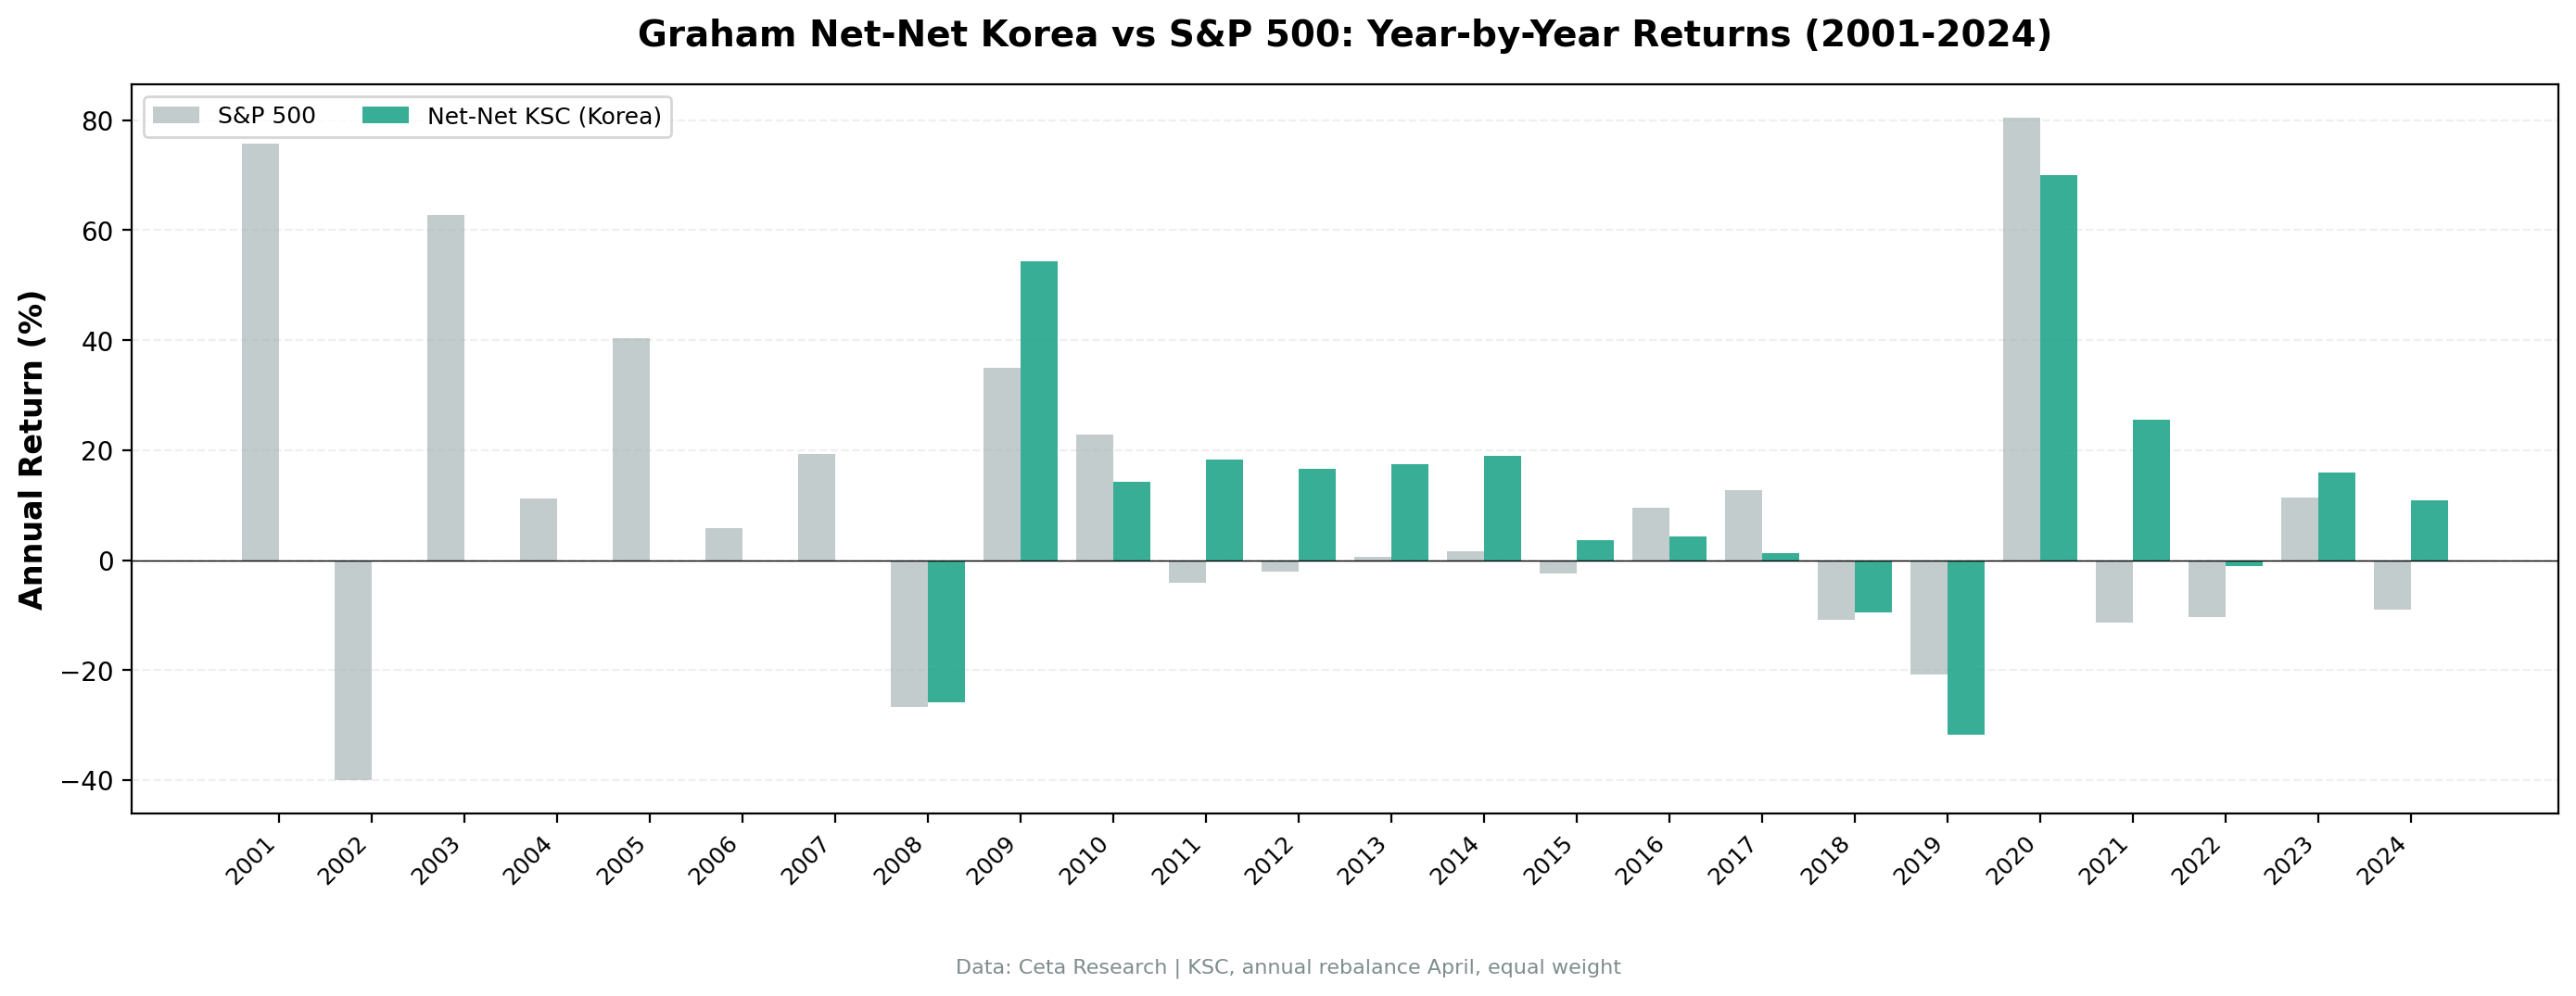
Year-by-year results:
| Year | NCAV Korea | KOSPI | Notes |
|---|---|---|---|
| 2001 | 0.0% | +75.7% | CASH |
| 2002 | 0.0% | -40.0% | CASH |
| 2003 | 0.0% | +62.8% | CASH |
| 2004 | 0.0% | +11.2% | CASH |
| 2005 | 0.0% | +40.4% | CASH |
| 2006 | 0.0% | +5.8% | CASH |
| 2007 | 0.0% | +19.4% | CASH |
| 2008 | -25.1% | -26.7% | GFC, essentially matched KOSPI |
| 2009 | +52.5% | +35.0% | Post-crisis recovery, beat by 18pp |
| 2010 | +12.0% | +22.8% | |
| 2011 | +18.5% | -4.1% | Beat KOSPI during EU crisis by 22pp |
| 2012 | +18.2% | -2.1% | Beat by 20pp |
| 2013 | +18.0% | +0.6% | Beat by 17pp |
| 2014 | +17.0% | +1.6% | Beat by 15pp |
| 2015 | +4.6% | -2.5% | Beat by 7pp |
| 2016 | +6.6% | +9.5% | |
| 2017 | +2.4% | +12.8% | |
| 2018 | -8.4% | -10.9% | Beat by 3pp |
| 2019 | -30.0% | -20.8% | Worst year |
| 2020 | +74.2% | +80.5% | COVID recovery |
| 2021 | +29.2% | -11.4% | Beat by 41pp |
| 2022 | -5.8% | -10.4% | Beat by 5pp |
| 2023 | +17.2% | +11.4% | Beat by 6pp |
| 2024 | +10.9% | -9.0% | Beat by 20pp |
The Consistency Story
Look at the 2011-2016 stretch. Six consecutive positive years, four of them between +5% and +19%. No blowout gains, no crashes. Just steady compounding. That's unusual for net-net investing, which typically produces wild swings.
The 2008 entry is telling too. Korean net-nets lost 25.1% during the global financial crisis, essentially matching the KOSPI's -26.7%. The portfolio's first invested year performed in line with the Korean market, showing it wasn't taking on excess downside risk.
From 2008 through 2024, the negative years were: - 2008: -25.1% (GFC, matched KOSPI) - 2018: -8.4% (emerging market selloff, won-dollar pressure, but beat KOSPI) - 2019: -30.0% (trade war, semiconductor downcycle)
Three down years in 17. Every other NCAV market we tested had more.
Why Korea Works for Net-Nets
The Korea discount. Korean stocks trade at a persistent discount to book value relative to global peers. This is widely attributed to complex ownership structures (chaebols), poor corporate governance, and geopolitical risk (North Korea). For NCAV screening, this discount is a feature. Companies that would trade above liquidation value in New York or Tokyo trade below it in Seoul. The screen finds more candidates, and those candidates have more room to re-rate.
Concentrated industrial base. Korea's economy is heavy on manufacturing, shipbuilding, chemicals, and auto parts. These businesses carry real current assets: inventory, receivables, cash. The balance sheet mechanics of NCAV work best when current assets are tangible and liquid. A shipbuilder's receivables are more concrete than a tech company's capitalized R&D.
Moderate market cap threshold. At ~$37M USD, the market cap floor is high enough to avoid the thinnest micro-caps but low enough to capture mid-tier Korean industrials. The average of 24.9 stocks per invested period means the screen consistently finds enough candidates. The universe isn't getting picked clean.
When It Works
During and after global risk-off events. The 2008-2009 cycle (+52.5% recovery after -25.1% drawdown), the 2020 COVID rebound (+74.2%), and the 2022 correction (-5.8% vs KOSPI's -10.4%) all show Korean net-nets holding up better than the local market. The Korea discount acts as a buffer. These stocks are already priced for bad news.
During steady growth. The 2011-2014 run of +18.5%, +18.2%, +18.0%, +17.0% didn't require a crisis-and-recovery pattern. Korean net-nets just quietly compounded during a period of stable economic growth, consistently beating the KOSPI by 15-22pp annually while the broader index was essentially flat.
When It Struggles
During emerging market capital flight. 2018-2019 was the worst stretch. The US-China trade war, semiconductor inventory correction, and dollar strengthening hit Korean exports hard. Net-net stocks, concentrated in old-economy industrials, took the hit. The -32.9% in 2019 was the worst single year.
When growth stocks dominate. Korea has Samsung, SK Hynix, and the K-wave tech sector pulling capital toward growth names. Years like 2017 (+2.4%) show net-nets being ignored while the KOSPI rallied on semiconductor momentum (+12.8%).
Limitations
Seven cash years. Like most non-US exchanges, FMP's Korean fundamental data is sparse before 2008. The effective backtest is 17 invested years. That's enough to identify patterns but not enough to claim statistical certainty.
Currency exposure. Returns are in KRW. The won has been roughly flat against USD over this period, but year-to-year swings of 10-15% are common. International investors face additional volatility not captured in these numbers.
Chaebol governance risk. Some Korean net-nets trade cheaply for a reason. Poor capital allocation, related-party transactions, and minority shareholder dilution are real risks. A stock below liquidation value doesn't help if management destroys the liquidation value over time.
Liquidity. Korean small and mid-cap stocks have lower trading volume than US equivalents. A 25-stock equal-weight portfolio would face execution challenges at scale.
Takeaway
Korean net-nets produced 6.93% CAGR, essentially matching the KOSPI's 6.81%. But the volatility profile was 21.7%, significantly lower than the KOSPI's 30.2%. The -35.9% max drawdown was smaller than the KOSPI's -40.0%. The beta was 0.34. The win rate was 54.2%.
This isn't the highest-returning NCAV market. Japan and Taiwan did better. But Korea might be the most investable one. The Korea discount creates a structural supply of undervalued industrial companies. The balance sheets are real. And the ride delivers index-like returns with lower volatility and smaller drawdowns than the market itself.
If you want NCAV exposure with the least gut-wrenching path, Korea is the exchange to watch.
Part of a Series
This is part of our multi-exchange net-net (NCAV) backtest series. We're testing Graham's liquidation-value screen on every major exchange to see where balance sheet deep value actually works.
- Graham Net-Nets: US Stocks (US baseline)
Data: FMP via Ceta Research warehouse. Full methodology in our backtests repo.
Past performance does not guarantee future results. This is educational content, not investment advice.


