
High Dividend Yield Screen on German Stocks: 7.65% CAGR (XETRA Backtest)
We backtested a high dividend yield screen with quality filters on German stocks (XETRA) from 2000-2025. 7.65% CAGR with +3.20% annual excess vs the DAX, +4.22% Jensen alpha, 0.360 Sharpe.

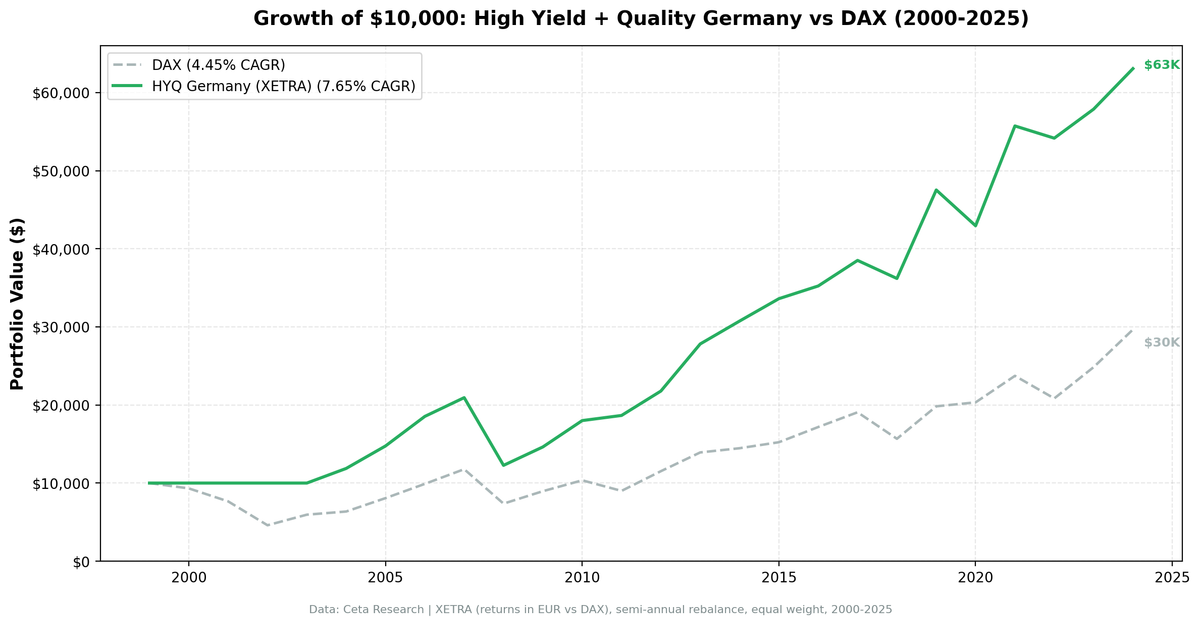
We ran the same high dividend yield quality screen on German stocks (XETRA) from 2000 to 2025. The result: 7.65% CAGR with +3.20% annual excess return over the DAX, and +4.22% Jensen's alpha after adjusting for beta. Germany has a deep corporate culture of dividend payments, and the quality filters work consistently here. Only 4 cash periods in 25 years.
Contents
Data: FMP financial data warehouse, 2000-2025. Updated May 2026.
Method
Data source: Ceta Research (FMP financial data) Universe: XETRA-listed stocks with market cap > 500M EUR (~$545M USD) Period: 2000-2025 (25 years) Rebalancing: Annual (July) Execution: Next-day close (MOC) Benchmark: DAX (^GDAXI)
Same signal as the US analysis: dividend yield 4-15%, payout 0-80%, FCF > 0, ROE > 8%, D/E < 2.0. Top 30 by yield, equal weight.
Results
| Metric | Strategy | DAX |
|---|---|---|
| CAGR | 7.65% | 4.45% |
| Total Return | 531% | -- |
| Max Drawdown | -41.41% | -54.00% |
| Sharpe Ratio | 0.360 | 0.123 |
| Sortino Ratio | 0.613 | -- |
| Win Rate (vs DAX) | 56% | -- |
| Up Capture | 87.5% | -- |
| Down Capture | 32.1% | -- |
| Beta | 0.581 | -- |
| Alpha (Jensen) | +4.22% | -- |
| Cash Periods | 4/25 (16%) | -- |
| Avg Stocks | 18.4 | -- |
Germany delivered a 0.360 Sharpe vs the DAX's 0.123, nearly tripling the risk-adjusted return. The +4.22% Jensen's alpha shows the strategy generated meaningful excess above what its 0.581 beta to the DAX would predict. The 87.5% up capture / 32.1% down capture profile is the classic defensive-with-upside pattern: most of the gains, much less of the losses.
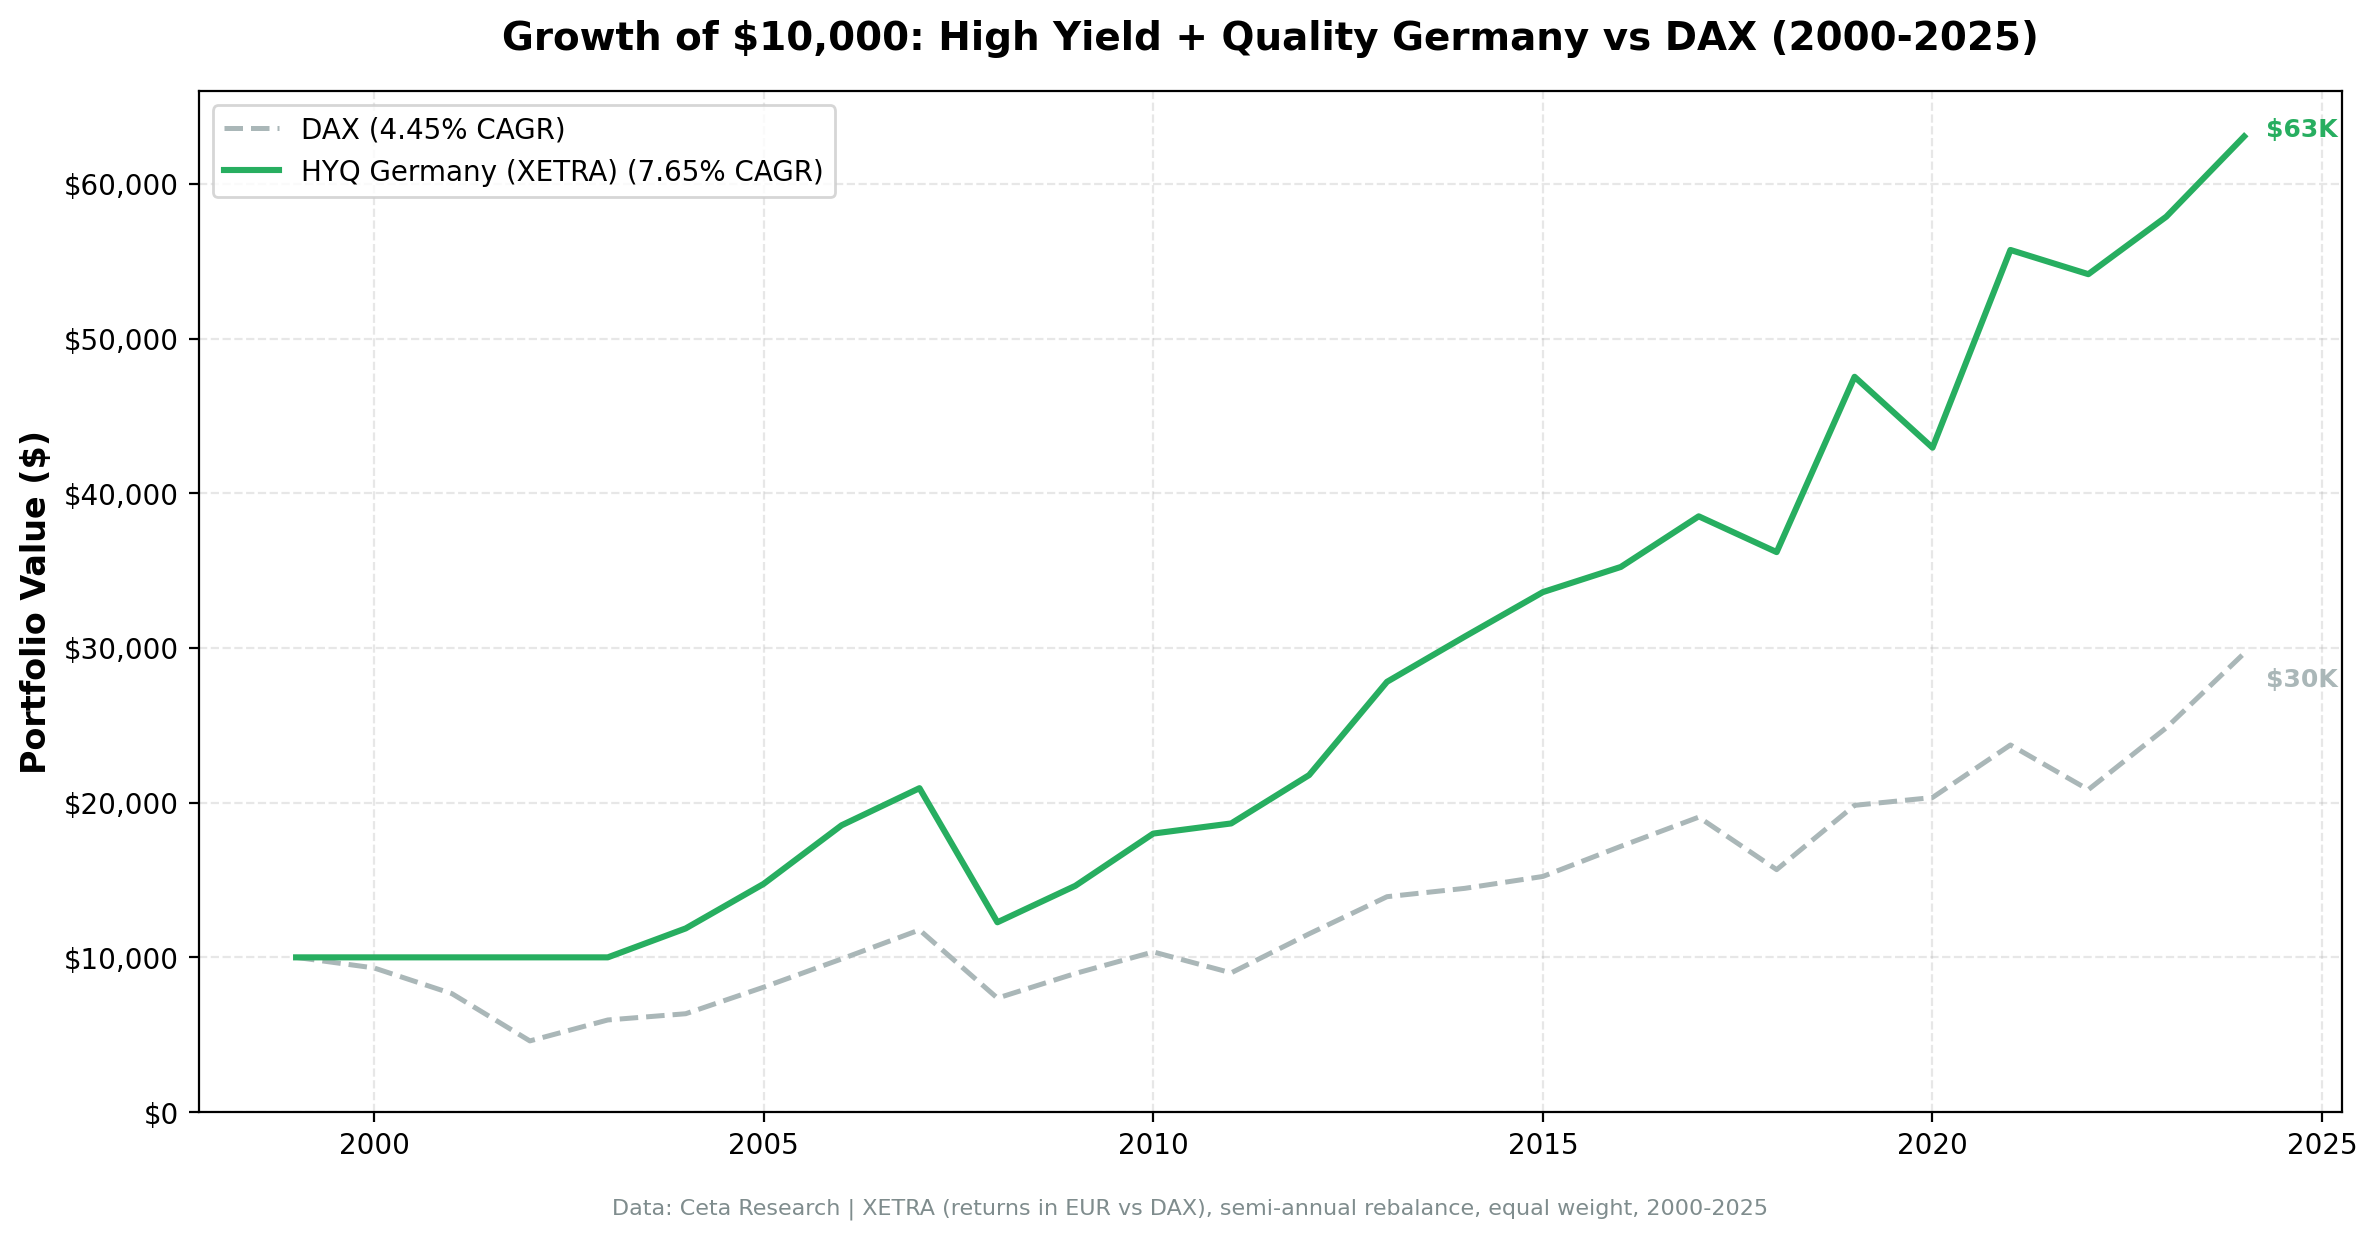
The strategy turned $10,000 into roughly $63,100 over 25 years, more than tripling what holding the DAX would have produced.
Annual Returns
| Year | Strategy | DAX | Excess |
|---|---|---|---|
| 2000 | 0.0% (cash) | -6.8% | +6.8% |
| 2001 | 0.0% (cash) | -17.8% | +17.8% |
| 2002 | 0.0% (cash) | -39.9% | +39.9% |
| 2003 | 0.0% (cash) | +29.4% | -29.4% |
| 2004 | +18.7% | +6.8% | +11.9% |
| 2005 | +24.2% | +27.0% | -2.7% |
| 2006 | +25.7% | +22.6% | +3.1% |
| 2007 | +12.9% | +19.0% | -6.0% |
| 2008 | -41.4% | -37.4% | -4.0% |
| 2009 | +19.2% | +21.6% | -2.4% |
| 2010 | +23.1% | +15.6% | +7.5% |
| 2011 | +3.6% | -13.1% | +16.7% |
| 2012 | +16.8% | +28.0% | -11.3% |
| 2013 | +27.7% | +20.8% | +6.8% |
| 2014 | +10.5% | +3.9% | +6.7% |
| 2015 | +9.3% | +5.3% | +4.0% |
| 2016 | +4.8% | +12.8% | -8.0% |
| 2017 | +9.3% | +11.0% | -1.7% |
| 2018 | -6.0% | -17.8% | +11.8% |
| 2019 | +31.3% | +26.5% | +4.8% |
| 2020 | -9.6% | +2.5% | -12.2% |
| 2021 | +29.8% | +16.7% | +13.1% |
| 2022 | -2.8% | -12.2% | +9.4% |
| 2023 | +6.9% | +19.2% | -12.3% |
| 2024 | +9.0% | +19.4% | -10.4% |
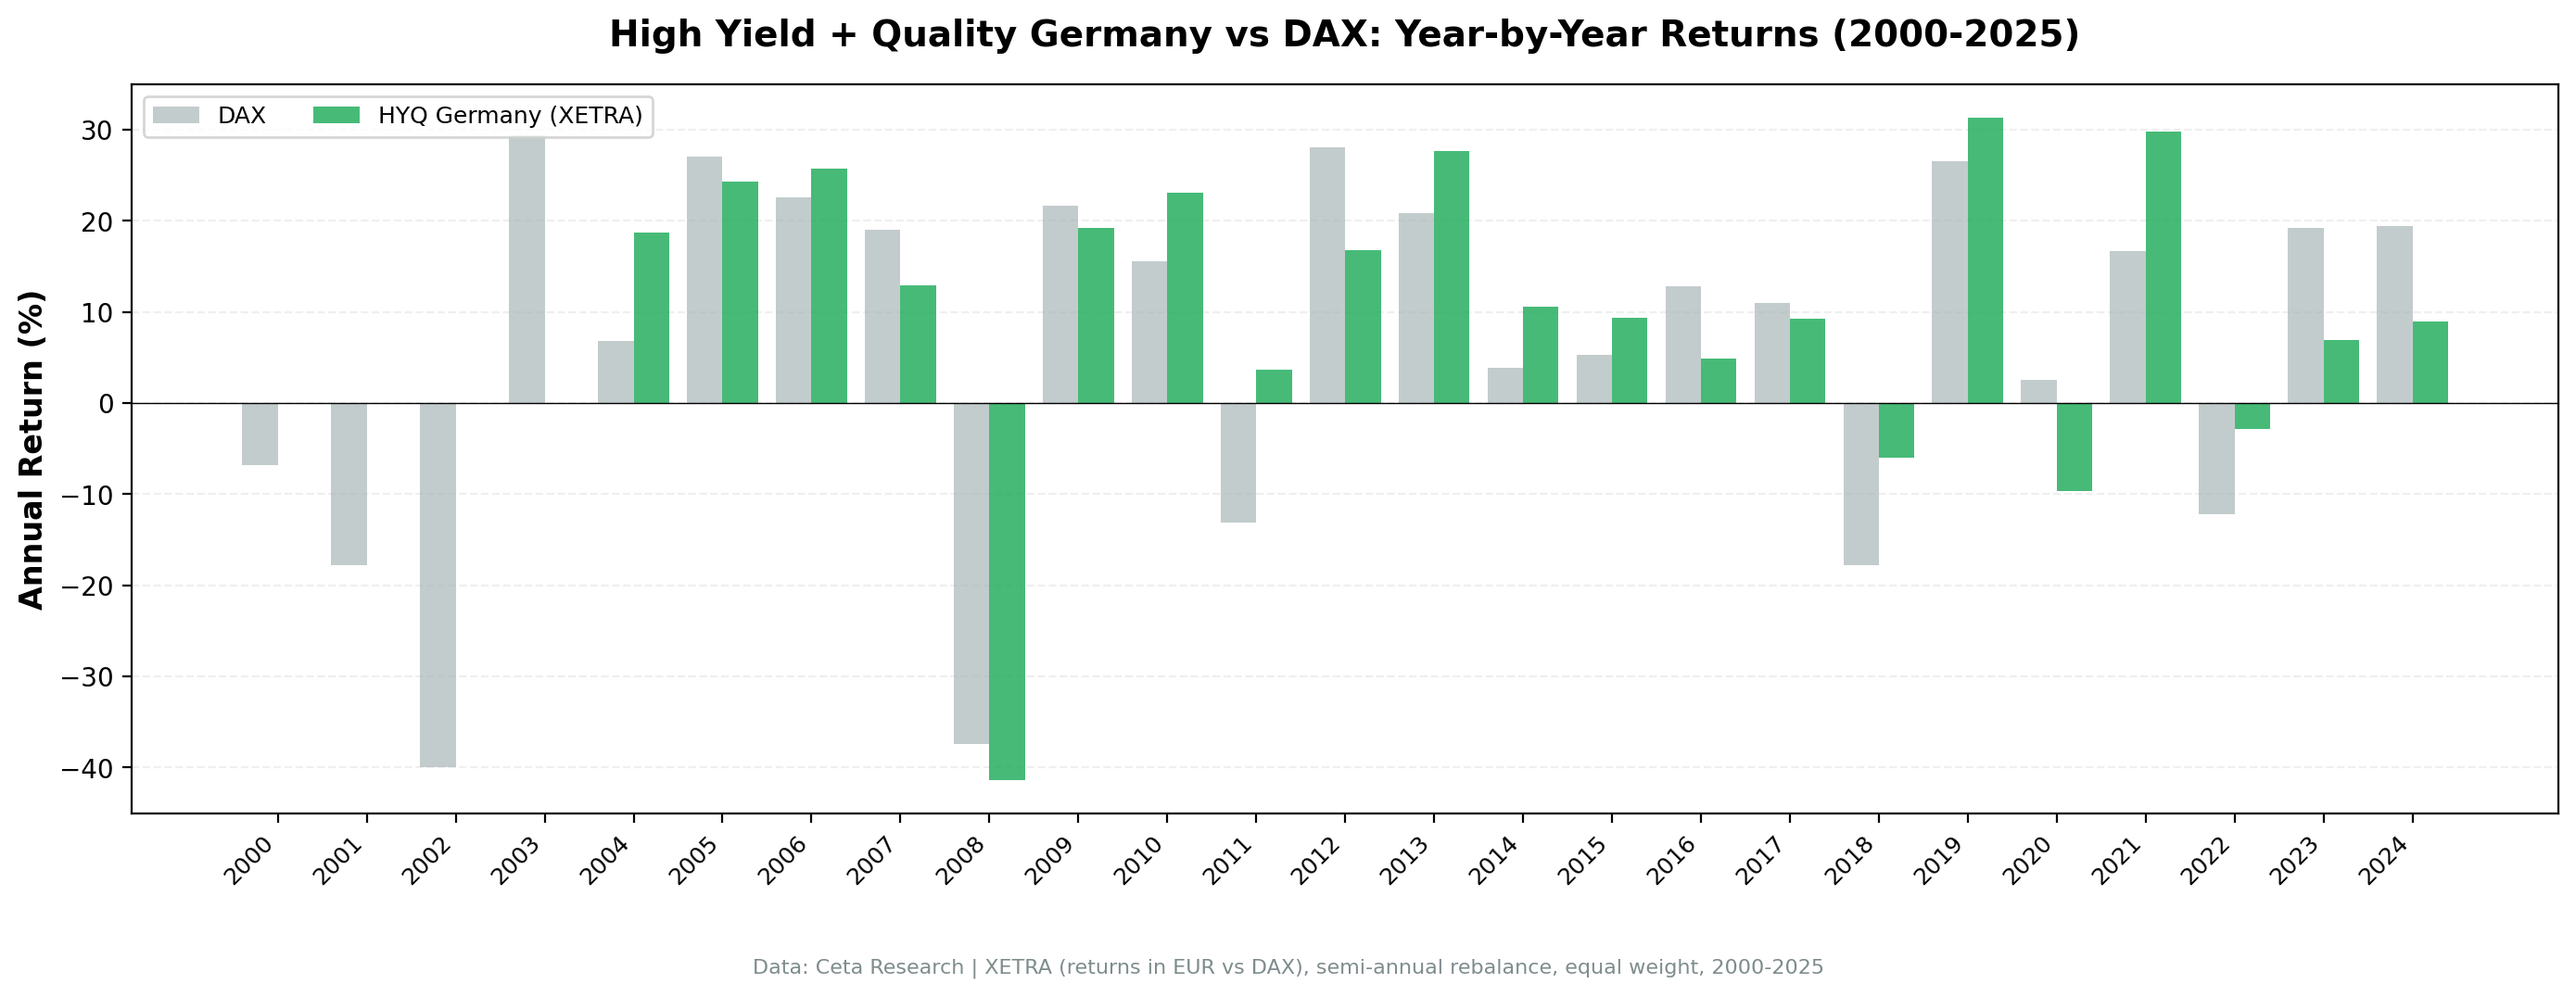
When It Works
2011 (eurozone crisis): +3.6% while the DAX dropped -13.1%. Dividend quality names held up during the sovereign debt scare. 16.7-point excess.
2018 (trade war): -6.0% vs DAX -17.8%. Quality filters kept the worst-hit cyclicals out.
2021 (post-COVID recovery): +29.8% vs +16.7%. Quality dividend payers bounced harder than the index.
2022 (inflation/rate shock): -2.8% vs DAX -12.2%. The strategy's defensive tilt avoided most of the year's damage.
Pattern: the strategy works best during eurozone stress periods, when quality filters earn their keep by avoiding distressed names.
When It Struggles
Pre-2004 cash drag: No qualifying stocks passed all filters from 2000-2003. The DAX returned +29.4% in 2003 while the strategy sat in cash. That's the biggest single-period miss.
2008 (financial crisis): -41.4% vs DAX -37.4%. Worse than the index. Quality filters didn't fully protect against the broad-based crash.
2012: +16.8%, but the DAX surged +28.0%. In strong bull years, the conservative screen lags.
2020 (COVID year): -9.6% while the DAX gained +2.5%. The pandemic year's growth/tech rebound bypassed traditional dividend payers.
2023-2024: Two consecutive underperformance years (-12.3pp, -10.4pp). Growth and tech-adjacent names drove the DAX while traditional dividend payers lagged.
Limitations
Currency: Returns are in EUR-denominated local terms. EUR/USD moves affect cross-market comparisons. A weakening EUR during 2022-2023 means USD-equivalent returns were lower.
Export sensitivity: German dividend payers are often export-heavy industrials (auto, chemicals, machinery). Global trade disruptions hit them harder than domestic-focused companies.
Pre-2004 cash drag: Four years of cash holdings before the signal first qualified stocks at the required threshold. The CAGR figure reflects those flat years.
Data: Ceta Research (FMP financial data warehouse). Universe: XETRA, market cap > 500M EUR. Backtest: 2000-2025, annual July rebalance, next-day close execution (MOC). Past performance does not guarantee future results.
Part of a Series
This is the Germany analysis. See also: - High Yield Quality on US Stocks - 10.52% CAGR, full methodology - High Yield Quality Across Global Exchanges - full comparison
References
- Fama, E. & French, K. (1998). "Value versus Growth: The International Evidence." Journal of Finance, 53(6), 1975-1999.


