
High Dividend Yield Screen on Hong Kong Stocks: 8.97% CAGR (HKSE Backtest)
We backtested a high dividend yield screen with quality filters on Hong Kong stocks (HKSE) from 2000-2025. 8.97% CAGR with +8.48% annual excess over Hang Seng, the strongest outperformance of any exchange tested.

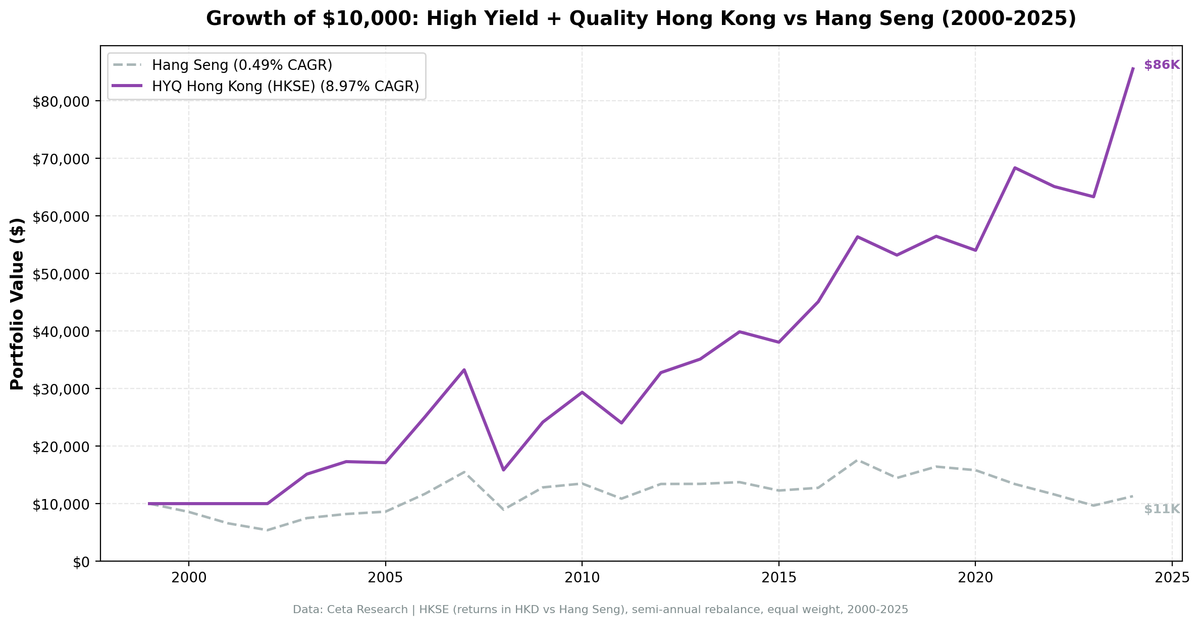
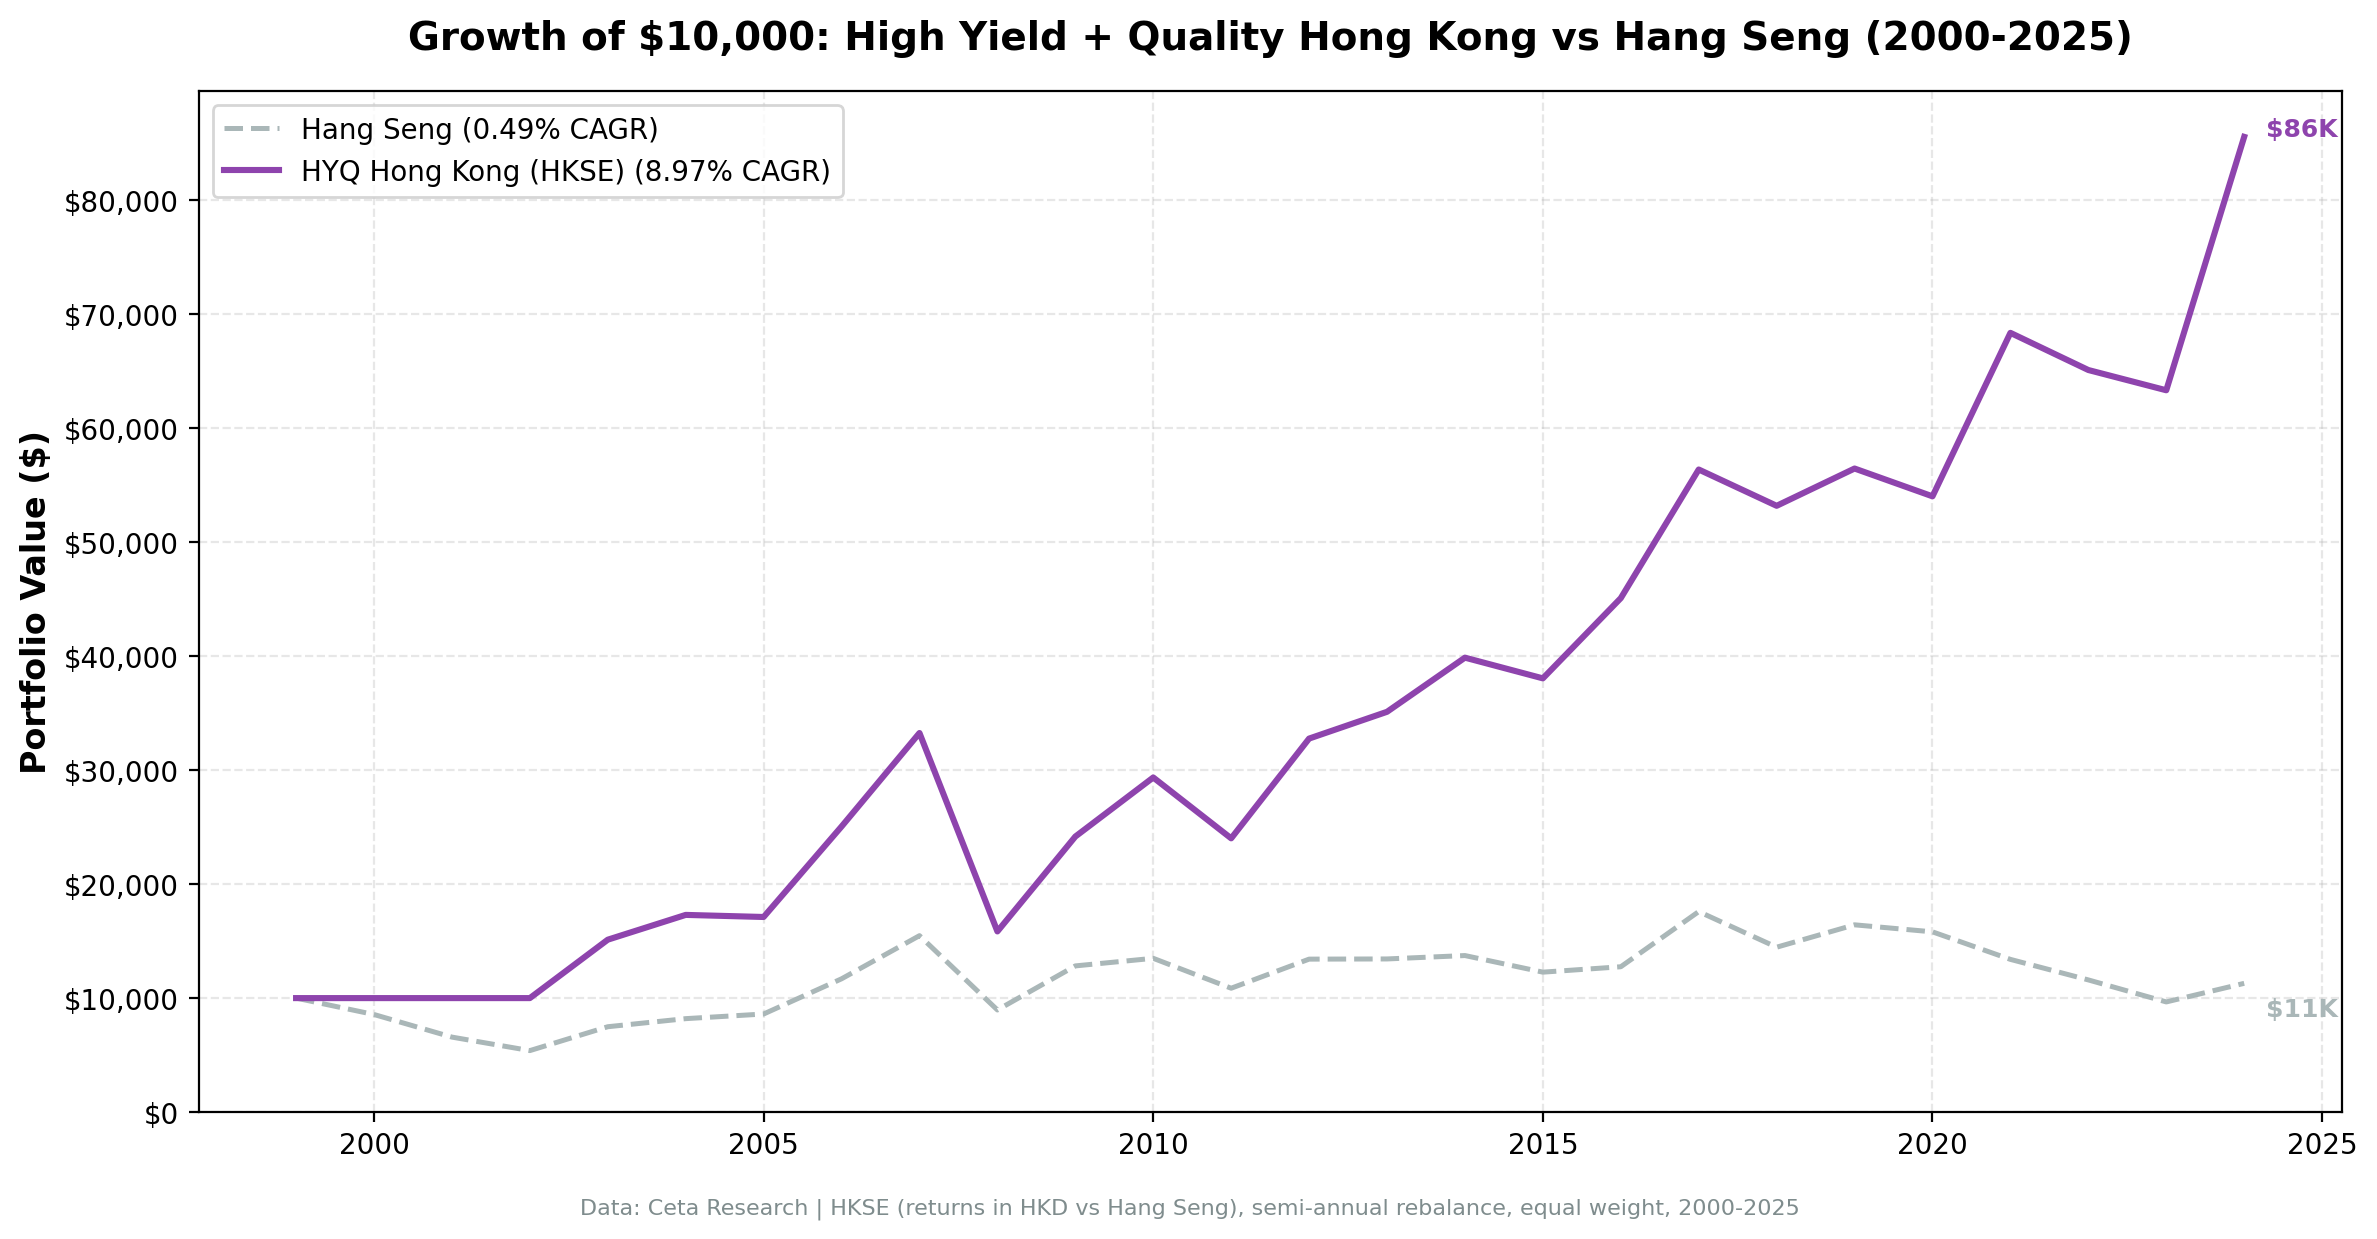
We ran the same high dividend yield quality screen on Hong Kong stocks (HKSE) from 2000 to 2025. The result: 8.97% CAGR with +8.48% annual excess over the Hang Seng. That's the strongest outperformance of any exchange we tested. Hong Kong's dividend market is deep (21.6 avg stocks) and the strategy beat the Hang Seng in 80% of years.
Contents
- Method
- Results
- Annual Returns
- When It Works
- When It Struggles
- Hong Kong's Dividend Culture
- Limitations
- Part of a Series
- References
Data: FMP financial data warehouse, 2000-2025. Updated May 2026.
Method
Data source: Ceta Research (FMP financial data) Universe: HKSE-listed stocks with market cap > 2B HKD (~$256M USD) Period: 2000-2025 (25 years) Rebalancing: Annual (July) Execution: Next-day close (MOC) Benchmark: Hang Seng (^HSI)
Same signal as the US analysis: dividend yield 4-15%, payout 0-80%, FCF > 0, ROE > 8%, D/E < 2.0. Top 30 by yield, equal weight.
Results
| Metric | Strategy | Hang Seng |
|---|---|---|
| CAGR | 8.97% | 0.49% |
| Total Return | 756% | -- |
| Max Drawdown | -52.35% | -46.08% |
| Sharpe Ratio | 0.251 | -0.110 |
| Sortino Ratio | 0.482 | -- |
| Win Rate (vs Hang Seng) | 80% | -- |
| Up Capture | 134.2% | -- |
| Down Capture | 33.9% | -- |
| Beta | 0.912 | -- |
| Alpha (Jensen) | +8.26% | -- |
| Cash Periods | 3/25 (12%) | -- |
| Avg Stocks | 21.6 | -- |
The strategy beat the Hang Seng in 80% of years. The Jensen's alpha of +8.26% is by far the largest in our global study: the strategy generated 8 percentage points of annual returns above what its beta to Hang Seng would predict. Up capture of 134% and down capture of 34% means the portfolio amplified gains and absorbed only a third of the losses.
The Hang Seng itself returned just 0.49% annualized over 25 years, making the comparison favorable. But the absolute 8.97% return is strong on its own, and the +8.48% excess is consistent across regimes (80% win rate is the highest of any exchange tested).
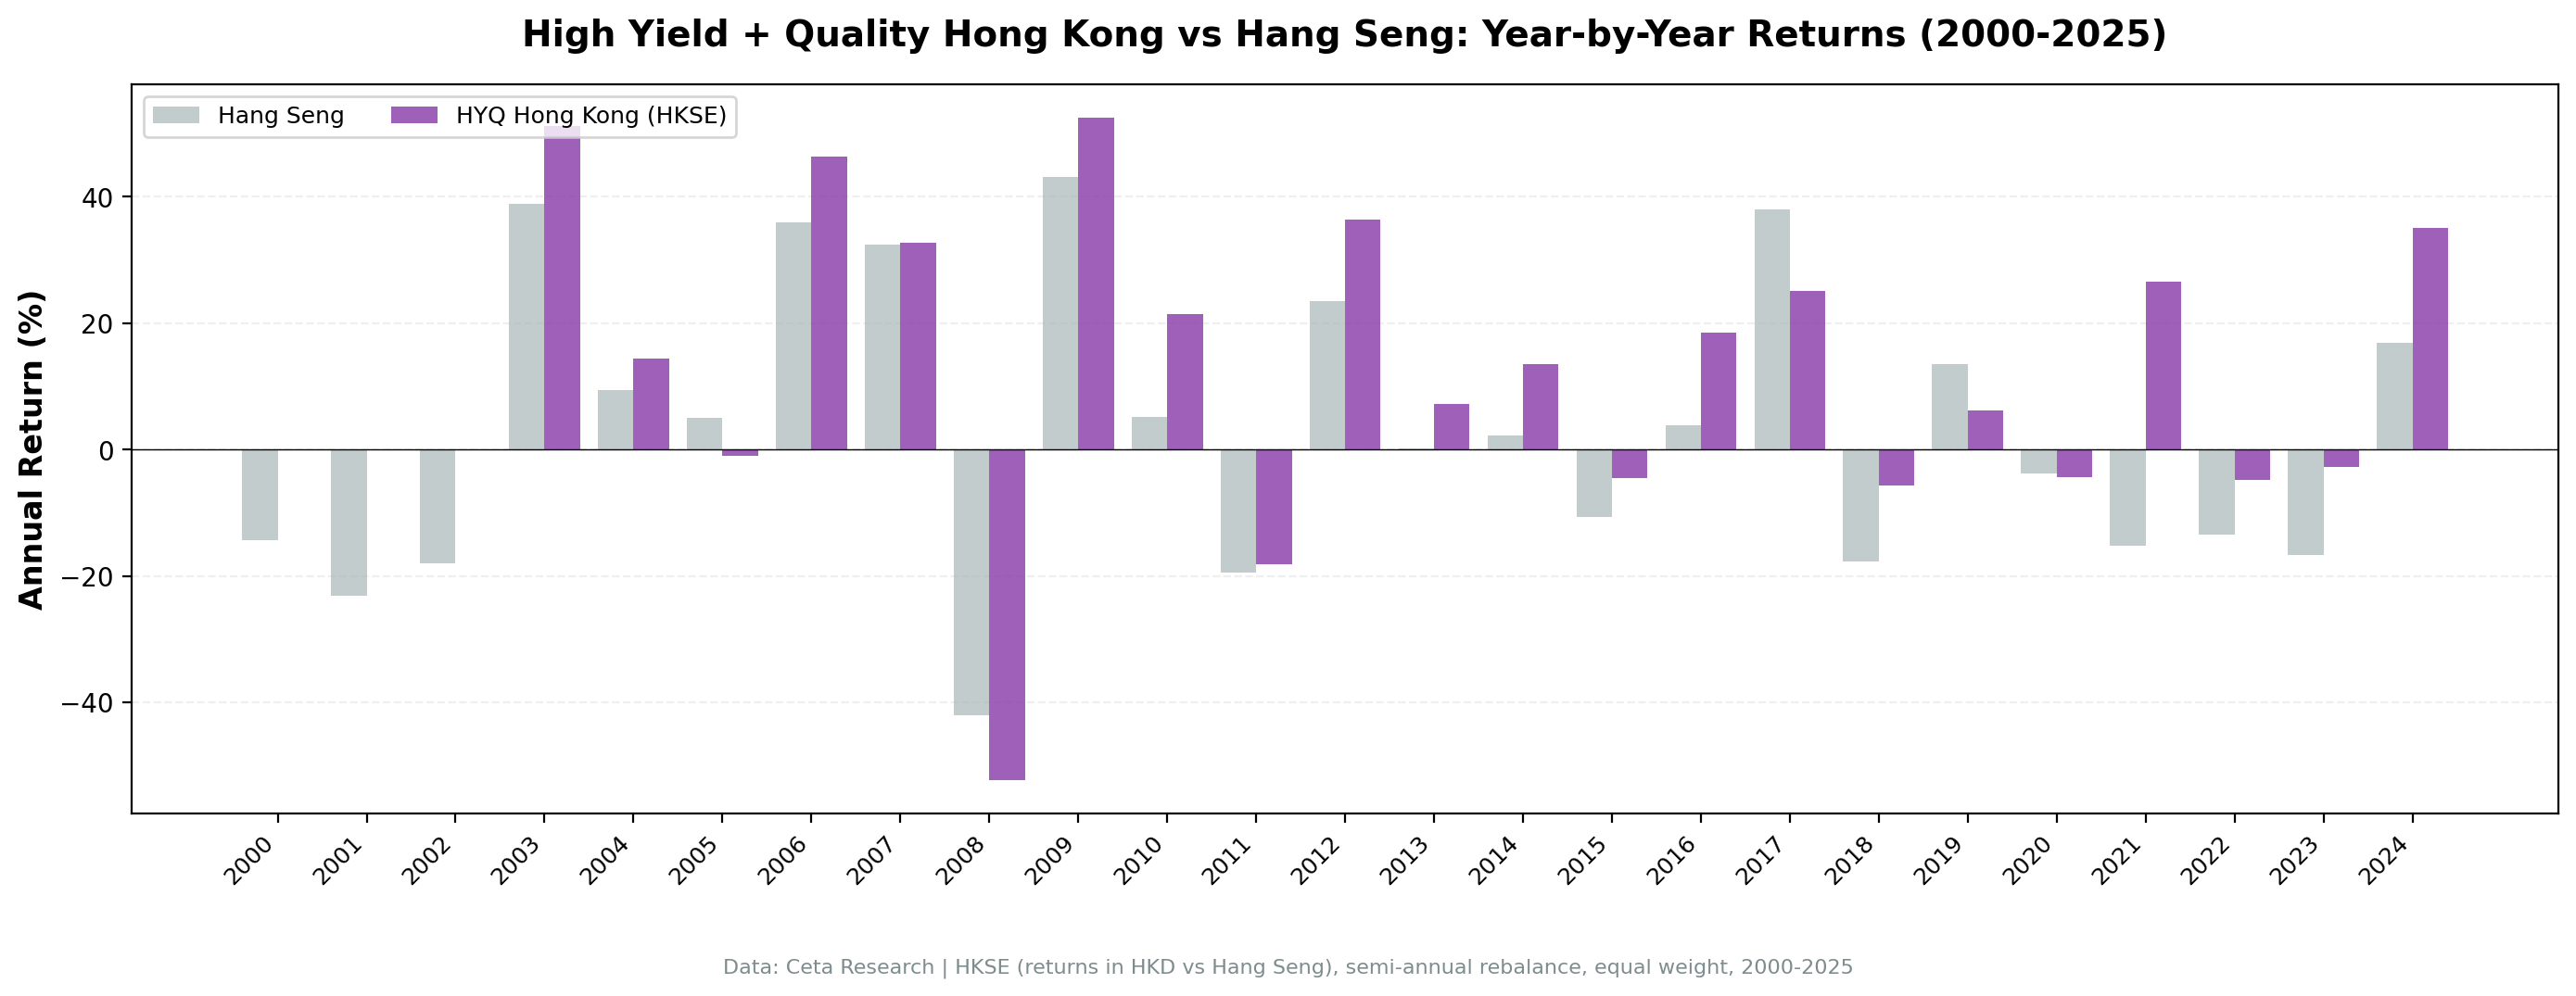
Annual Returns
| Year | Strategy | Hang Seng | Excess |
|---|---|---|---|
| 2000 | 0.0% (cash) | -14.4% | +14.4% |
| 2001 | 0.0% (cash) | -23.2% | +23.2% |
| 2002 | 0.0% (cash) | -18.0% | +18.0% |
| 2003 | +51.3% | +38.9% | +12.4% |
| 2004 | +14.4% | +9.5% | +4.9% |
| 2005 | -1.1% | +5.0% | -6.0% |
| 2006 | +46.4% | +35.9% | +10.5% |
| 2007 | +32.8% | +32.4% | +0.4% |
| 2008 | -52.4% | -42.1% | -10.2% |
| 2009 | +52.5% | +43.1% | +9.4% |
| 2010 | +21.4% | +5.2% | +16.2% |
| 2011 | -18.2% | -19.4% | +1.3% |
| 2012 | +36.5% | +23.5% | +12.9% |
| 2013 | +7.2% | +0.1% | +7.0% |
| 2014 | +13.5% | +2.2% | +11.3% |
| 2015 | -4.6% | -10.6% | +6.0% |
| 2016 | +18.5% | +3.9% | +14.6% |
| 2017 | +25.0% | +38.0% | -12.9% |
| 2018 | -5.7% | -17.8% | +12.1% |
| 2019 | +6.2% | +13.6% | -7.4% |
| 2020 | -4.3% | -3.8% | -0.6% |
| 2021 | +26.6% | -15.3% | +41.8% |
| 2022 | -4.8% | -13.4% | +8.7% |
| 2023 | -2.7% | -16.7% | +13.9% |
| 2024 | +35.1% | +16.9% | +18.2% |
When It Works
2003: +51.3% as Hong Kong recovered from SARS. High-yield quality names led the rebound.
2006: +46.4%, a massive year driven by pre-GFC China optimism flowing into Hong Kong dividend stocks. Beat the Hang Seng by 10.5 points.
2010, 2012-2014: Four years of strong outperformance, averaging double-digit excess. Shanghai-Hong Kong Stock Connect launched in 2014, boosting mainland interest in HK dividend stocks.
2021-2023: While the Hang Seng collapsed (cumulative -42%), the strategy held up far better with quality filters keeping the worst names out. The +41.8 point excess in 2021 was the best single-year outperformance. The 2023 result (-2.7% vs Hang Seng -16.7%) showed exceptional crisis protection.
2024: +35.1% vs Hang Seng +16.9%. Hong Kong valuations hit multi-decade lows in 2022-2023, and quality dividend payers rebounded sharply as sentiment improved.
When It Struggles
2008: -52.4% while the Hang Seng lost -42.1%. Worse than the index. High-yield names got crushed alongside the broader market during the global crisis.
2017: +25.0% vs Hang Seng +38.0%. In strong tech-and-financials rallies, the dividend tilt lagged.
2019: +6.2% vs +13.6%. Protests and trade tensions: the strategy held up but the broader index recovered faster.
Hong Kong's Dividend Culture
Hong Kong has a deep dividend-paying tradition, especially among property developers, utilities, and conglomerates. Many HKSE-listed companies are controlled by founding families who value consistent dividends. This makes the 4-15% yield range well-suited to the market, with 21.6 qualifying stocks on average.
The market also includes Chinese state-owned enterprises (SOEs) listed in Hong Kong ("H-shares") that often pay high dividends. These add both yield and China macro risk to the portfolio.
Limitations
China exposure: Many HKSE-listed companies derive revenue from mainland China. China economic slowdowns and regulatory actions affect returns disproportionately.
Currency: HKD is pegged to USD, so currency risk is minimal compared to other international markets. But mainland-revenue companies face CNY/HKD translation effects.
Liquidity: Some Hong Kong mid-caps have thin trading volumes. Our $256M market cap floor helps, but bid-ask spreads may be wider than US equivalents.
Deeper drawdown: The -52.4% 2008 drawdown is worse than the Hang Seng's -42.1%. The strategy's beta of 0.912 means it doesn't escape crashes; the alpha shows up between crashes, not during.
Data: Ceta Research (FMP financial data warehouse). Universe: HKSE, market cap > 2B HKD. Backtest: 2000-2025, annual July rebalance, next-day close execution (MOC). Past performance does not guarantee future results.
Part of a Series
This is the Hong Kong analysis. See also: - High Yield Quality on US Stocks - 10.52% CAGR, full methodology - High Yield Quality Across Global Exchanges - full comparison
References
- Fama, E. & French, K. (1998). "Value versus Growth: The International Evidence." Journal of Finance, 53(6), 1975-1999.


