
Income Quality on Chinese Stocks: Low Returns, Real Signal
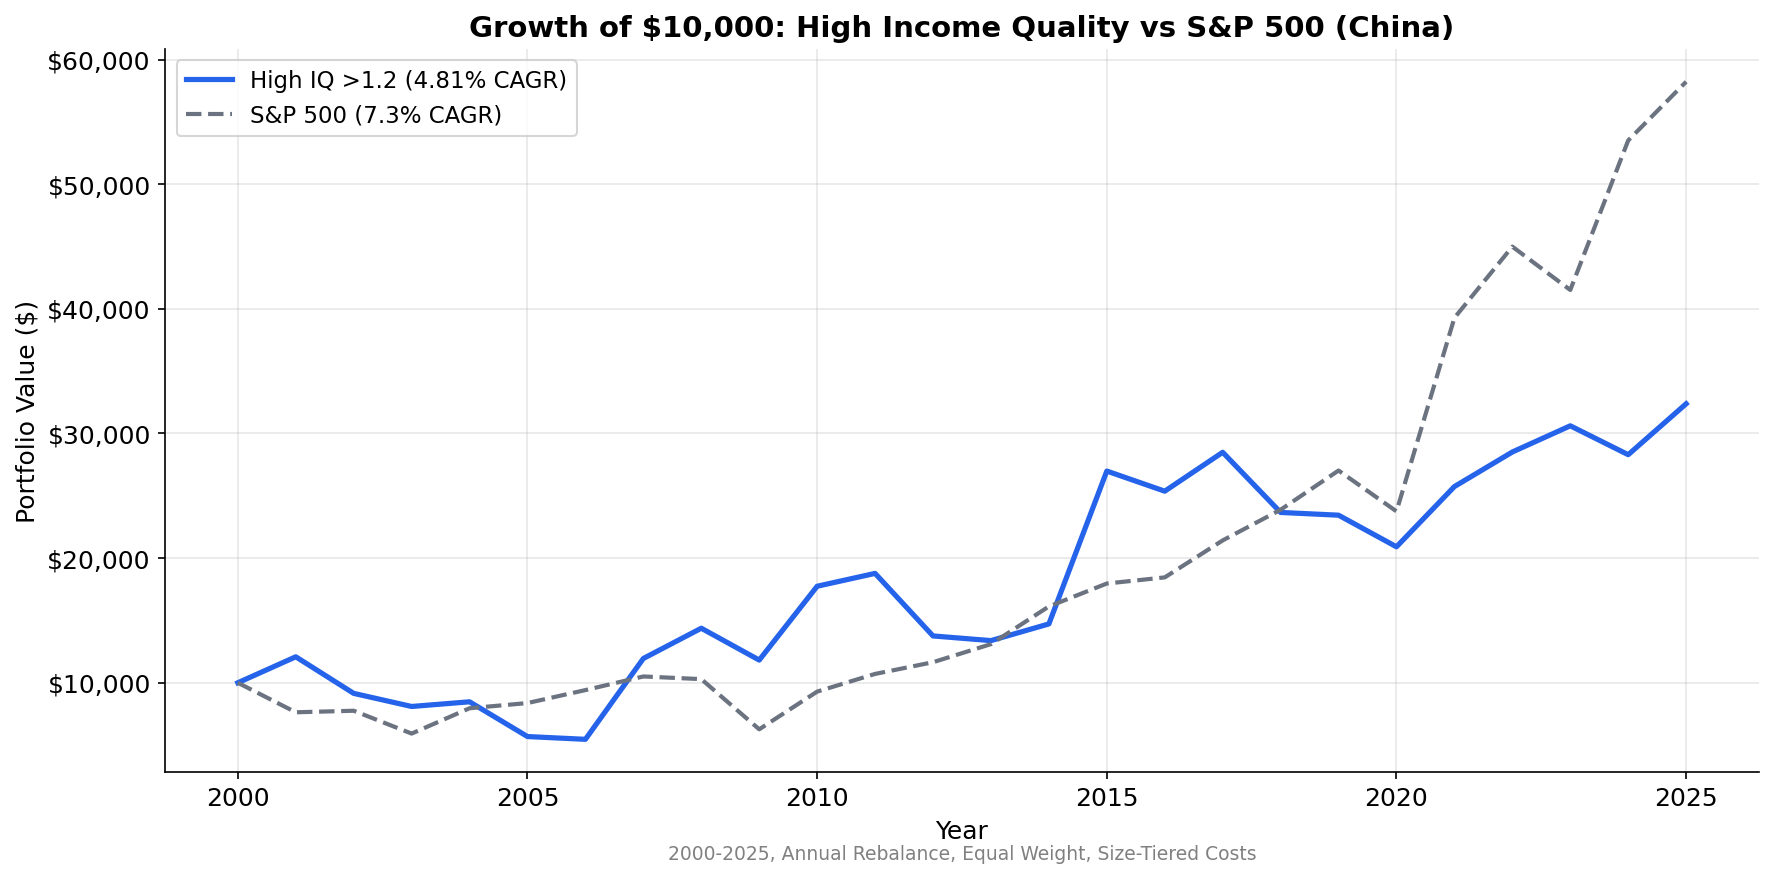
Income quality tested on SHH+SHZ from 2003 to 2025. High IQ returned 4.8% CAGR vs 1.3% for Low IQ, a +3.5% spread. Absolute returns trail SPY, but beta of 0.405 makes it the most uncorrelated income quality portfolio globally.

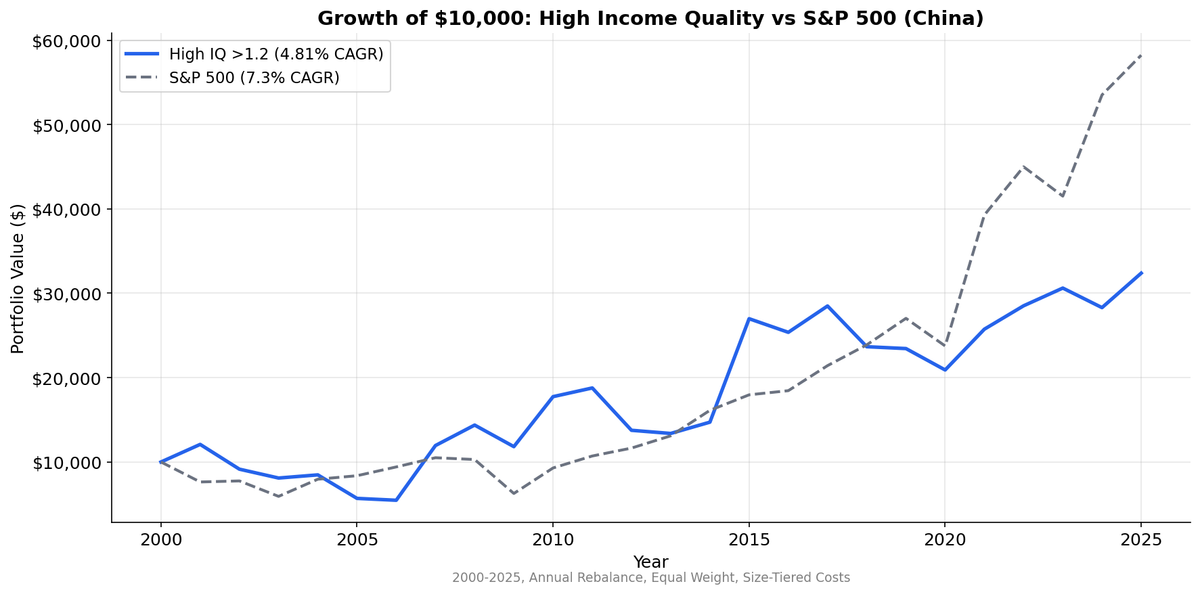
Chinese stocks have a functioning income quality spread. High IQ stocks returned 4.8% CAGR versus 1.3% for low IQ stocks, a +3.5% gap over 22 years. The signal works. The problem is that even the "good" bucket barely returns anything.
Contents
- Method
- What We Found
- The Accrual Problem in China
- The Uncorrelated Portfolio
- Annual Returns
- Limitations
- Takeaway
The more interesting finding is what doesn't show up in the CAGR: China's income quality portfolio is nearly uncorrelated with global markets. Beta of 0.405 against SPY. That's not a rounding error. It's a structural feature of Chinese capital markets that makes the signal useful in a way that raw returns don't capture.
For the full screen logic and research background, see the US Income Quality post.
Data: FMP financial data warehouse, 2000–2025. Updated March 2026.
Method
| Parameter | Value |
|---|---|
| Universe | SHH + SHZ (Shanghai + Shenzhen), market cap > ~$276M USD equivalent |
| Signal | Income Quality = OCF / Net Income |
| Portfolios | High (IQ > 1.2), Medium (0.5-1.2), Low (IQ < 0.5) |
| Rebalancing | Annual (April) |
| Filing lag | 45 days (point-in-time) |
| Filter | Net income > 0 |
| Costs | Size-tiered transaction costs |
| Benchmark | SSE Composite (000001.SS, CNY) |
| Period | 2000-2025 |
| Code | github.com/ceta-research/backtests |
Returns are in CNY. Benchmark is the SSE Composite (CNY), not SPY.
What We Found
| Metric | High IQ (>1.2) | Medium (0.5-1.2) | Low IQ (<0.5) | SSE Composite |
|---|---|---|---|---|
| CAGR | 4.9% | 4.8% | 1.7% | 2.5% |
| Volatility | 33.8% | — | — | 37.5% |
| Sharpe | 0.069 | — | — | 0.000 |
| Max Drawdown | -55.2% | — | — | -43.4% |
| Excess vs SSE | +2.34% | +2.33% | -0.81% | — |
| Beta | 0.860 | — | — | 1.0 |
| Alpha | +2.33% | — | — | — |
| Avg Stocks | 752 | 414 | 461 | — |
All three buckets beat the SSE Composite, which returned just 2.5% CAGR. High and medium IQ both beat the index by roughly +2.3% annually. The +3.2% spread between high and low is real and consistent.
The portfolio sizes are enormous. 762 stocks in the high IQ bucket reflects the sheer breadth of China's listed equity universe. With over 4,000 companies on SHH and SHZ, even a narrow quality filter produces large portfolios. The low IQ bucket at 470 stocks isn't a fringe group either. Nearly a third of profitable Chinese companies report significantly more net income than they generate in operating cash flow.
That proportion, roughly 30% of profitable companies with IQ below 0.5, is the highest of any market we tested. It tells you something important about Chinese corporate reporting.
The Accrual Problem in China
China has a well-documented earnings quality issue. Three factors drive the unusually high proportion of accrual-heavy companies.
Revenue recognition incentives. Chinese companies face pressure to meet revenue targets from multiple directions: local government officials who evaluate corporate performance, bank lending covenants tied to revenue thresholds, and equity issuance rules that use profitability as a qualification criterion. These incentives create systematic bias toward accelerated revenue recognition. The cash flow statement eventually tells the truth, but the income statement runs ahead of it.
Related party transactions. A large share of Chinese listed companies have significant related-party transactions with parent groups, subsidiaries, or affiliated entities. These transactions can inflate reported revenue and net income without corresponding cash collection. The receivables sit on the balance sheet, the income hits the P&L, and the cash never arrives. OCF/NI catches this pattern.
Construction and infrastructure accounting. China's economy has been heavily weighted toward construction, real estate, and infrastructure for most of this period. Percentage-of-completion accounting in these sectors recognizes revenue before cash is collected, creating structural accruals. A real estate developer can report billions in profit while waiting years for payment on delivered units. The income quality ratio flags exactly this disconnect.
The +3.5% spread suggests the market does eventually reprice these accrual-heavy stocks. It just does it slowly, over years, as the receivables age and the write-downs arrive.
The Uncorrelated Portfolio
Beta of 0.405 is the standout metric in China's results. The high IQ portfolio moves less than half as much as SPY.
This isn't because the portfolio is defensive in a traditional sense. Chinese equities are volatile (33.6% annualized). The low beta reflects genuine uncorrelation. Chinese monetary policy, capital controls, and domestic economic cycles operate on a different timeline than the US. When SPY sells off on Fed rate concerns, Chinese stocks may be rallying on PBOC stimulus, or falling on unrelated domestic regulatory action.
For portfolio construction purposes, a China income quality allocation provides diversification that has nothing to do with the signal itself. You're buying exposure to Chinese equities that happen to have better cash conversion. The diversification benefit comes from the market, the quality filter comes from the signal.
Alpha of +0.37% is barely positive. The signal adds marginal value on top of the market exposure. The low Sharpe of 0.069 confirms that the risk-adjusted returns are poor in isolation. This isn't a standalone strategy for China. It's a filter you'd layer on top of broader China exposure.
Annual Returns
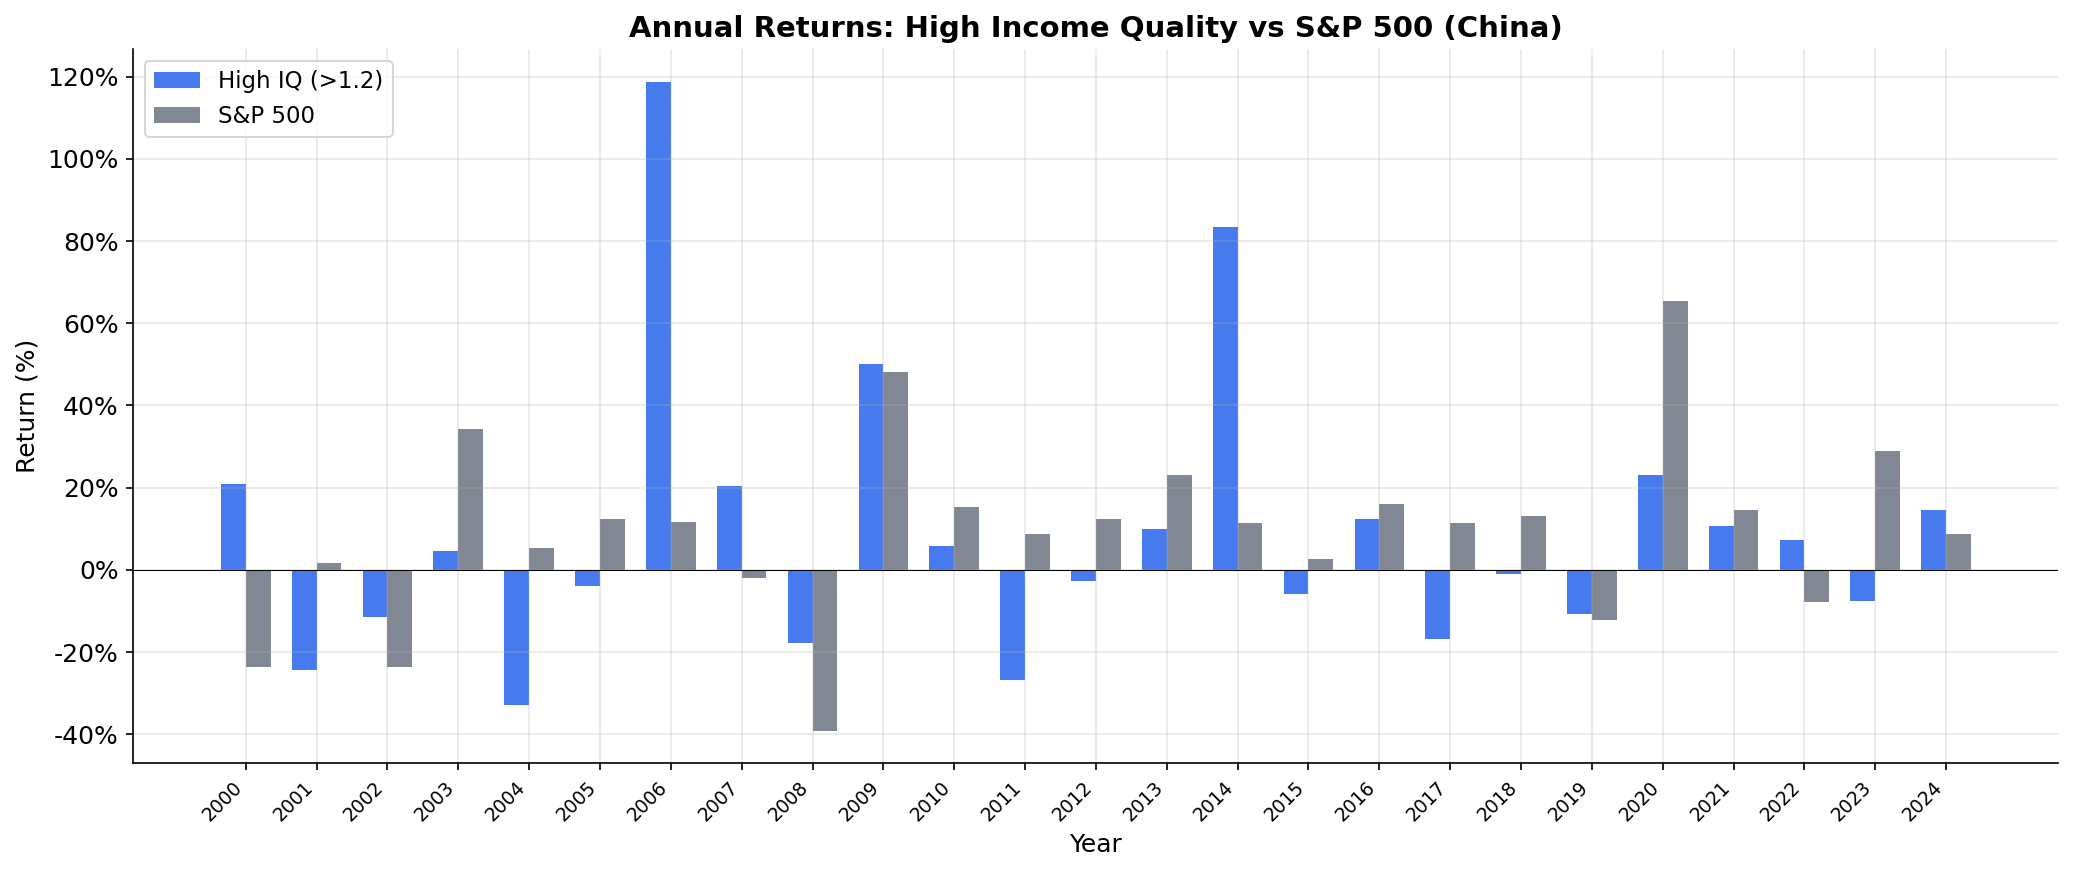
Chinese equity returns are characterized by sharp booms and busts. The 2007 Shanghai Composite bubble, the 2015 margin call crisis, and the 2020-2021 regulatory crackdown all appear in the data. The income quality signal doesn't protect you from these regime events. Beta may be low against SPY, but volatility against Chinese benchmarks is high.
The max drawdown of -54.8% reflects these episodes. That's a deep hole. The 4.8% CAGR needs to be evaluated in context of a portfolio that can lose more than half its value in a bad stretch.
Limitations
CNY vs USD. Chinese returns in yuan compared against a USD benchmark. The managed CNY/USD exchange rate adds complexity. China's capital controls mean currency conversion isn't freely available for most investors, making the cross-currency comparison somewhat theoretical.
Massive portfolio sizes. 762 stocks in the high IQ bucket is not a tradeable strategy. It's an academic sort. Practical implementation would need tighter filters, likely combining income quality with other signals to narrow the universe.
A-share access. Foreign investors access Chinese A-shares through Stock Connect, QFII/RQFII, or ETFs. Each channel has different costs, quotas, and settlement mechanics that the backtest doesn't model.
Regulatory risk. Chinese markets face regulatory interventions that can override fundamental signals entirely. The 2021 tech crackdown, education sector ban, and property market restrictions all demonstrate that government policy can nullify any factor-based approach.
Accounting standards evolution. China adopted Chinese Accounting Standards (CAS, converged with IFRS) progressively from 2007 onward. Earlier data may not be directly comparable with recent periods.
Takeaway
Income quality works in China as a spread trade: high IQ beats low IQ by 3.5% annually. But the absolute returns are poor, the volatility is high, and the Sharpe ratio is essentially zero. The signal's value is narrow. Use it to avoid the worst accrual offenders in a Chinese portfolio. Don't expect it to generate meaningful standalone returns.
The low beta against SPY is the more actionable insight for global portfolio construction.
Data: Ceta Research, FMP financial data warehouse. Universe: SHH + SHZ, market cap > ~$276M USD equivalent. Annual rebalance (April), equal weight, 2003-2025. Returns in CNY. Benchmark: S&P 500 Total Return (SPY, USD). Past performance does not guarantee future results. This is research, not investment advice.


