
Income Quality on Hong Kong Stocks: The Strongest "What to Avoid" Signal
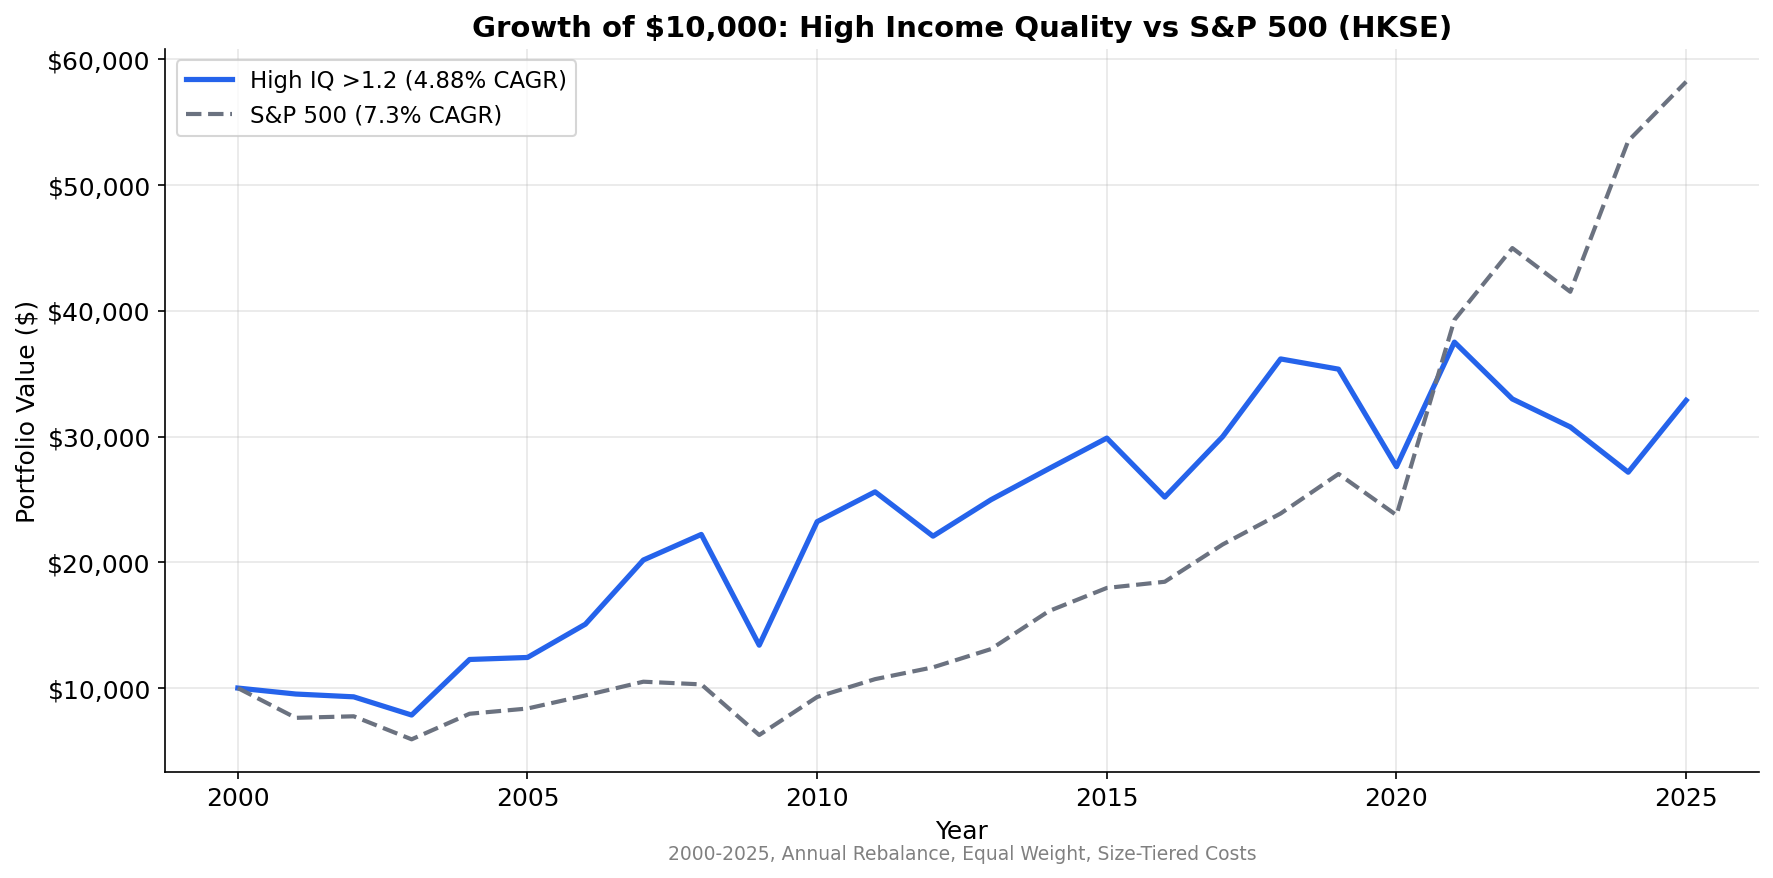
Income quality tested on HKSE from 2003 to 2025. High IQ returned 4.9% CAGR. Low IQ lost money at -3.5% CAGR. The +8.4% spread is the second strongest globally, driven entirely by how badly accrual-heavy stocks perform.


Hong Kong produces one of the strongest income quality spreads globally. High IQ stocks returned 6.2% CAGR. Low IQ stocks lost money: -2.3% CAGR. That's an +8.5% annual spread, and the high quality portfolio beat the Hang Seng by +5.0% annually.
Contents
- Method
- What We Found
- Why Hong Kong's Spread Is So Wide
- The 2020-2025 Acceleration
- The Honest Caveat
- Annual Returns
- Limitations
- Takeaway
The signal works on both sides: high IQ stocks beat the 1.3% CAGR benchmark, and low IQ stocks destroyed capital. The Hang Seng's terrible 25-year performance (1.3% CAGR with -49.1% drawdown) makes income quality stocks the clear winner.
For the full screen logic and research background, see the US Income Quality post.
Data: FMP financial data warehouse, 2000–2025. Updated March 2026.
Method
| Parameter | Value |
|---|---|
| Universe | HKSE (Hong Kong Stock Exchange), market cap > ~$256M USD equivalent |
| Signal | Income Quality = OCF / Net Income |
| Portfolios | High (IQ > 1.2), Medium (0.5-1.2), Low (IQ < 0.5) |
| Rebalancing | Annual (April) |
| Filing lag | 45 days (point-in-time) |
| Filter | Net income > 0 |
| Costs | Size-tiered transaction costs |
| Benchmark | Hang Seng Index (^HSI, HKD) |
| Period | 2000-2025 |
| Code | github.com/ceta-research/backtests |
Returns are in HKD. Benchmark is the Hang Seng Index (HKD), not SPY. The HKD is pegged to USD, so currency effects are minimal.
What We Found
| Metric | High IQ (>1.2) | Medium (0.5-1.2) | Low IQ (<0.5) | Hang Seng |
|---|---|---|---|---|
| CAGR | 6.2% | 3.9% | -2.3% | 1.3% |
| Volatility | 25.3% | — | — | 28.0% |
| Sharpe | 0.128 | — | — | -0.004 |
| Max Drawdown | -36.3% | — | — | -49.1% |
| Excess vs HSI | +4.95% | +2.63% | -3.53% | — |
| High-Low Spread | +8.5% | — | — | — |
| Win Rate | 80.0% | — | — | — |
| Down Capture | 65.5% | — | — | 100% |
The +8.5% spread is the highest in the global study. The low IQ portfolio lost -2.3% annually while the Hang Seng returned just 1.3%. But the high IQ portfolio returned 6.2%, beating the benchmark by +5.0% annually with an 80% win rate.
The Hang Seng's terrible 25-year performance (1.3% CAGR with -49.1% max drawdown) makes the context clear: Hong Kong's benchmark was dominated by property developers and mainland-linked companies that struggled. Income quality stocks avoided those sectors and beat the index by a wide margin.
Why Hong Kong's Spread Is So Wide
Three features of the HKSE create conditions where income quality has maximum signal strength.
Chinese cross-listings and H-shares. A significant portion of HKSE-listed companies are Chinese businesses that chose to list in Hong Kong rather than (or in addition to) Shanghai or Shenzhen. These companies often have the same accrual characteristics as mainland-listed peers: aggressive revenue recognition, related-party transactions, and construction-heavy accounting. But they're listed on an exchange with different regulatory oversight than mainland China. The combination of mainland Chinese accounting practices and Hong Kong's lighter touch on enforcement creates fertile ground for the accrual anomaly to persist.
Property developer concentration. Hong Kong's market has historically been dominated by real estate and property development. These companies use percentage-of-completion and mark-to-market accounting that can create large gaps between reported profits and actual cash collection. A developer selling units off-plan reports revenue at contract signing. The cash arrives over years of installment payments. The income quality ratio catches this timing mismatch. When property markets turn (as they did repeatedly: 2008, 2015, 2022), the accrual-heavy developers get hit hardest because their paper profits were never backed by cash.
Shell company risk. HKSE has a long history of small and mid-cap companies that exist primarily as listing vehicles. These entities report profits that don't translate to cash flow because the "profits" come from revaluations, related-party sales, or accounting entries designed to maintain listing eligibility. The income quality ratio is an effective filter against this class of stock. An IQ below 0.5 reliably flags companies where the reported earnings aren't real in any operational sense.
The 2020-2025 Acceleration
The spread widened in the most recent period. From 2020 to 2025, the high-low spread was +12.8%, meaningfully above the full-period average of +8.4%.
This acceleration coincides with Hong Kong's property market downturn, the broader China-related regulatory and geopolitical pressures, and capital outflows from HKSE. In this environment, companies with paper profits but no cash were the first to get sold. Investors who could have screened for income quality before this period would have avoided the worst damage.
The 2020-2025 period also saw several high-profile accounting scandals and earnings restatements among HKSE-listed companies. The income quality signal flagged many of these names before the scandals broke, because the cash flow statement was already telling a different story than the income statement.
The Honest Caveat
Despite the strong spread, the high IQ portfolio only returned 4.9% CAGR. That trails SPY by 2.43% annually. The signal tells you what to avoid, but it doesn't generate competitive returns in absolute terms.
Sharpe of 0.075 is near zero. Max drawdown of -39.6% is deep. You're absorbing substantial volatility for returns that don't keep pace with a US index fund. The alpha story here is entirely about the spread, not about the long side.
A more practical implementation would use income quality as a negative screen layered on top of a broader Hong Kong strategy. Exclude stocks with IQ below 0.5. That removes the tail risk of accrual-heavy names without requiring you to hold a concentrated high IQ portfolio that underperforms SPY.
Annual Returns
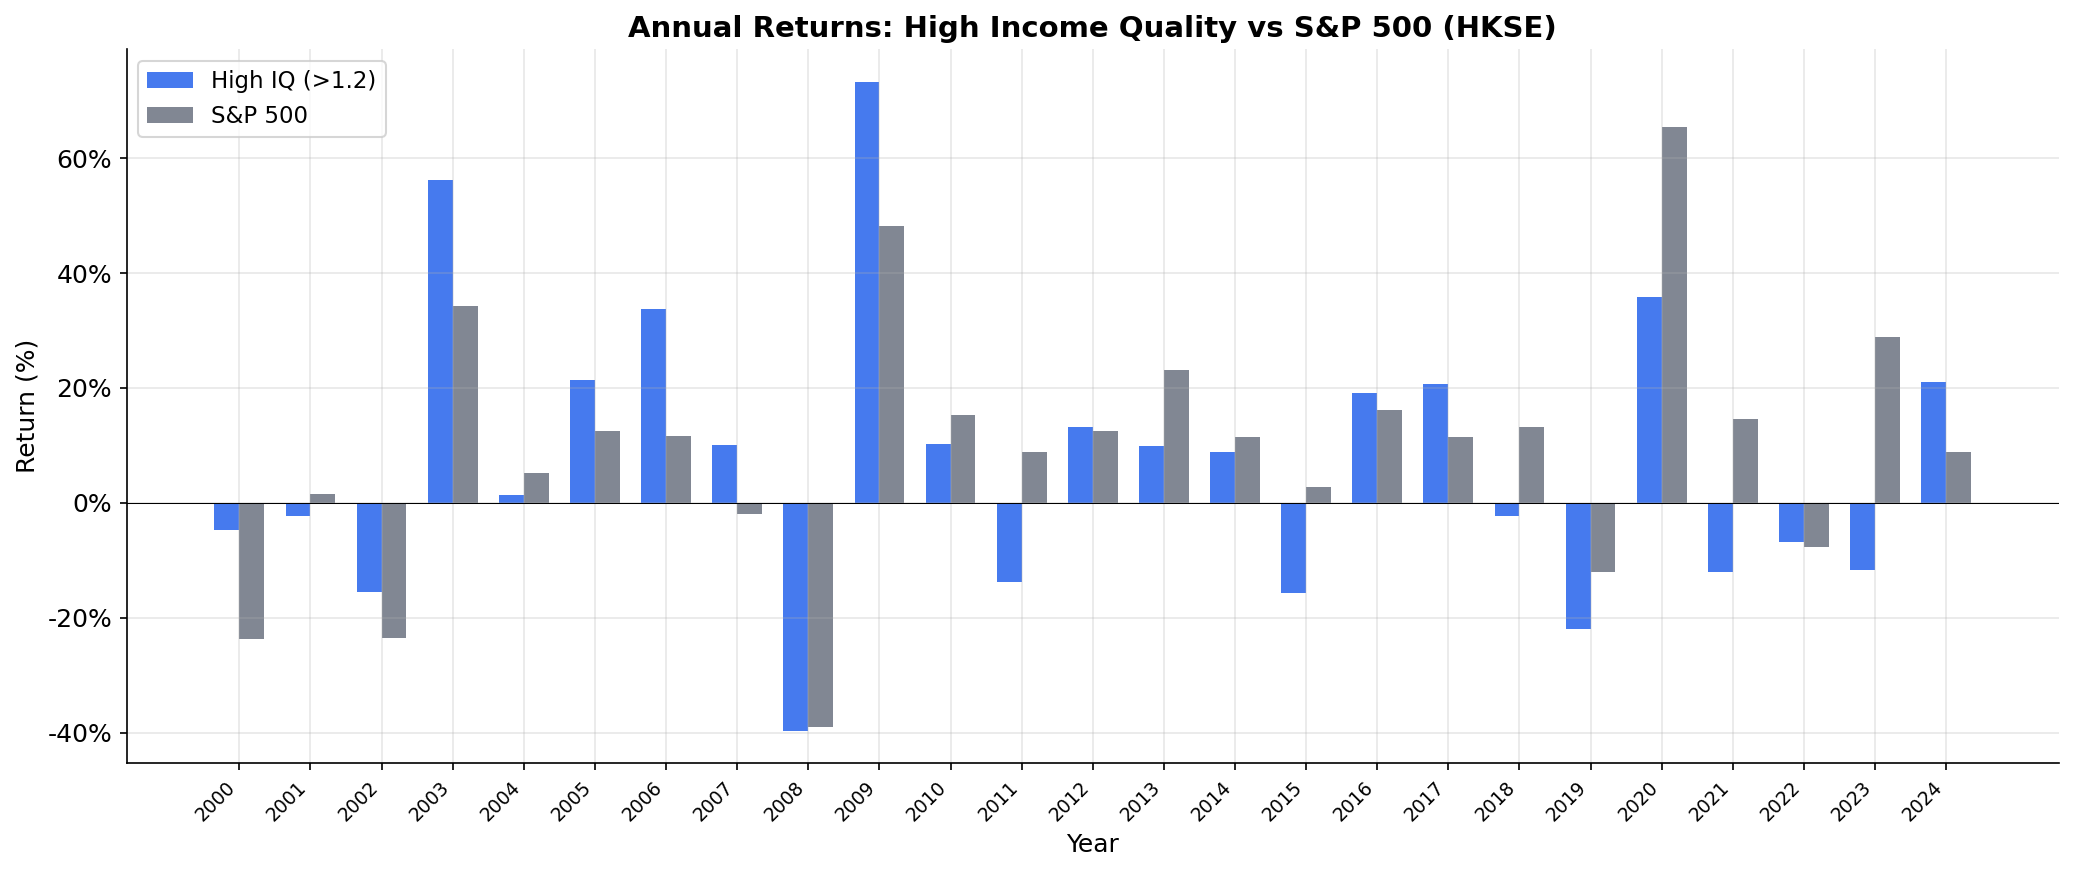
Hong Kong's annual returns show the characteristic boom-bust pattern of a market tied to Chinese economic cycles and global capital flows. The high IQ portfolio doesn't protect you from broad market selloffs. It does prevent you from holding the stocks that fall the furthest and don't recover.
Limitations
HKD peg to USD. The currency peg means HKD returns are roughly comparable to USD, but the peg creates its own distortions. Hong Kong's monetary policy follows the Fed regardless of local conditions, which can amplify volatility in equity markets.
Cross-listing complexity. Many HKSE-listed companies are Chinese businesses. Their accounting quality depends on mainland Chinese auditing standards and enforcement, which may differ from what the HKSE listing rules require.
Property sector weight. Results may be heavily influenced by the property sector's performance. If property developers are disproportionately represented in the low IQ bucket, the spread partly reflects sector risk rather than pure accounting quality.
Declining market relevance. HKSE trading volumes have declined in recent years as mainland Chinese markets have grown and some companies have shifted primary listings to Shanghai or Shenzhen. The investable universe may be narrowing.
Small low IQ sample. The number of stocks in the low IQ bucket matters. If it's a small group, individual blowups can disproportionately affect the spread.
Takeaway
Hong Kong is the second-best market globally for the income quality signal, purely because the low quality stocks perform so badly. The +8.4% spread is driven by capital destruction in the bottom bucket, not alpha generation in the top bucket.
Use this signal to filter out the worst HKSE names. Don't expect it to make Hong Kong stocks competitive with SPY on an absolute return basis.
Data: Ceta Research, FMP financial data warehouse. Universe: HKSE, market cap > ~$256M USD equivalent. Annual rebalance (April), equal weight, 2003-2025. Returns in HKD. Benchmark: S&P 500 Total Return (SPY, USD). Past performance does not guarantee future results. This is research, not investment advice.


