
Income Quality on Indian Stocks: The Signal That Doesn't Work in India
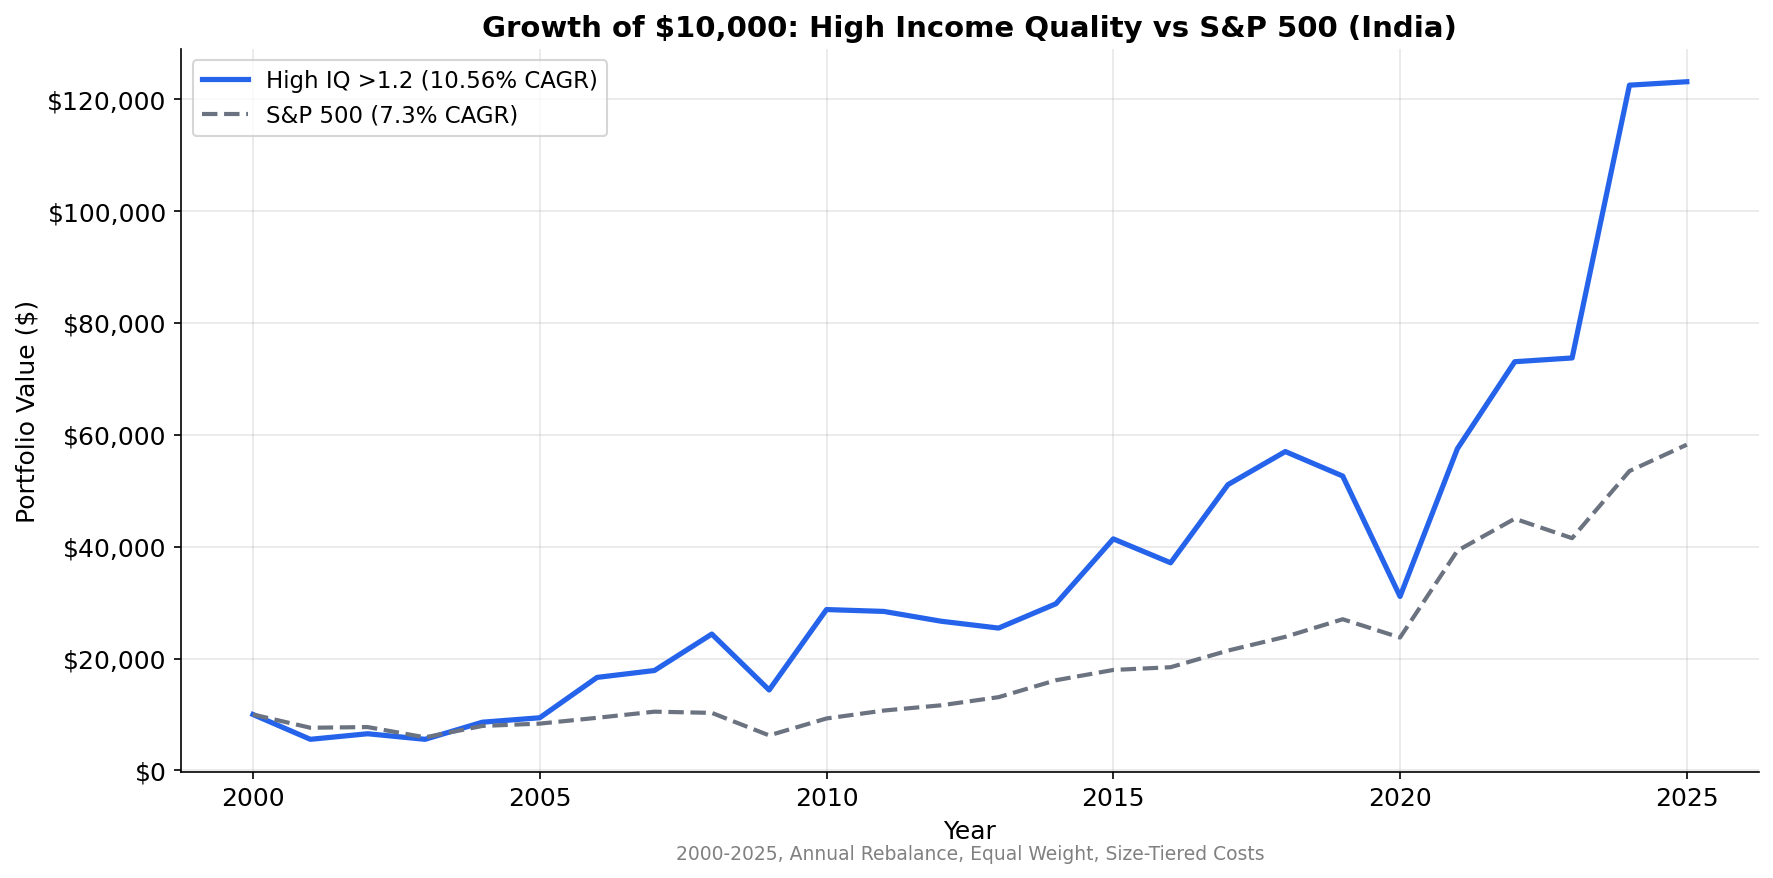
We tested income quality (OCF/NI) on BSE+NSE from 2003 to 2025. High IQ returned 10.6% CAGR vs 11.0% for Low IQ. The spread is -0.4%, essentially zero. India is the only market where this signal doesn't work.

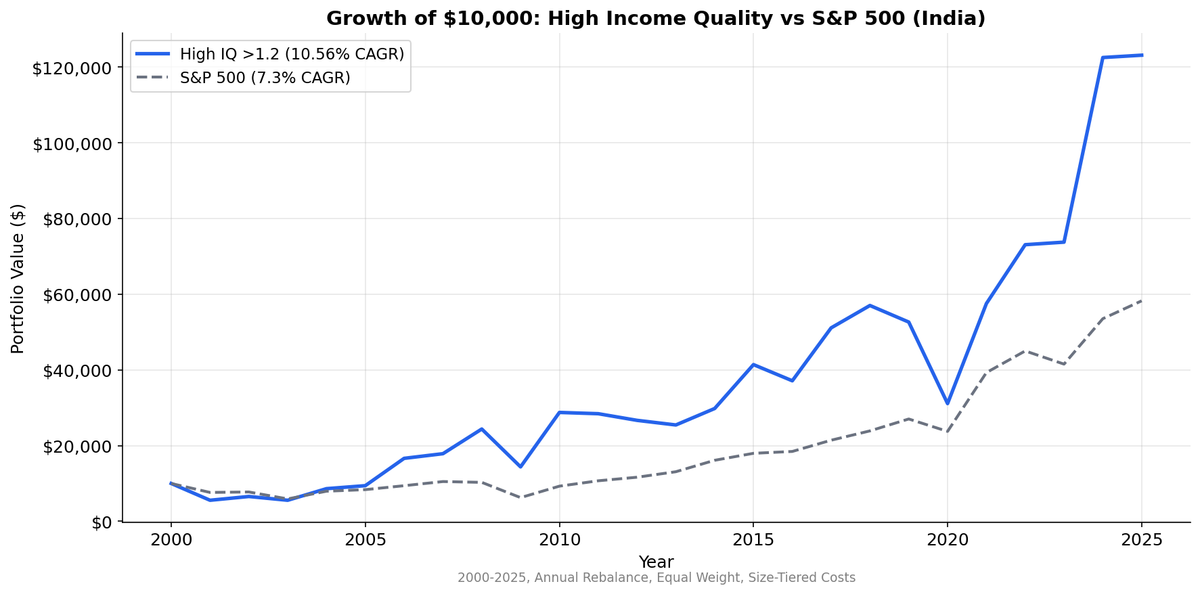
India breaks the income quality trade. Across most markets we tested, stocks with high operating cash flow relative to net income outperform stocks with low ratios. The spread between high and low quality buckets is typically 3-7% annually. In India, the spread is -0.6%. Negative.
Contents
That's not a data error. It's a genuine finding. But the story is more interesting than just a flat spread. Even the high quality portfolio underperforms the Sensex. All three quality buckets trail India's benchmark index. The income quality signal doesn't just fail to differentiate stocks in India — it actively selects the wrong ones.
For the full screen logic and research background, see the US Income Quality post.
Data: FMP financial data warehouse, 2000–2025. Updated March 2026.
Method
| Parameter | Value |
|---|---|
| Universe | NSE (National Stock Exchange), market cap > ~$240M USD equivalent |
| Signal | Income Quality = OCF / Net Income |
| Portfolios | High (IQ > 1.2), Medium (0.5-1.2), Low (IQ < 0.5) |
| Rebalancing | Annual (April) |
| Filing lag | 45 days (point-in-time) |
| Filter | Net income > 0 (negative NI breaks the ratio) |
| Costs | Size-tiered transaction costs |
| Benchmark | Sensex (^BSESN, INR) |
| Period | 2000-2025 |
| Code | github.com/ceta-research/backtests |
Returns are in INR. Benchmark is the Sensex (INR), not SPY.
What We Found
All three quality buckets trail the Sensex. None of them beat the benchmark.
| Metric | High IQ (>1.2) | Medium (0.5-1.2) | Low IQ (<0.5) | Sensex |
|---|---|---|---|---|
| CAGR | 10.4% | 11.5% | 11.0% | 11.5% |
| Volatility | 39.2% | — | — | 32.7% |
| Sharpe | 0.099 | — | — | 0.152 |
| Max Drawdown | -46.0% | — | — | -38.3% |
| Excess vs Sensex | -1.12% | +0.05% | -0.45% | — |
| Up Capture | 106.6% | — | — | 100% |
| Down Capture | 107.2% | — | — | 100% |
| Beta | 1.092 | — | — | 1.0 |
| Alpha | -1.58% | — | — | — |
| Avg Stocks | 82 | 104 | 70 | — |
The high-low spread is -0.6%. The signal doesn't separate winners from losers. But more striking: the high quality portfolio returned 10.4% while the Sensex returned 11.5%. Cash-backed earnings underperformed the market by -1.12% annually. The down capture of 107.2% means high IQ stocks fell harder in down years than the index. This is the opposite of what income quality delivers in other markets.
Medium quality stocks matched the Sensex at 11.5% CAGR. Low quality returned 11.0%. None of the three buckets beat the benchmark, and the ordering is reversed from what the theory predicts.
Why the Signal Fails in India
Three structural factors explain why income quality doesn't discriminate in India the way it does in the US or Europe.
Ind AS accounting standards changed the game. India's transition from Indian GAAP to Ind AS (converged with IFRS) in 2015-2017 altered how companies report both net income and operating cash flow. IFRS-style accounting treats certain items differently than US GAAP. Lease accounting, revenue recognition timing, and fair value adjustments all shift the OCF/NI ratio in ways that don't map cleanly to Sloan's original accrual anomaly. The ratio still measures something, but it measures a different mix of operational and accounting effects.
Capital intensity runs through the entire market. The Indian economy is structurally more capital-intensive than the US. Infrastructure buildout, manufacturing expansion, and real estate development consume cash across most sectors. High depreciation charges suppress net income below cash flow, pushing the IQ ratio up for reasons that have nothing to do with earnings quality. A cement company spending heavily on capacity expansion looks like a "high quality" earner by this metric. It's not manipulating anything. It's just capital-intensive.
Working capital cycles are longer. Indian businesses, particularly in manufacturing and construction, operate with extended payment terms. 90 to 180 day receivable cycles are common. These create natural accrual swings that add noise to the OCF/NI ratio. The ratio bounces around based on collection timing rather than earnings manipulation.
The result is a market where the IQ ratio captures accounting mechanics and capital structure effects rather than the earnings manipulation signal it was designed to detect.
What This Means
The absolute returns don't look bad at first glance. High IQ returned 10.4% CAGR, which is respectable. But the Sensex returned 11.5% CAGR with lower volatility (32.7% vs 39.2%) and a better Sharpe (0.152 vs 0.099). The income quality portfolio delivered worse returns with more risk.
The beta of 1.09 and down capture of 107.2% show that high quality stocks fell harder than the index during selloffs. The theoretical advantage of cash-backed earnings — downside protection — doesn't materialize in India. The opposite happens.
If you're building a multi-factor screen for Indian stocks, income quality adds no value as a primary signal. Momentum, FCF growth, and ROE spreads all discriminate better on NSE. The market rewards growth and operational leverage, not conservative cash conversion.
As a quality filter, income quality is unreliable in India. The low quality bucket (IQ < 0.5) returned 11.0% CAGR, essentially matching the medium and high buckets. Avoiding low income quality stocks doesn't help. Buying high income quality stocks doesn't help. The signal is noise.
Annual Returns
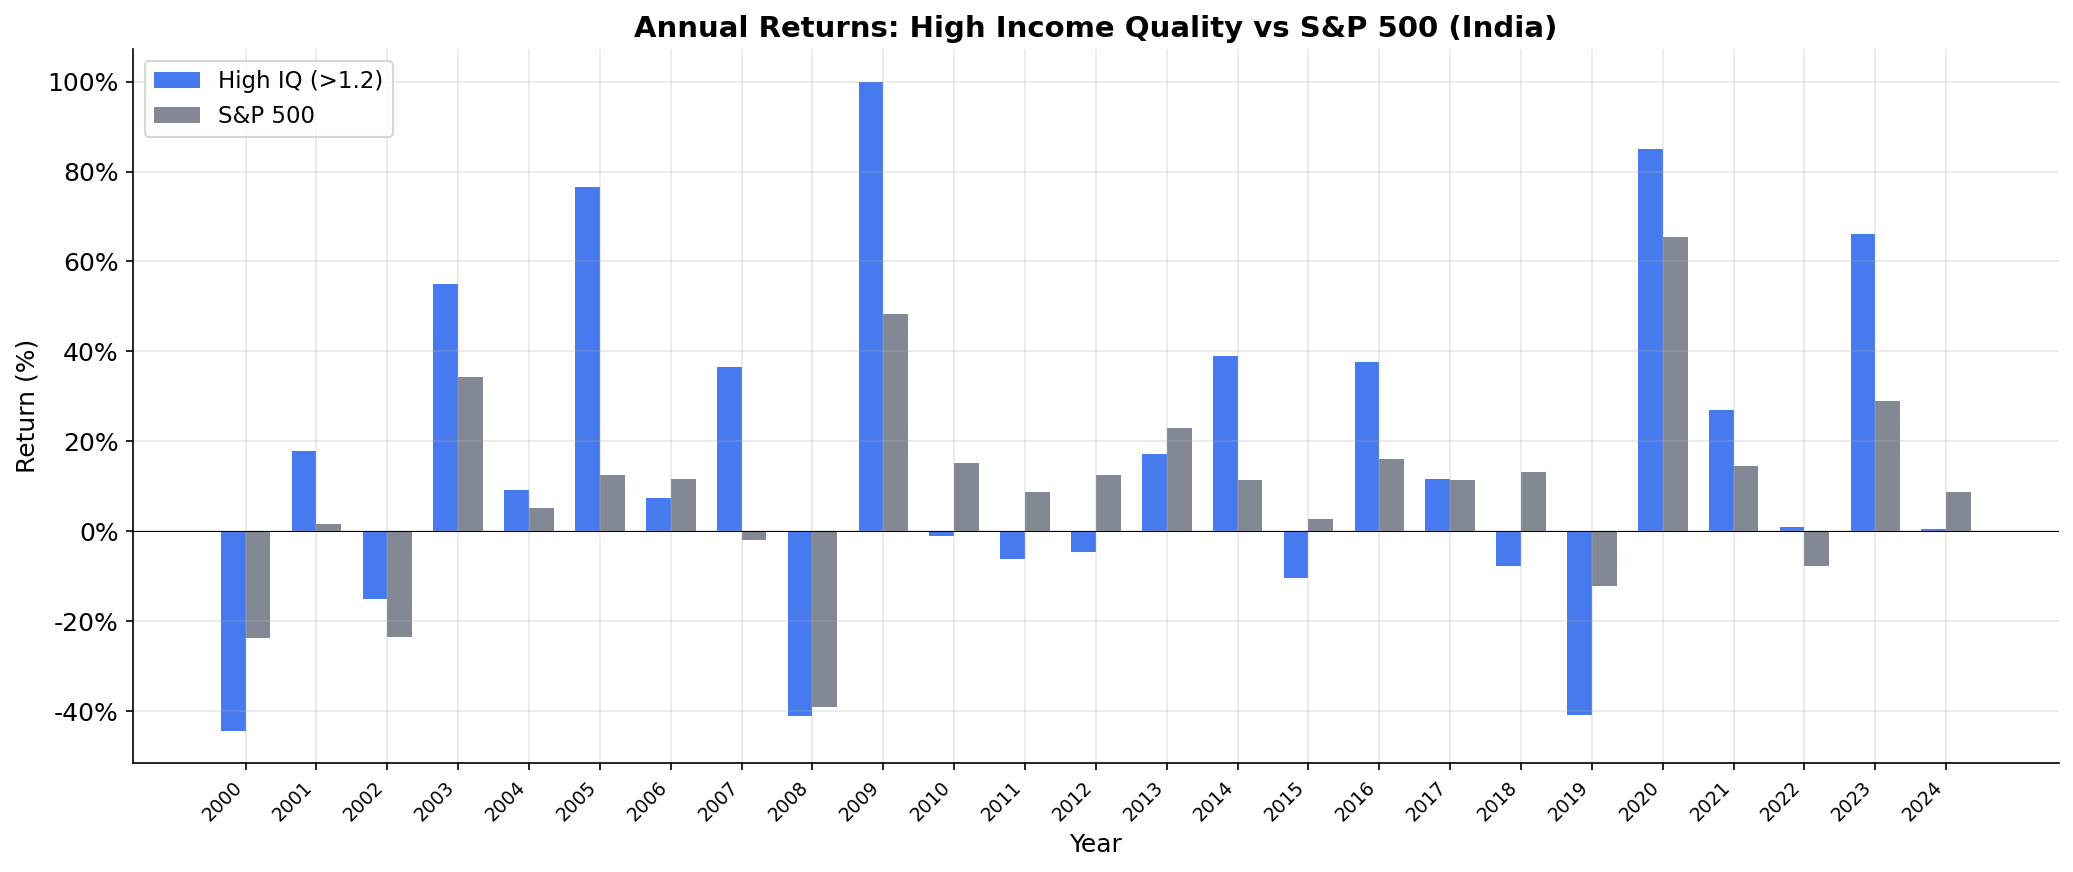
The year-by-year pattern shows that all three buckets move together in most years. When India rallies, they all rally. When India sells off, they all sell off. The correlation between high and low IQ portfolios is far higher in India than in any other market we tested.
Limitations
Smaller portfolios than expected. The high IQ bucket averaged 82 stocks (not 163 as in the old BSE+NSE combined universe). The NSE-only filter narrows the universe substantially. Even with fewer stocks, the signal produces no differentiation.
Negative spread, negative alpha. The high quality portfolio's alpha of -1.58% vs the Sensex confirms this isn't just about portfolio construction or sector tilts. The signal actively selects the wrong stocks in India.
Accounting regime change. The transition to Ind AS in 2016-2017 creates a structural break in the data. Pre-Ind AS and post-Ind AS periods may not be directly comparable. The ratio's meaning shifted when the accounting standards shifted.
High volatility. 38.3% annualized vol means this portfolio can swing 40-50% in a single year. The 10.6% CAGR needs to be evaluated against that ride. Most investors would find the drawdown path uncomfortable even if the endpoint looks reasonable.
Takeaway
India is a counterexample to the global income quality trade. The OCF/NI ratio doesn't separate good stocks from bad ones in this market. The signal is diluted by accounting standards, capital intensity, and working capital dynamics that are structurally different from the US market where Sloan's accrual anomaly was discovered.
If you're screening Indian stocks, skip income quality as a primary signal. The market rewards other factors more reliably.
Data: Ceta Research, FMP financial data warehouse. Universe: NSE, market cap > ~$240M USD equivalent. Annual rebalance (April), equal weight, 2000-2025. Returns in INR. Benchmark: Sensex (^BSESN, INR). Past performance does not guarantee future results. This is research, not investment advice.


