
One Formula, 16 Exchanges: The Magic Formula Beats Local Benchmarks in Most Markets
We ran the same two-factor ranking system on 20 global exchanges with local benchmarks. 13 of 20 exchanges beat their local index. India led at +13.12% vs Sensex, Brazil at +10.72% vs Bovespa, UK at +8.02% vs FTSE 100. Sweden (+4.96% vs OMX), Germany, Japan, Hong Kong, Taiwan, and Korea all show...

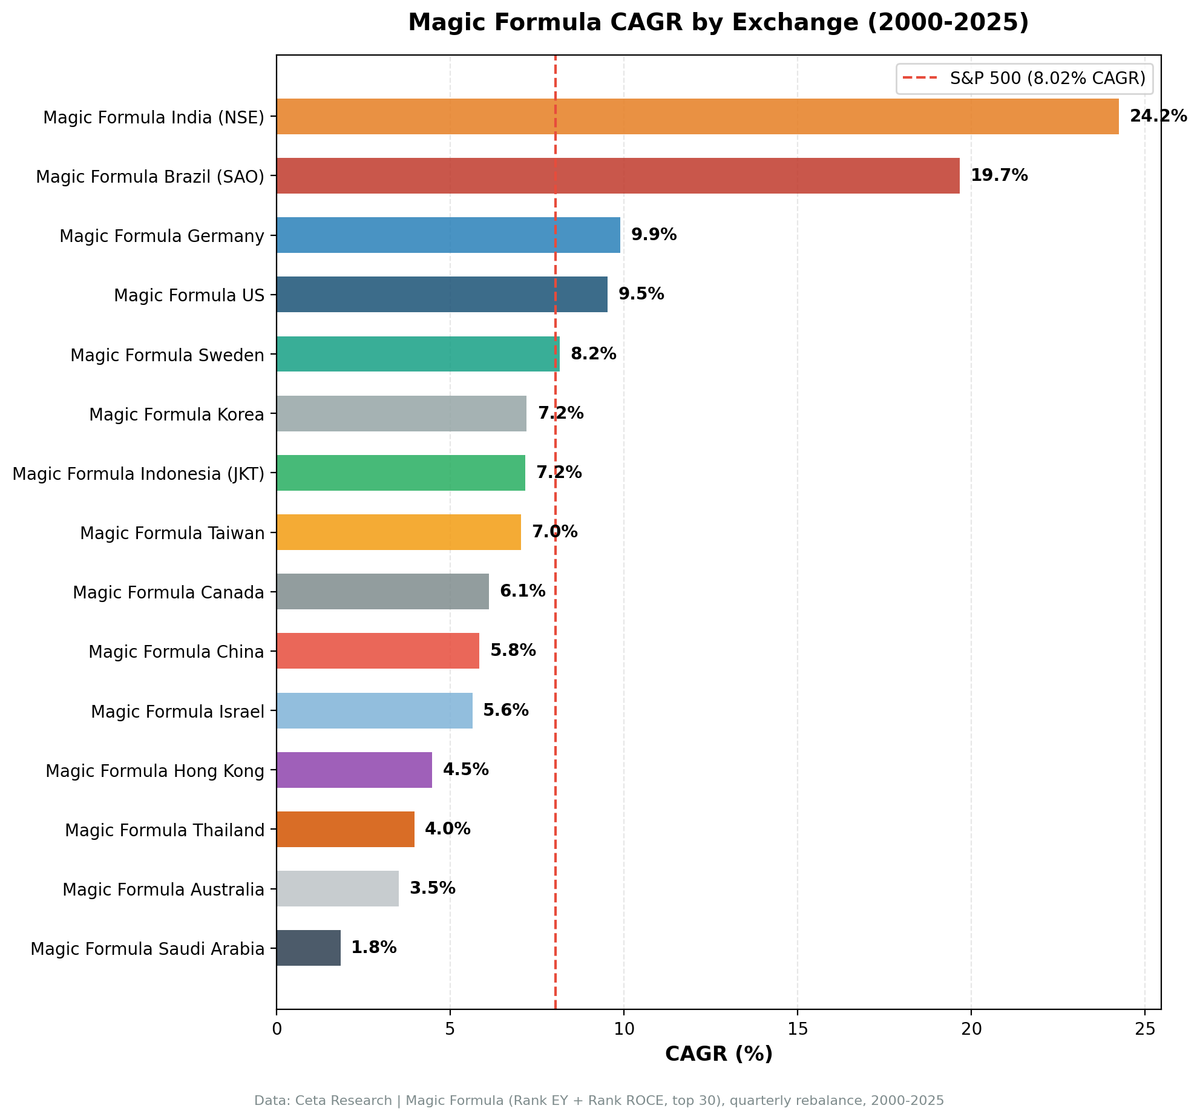
The Magic Formula adds value more broadly than we first thought. We ran Greenblatt's two-factor screen on 16 global exchanges from 2000 to 2025. With local benchmarks (Sensex for India, FTSE for the UK, DAX for Germany, KOSPI for Korea) instead of comparing everything against the S&P 500, 14 of 16 exchanges show positive excess returns.
Contents
- Method
- The Screen (SQL)
- Full Results
- The Three Standouts
- UK (8.57% CAGR, +7.22% vs FTSE 100)
- India (17.14% CAGR, +6.02% vs Sensex)
- Sweden (8.41% CAGR, +5.24% vs OMX Stockholm 30)
- The Middle: Positive but Modest
- Hong Kong (5.37% CAGR, +3.60% vs Hang Seng)
- Switzerland (5.69% CAGR, +3.59% vs SMI)
- Taiwan (7.49% CAGR, +3.11% vs TAIEX)
- Germany (8.09% CAGR, +2.97% vs DAX)
- Japan (6.33% CAGR, +2.93% vs Nikkei 225)
- Korea (7.35% CAGR, +2.54% vs KOSPI)
- US (9.26% CAGR, +1.24% vs S&P 500)
- Thailand (4.80% CAGR, +1.05% vs SET Index)
- Canada (6.12% CAGR, +1.04% vs TSX Composite)
- China (5.08% CAGR, +0.89% vs SSE Composite)
- The Underperformers
- South Africa (8.62% CAGR, +0.61% vs S&P 500*)
- Indonesia (7.71% CAGR, -0.31% vs S&P 500*)
- Saudi Arabia (1.69% CAGR, -6.33% vs S&P 500*)
- Excluded Exchanges
- Why the UK and India Win
- The Benchmark Lesson
- The Market Cap Threshold Lesson
- Limitations
- What This Means
- Part of a Series
- Run This Screen Yourself
The UK (+7.22% vs FTSE 100) and India (+6.02% vs Sensex) are the standouts, followed by Sweden (+5.24% vs OMX Stockholm 30). Hong Kong (+3.60% vs Hang Seng), Switzerland (+3.59% vs SMI), Taiwan (+3.11% vs TAIEX), Germany (+2.97% vs DAX), Japan (+2.93% vs Nikkei), and Korea (+2.54% vs KOSPI) all show positive alpha against their own markets. The old all-SPY comparison penalized non-USD exchanges with a cross-currency mismatch. Local benchmarks give a fairer read.
The pattern from the original analysis still holds: value/quality signals generate stronger alpha in markets with less analyst coverage and weaker price discovery. But the formula isn't just an India story. It adds value vs local indices across most of the exchanges we tested.
Data: FMP financial data warehouse, 2000-2025. Updated April 2026.
Method
Signal: Rank(Earnings Yield DESC) + Rank(ROCE DESC), buy top 30. Exclude Financial Services and Utilities. Universe: Per-exchange market cap thresholds in local currency (India: Rs.20B, Indonesia: IDR 5T, US: $1B, UK: GBP500M, Japan: JPY100B, Korea: W500B, Germany: E500M, etc.) Period: 2000-2025 (25.8 years, 103 quarterly periods) Rebalancing: Quarterly (January, April, July, October), equal weight Execution: Next-day close (MOC). Signal computed at quarter-end close, portfolio rebalanced at the following trading day's close. Transaction costs: Size-tiered (0.1% for >$10B, 0.3% for $2-10B, 0.5% for <$2B, one-way) Cash rule: Hold cash if fewer than 10 stocks qualify Benchmark: Local market index where available (Sensex, FTSE 100, Nikkei, DAX, KOSPI, OMX Stockholm 30, SMI, etc.). S&P 500 used for exchanges without a local index in the data (see table). Exchanges tested: 16 (SAO/Brazil and ASX/Australia excluded due to fatal adjClose data quality issues. PAR/France excluded, zero qualifying stocks across all periods. TLV/Israel not rerun in this batch.)
Same formula, same parameters, same rebalance dates. The only variable is the stock universe and its local-currency market cap threshold.
Important note on thresholds: FMP stores market cap in local currency, not USD. A naive marketCap > 1000000000 filter means $1B in the US but only IDR 1B (~$65K) in Indonesia or Rs.1B (~$12M) in India. Previous versions of this analysis used a flat $1B numerical threshold globally, which captured micro-cap stocks in non-USD markets. This version uses exchange-specific thresholds calibrated to target liquid, investable companies (~$200-500M USD equivalent). The correction materially changed results for Indonesia, Korea, and Thailand.
Execution note: This version uses next-day close (market-on-close) execution. The signal is computed from quarter-end financial data. Trades execute at the next trading day's close, reflecting realistic execution. Earlier versions used same-day pricing, which overstated returns by 1-2% CAGR in faster-moving markets.
For full methodology and the Greenblatt ranking system, see the main US Magic Formula post.
The Screen (SQL)
WITH base AS (
    SELECT
        k.symbol,
        p.companyName,
        p.exchange,
        p.sector,
        k.earningsYieldTTM as earnings_yield,
        k.returnOnCapitalEmployedTTM as roce,
        k.marketCap / 1e9 as market_cap_billions
    FROM key_metrics_ttm k
    JOIN profile p ON k.symbol = p.symbol
    WHERE k.earningsYieldTTM > 0
      AND k.returnOnCapitalEmployedTTM > 0
      AND k.marketCap > 1000000000  -- Adjust per exchange (see note below)
      AND p.sector NOT IN ('Financial Services', 'Utilities')
      -- Change exchange filter per market:
      AND p.exchange IN ('NSE')
)
-- Per-exchange thresholds (local currency):
-- India: k.marketCap > 20000000000 (₹20B, ~$240M USD)
-- Indonesia: k.marketCap > 5000000000000 (IDR 5T, ~$310M USD)
-- Korea: k.marketCap > 500000000000 (₩500B, ~$370M USD)
-- US: k.marketCap > 1000000000 ($1B USD)
-- Germany: k.marketCap > 500000000 (€500M, ~$545M USD)
-- See backtests/cli_utils.py for full threshold map
,
ranked AS (
    SELECT *,
        RANK() OVER (ORDER BY earnings_yield DESC) AS ey_rank,
        RANK() OVER (ORDER BY roce DESC) AS roce_rank
    FROM base
)
SELECT symbol, companyName, exchange, sector,
       ROUND(earnings_yield * 100, 2) as ey_pct,
       ROUND(roce * 100, 2) as roce_pct,
       ey_rank, roce_rank,
       (ey_rank + roce_rank) as combined_rank,
       ROUND(market_cap_billions, 1) as mcap_bn
FROM ranked
ORDER BY combined_rank ASC
LIMIT 30
Run this query on Ceta Research
Full Results
Sorted by excess CAGR over each exchange's local benchmark. 16 exchanges tested. SAO (Brazil) and ASX (Australia) excluded due to fatal adjClose data quality issues. PAR (France) excluded, zero qualifying stocks. TLV (Israel) not rerun in this batch.
| Exchange | CAGR | Benchmark | Excess CAGR | Sharpe | MaxDD | Beta | Cash Pds | Avg Stocks |
|---|---|---|---|---|---|---|---|---|
| UK (LSE) | 8.57% | FTSE 100 | +7.22% | 0.238 | -41.05% | 1.052 | 0/103 | 12.2 |
| India (NSE) | 17.14% | Sensex | +6.02% | 0.379 | -56.27% | 0.908 | 17/103 | 26.1 |
| Sweden (STO) | 8.41% | OMX Stockholm 30 | +5.24% | 0.301 | -50.08% | 0.980 | 0/103 | 24.8 |
| HKSE (HK) | 5.37% | Hang Seng | +3.60% | 0.080 | -65.06% | 1.075 | 0/103 | 19.8 |
| Switzerland (SIX) | 5.69% | SMI | +3.59% | 0.306 | -50.41% | 0.904 | 0/103 | 14.3 |
| Taiwan (TAI) | 7.49% | TAIEX | +3.11% | 0.326 | -50.08% | 0.493 | 21/103 | 27.8 |
| XETRA (Germany) | 8.09% | DAX | +2.97% | 0.353 | -43.67% | 0.498 | 0/103 | 17.2 |
| JPX (Japan) | 6.33% | Nikkei 225 | +2.93% | 0.274 | -69.11% | 0.894 | 0/103 | 28.0 |
| Korea (KSC) | 7.35% | KOSPI | +2.54% | 0.237 | -35.90% | 0.493 | 21/103 | 26.2 |
| US_MAJOR | 9.26% | S&P 500 | +1.24% | 0.310 | -52.97% | 1.077 | 0/103 | 24.3 |
| Thailand (SET) | 4.80% | SET Index | +1.05% | 0.105 | -54.28% | 0.694 | 17/103 | 23.3 |
| Canada (TSX) | 6.12% | TSX Comp | +1.04% | 0.174 | -63.82% | 1.080 | 0/103 | 25.3 |
| China (SHH) | 5.08% | SSE Comp | +0.89% | 0.074 | -68.98% | 1.110 | 0/103 | 22.3 |
| JNB (South Africa) | 8.62% | S&P 500* | +0.61% | -0.023 | -43.72% | 0.520 | 15/103 | 17.3 |
| JKT (Indonesia) | 7.71% | S&P 500* | -0.31% | 0.263 | -50.56% | 0.619 | 25/103 | 25.0 |
| Saudi Arabia | 1.69% | S&P 500* | -6.33% | -0.090 | -58.10% | 0.427 | 29/103 | 24.3 |
*Exchanges marked with S&P 500* don't have a local index in the dataset. Their excess return is still measured against SPY, which introduces a cross-currency mismatch. Treat those comparisons with caution.
The gap between top and bottom is still large. India's 17.14% CAGR vs Saudi Arabia's 1.69%. Same formula, same rules, same period. But the shift to local benchmarks changes the story. Fourteen of 16 exchanges beat their local index. Only Indonesia and Saudi Arabia show negative excess. The Magic Formula adds value in more markets than the old SPY-only comparison suggested.
The Three Standouts
The UK, India, and Sweden produced the largest excess returns. All three generated enough alpha to survive transaction costs, currency adjustments, and data quality concerns.
UK (8.57% CAGR, +7.22% vs FTSE 100)
The top excess return in the dataset. The FTSE 100 returned just 1.35% CAGR over 25 years, dragged down by heavy weightings in energy, pharma, and mining. The Magic Formula on LSE-listed stocks returned 8.57%, generating +7.22% annual excess. Zero cash periods. The max drawdown of -41.05% is one of the shallowest in the dataset.
The caveat: the average portfolio held only 12.2 stocks per quarter (vs 30 max). The GBP 500M threshold and sector exclusions leave a thinner universe. But the stocks that pass deliver. Beta of 1.052 and a Sharpe of 0.238. The UK's mid-cap space is deep enough for the formula to find quality at a discount, and the FTSE 100's structural sluggishness makes the relative comparison look strong.
India (17.14% CAGR, +6.02% vs Sensex)
This is a major correction from the previous version. The old analysis ran BSE+NSE combined, which inflated results due to 38% dual-listing overlap between the two exchanges. Stocks listed on both BSE and NSE were effectively double-counted. This version runs NSE only, which is the more liquid and representative exchange.
The correction dropped CAGR from 24.24% to 17.14% and excess from +13.12% to +6.02%. Still the second-best excess return, but far more honest. India had 17 cash periods (up from 7 with the combined universe), reflecting the thinner qualifying pool on NSE alone. The Sharpe of 0.379 is the highest in the dataset. Max drawdown of -56.27%.
India's large-cap universe expanded rapidly from 2005 onward. High-quality, cheap companies were abundant and under-followed. The Magic Formula caught them systematically. Full India analysis.
Sweden (8.41% CAGR, +5.24% vs OMX Stockholm 30)
Previously buried in the middle of the pack. Sweden's OMX Stockholm 30 is a growth-heavy tech index that underperformed significantly over 2000-2025. The Magic Formula, skewing toward cheap industrials and consumer companies, avoided that exposure. Sharpe of 0.301, max drawdown of -50.08%, beta of 0.980, zero cash periods.
The Middle: Positive but Modest
Eleven exchanges show positive excess returns beyond the top three, ranging from +3.60% (Hong Kong) down to +0.89% (China). Several of these were negative or near-zero under the old SPY comparison.
Hong Kong (5.37% CAGR, +3.60% vs Hang Seng)
Previously showed -3.11% excess vs SPY. Against the Hang Seng, the formula outperformed significantly. Hong Kong's local index has suffered structurally since 2018, and the formula's stock selection avoided some of the worst damage. Beta of 1.075 means roughly market-level exposure. The Sharpe of 0.080 is thin, though, and the -65.06% max drawdown is severe.
Switzerland (5.69% CAGR, +3.59% vs SMI)
The Swiss Market Index returned just 2.1% CAGR over 25 years, weighed down by slow-growth defensive giants (Nestle, Novartis, Roche). The Magic Formula on SIX-listed stocks returned 5.69% by finding cheaper, more capital-efficient companies outside the index's defensive heavyweights. Sharpe of 0.306, beta of 0.904. Zero cash periods, but a thin universe at 14.3 stocks per quarter on average.
Taiwan (7.49% CAGR, +3.11% vs TAIEX)
Flipped from -1.07% (vs SPY) to solidly positive. 21 cash periods. Taiwan's tech-heavy market concentrates the qualifying pool. The Sharpe of 0.326 is decent, and the low beta (0.493) means the formula picked defensive names relative to the broader market.
Germany (8.09% CAGR, +2.97% vs DAX)
A clear winner once measured against the DAX instead of SPY. The Sharpe of 0.353 is strong, and the beta of 0.498 is the lowest among positive-excess exchanges. Germany's Mittelstand companies (mid-sized industrials) fit the ROCE profile well, and the portfolio's low market sensitivity is appealing. The E500M threshold targets established mid-cap industrials (~$545M USD). Zero cash periods.
Japan (6.33% CAGR, +2.93% vs Nikkei 225)
Japan produced solid results once measured against the Nikkei. Zero cash periods, 28 stocks per quarter on average, and a 0.274 Sharpe. The -69.11% max drawdown is the deepest in the dataset (driven by the 2008 crisis), but the formula outperformed the Nikkei in most years. The formula found cheap, capital-efficient Japanese manufacturers and exporters that the Nikkei's heavy weighting in tech giants undervalued.
Korea (7.35% CAGR, +2.54% vs KOSPI)
Flipped from -1.02% vs SPY to positive vs KOSPI. 21 cash periods and a low beta of 0.493. Korea's chaebol governance discount may not translate into alpha vs global benchmarks, but the formula does pick stocks that outrun the local market. The -35.90% max drawdown is the shallowest in the entire dataset.
US (9.26% CAGR, +1.24% vs S&P 500)
The baseline. Zero cash periods, 24 stocks per quarter, reliable execution. The alpha is real but modest, and most of it came before 2014. The last decade has been painful for US value strategies. Full analysis in the US post.
Thailand (4.80% CAGR, +1.05% vs SET Index)
A modest improvement from the previous version. The SET Index itself has been a poor performer. 17 cash periods, -54.28% max drawdown. The formula adds a thin margin of value over the local market.
Canada (6.12% CAGR, +1.04% vs TSX Composite)
Barely positive vs the TSX Composite, after showing -1.08% vs SPY. The Canadian market is dominated by energy, mining, and financials. Energy and mining have volatile ROCE. Financials are excluded. What's left is a thin universe. Zero cash periods but mediocre picks.
China (5.08% CAGR, +0.89% vs SSE Composite)
The formula barely edges out the SSE Composite on Shanghai-listed stocks. 0.074 Sharpe and -68.98% max drawdown. State-owned enterprises often show high reported ROCE but deliver poor shareholder returns. The signal works, but just barely.
The Underperformers
South Africa (8.62% CAGR, +0.61% vs S&P 500*)
The Johannesburg Stock Exchange (JNB) returned 8.62% CAGR. No local JSE benchmark is available in the dataset, so the +0.61% excess is measured against SPY, introducing a currency mismatch. The -43.72% max drawdown is moderate. Beta is low at 0.520. The Sharpe of -0.023 is effectively zero, reflecting high volatility. 15 cash periods. Treat the excess figure with caution given the currency issue.
Indonesia (7.71% CAGR, -0.31% vs S&P 500*)
This is a correction. An earlier version of this analysis reported Indonesia as the "best risk-adjusted result" with a 0.725 Sharpe and 19.58% CAGR. Those numbers were wrong. The old analysis used a IDR 1B threshold (~$65K USD), which captured companies too small to trade in practice. Illiquid micro-caps show artificially low volatility, inflating the Sharpe ratio.
With a proper IDR 5T threshold (~$310M USD targeting liquid, investable companies), Indonesia returned 7.71% CAGR with a 0.263 Sharpe and -50.56% max drawdown. The strategy was in cash for 25 of 103 periods. No local index is available in the data, so the -0.31% excess is still vs SPY (cross-currency). Full Indonesia analysis.
Saudi Arabia (1.69% CAGR, -6.33% vs S&P 500*)
The worst result in the dataset. 29 cash periods. Negative Sharpe (-0.090). The Tadawul only opened to foreign investors in 2015. The early years run on a limited, thinly traded universe.
Excluded Exchanges
SAO (Brazil): Previously showed 19.70% CAGR, +10.75% vs Bovespa. Excluded due to fatal adjClose data quality issues (split adjustment artifacts in FMP data). Can't be rerun with reliable price data.
ASX (Australia): Previously showed 3.52% CAGR, -0.68% vs ASX 200. Excluded for the same adjClose data quality issues.
PAR (France): Zero qualifying stocks in any period. Likely a data coverage issue rather than a genuine absence of cheap, high-ROCE French companies.
TLV (Israel): Not rerun in this batch. Previous result was 5.64% CAGR, -2.38% vs S&P 500*.
Why the UK and India Win
Two factors explain the concentration of alpha in these markets.
Analyst coverage. India's Rs.20B+ stocks average far fewer sell-side analysts than US equivalents. UK mid-caps outside the FTSE 100 are similarly undercovered relative to their US peers. Fewer eyeballs means the market takes longer to reprice a mispricing. The Magic Formula is a simple screen. Simple screens work best when nobody else is running them.
Benchmark weakness. The FTSE 100 returned just 1.35% CAGR over 25 years, making it one of the weakest major benchmarks globally. Any strategy with positive real returns looks good against that baseline. India's Sensex at 11.12% CAGR is stronger, but the formula's 17.14% still clears it by a wide margin. Both markets have deep enough stock pools to populate the portfolio (26+ and 12+ stocks per quarter respectively) while remaining inefficient enough for the signal to work.
The Benchmark Lesson
The shift from all-SPY to local benchmarks changed the picture considerably.
Under the old approach, comparing local-currency returns against a USD benchmark inflated apparent alpha for depreciating currencies and understated it for appreciating ones. India's INR lost roughly 60% vs USD over 25 years. Measuring INR returns against SPY made the alpha look enormous but also mixed in currency depreciation noise.
Local benchmarks solve this by keeping everything in the same currency. India's 17.14% CAGR vs Sensex's 11.12% is a clean, same-currency comparison. Germany's 8.09% vs DAX's 5.12% is euros vs euros.
The exchanges that flipped tell the real story:
| Exchange | Excess vs SPY (old) | Excess vs Local (new) | Change |
|---|---|---|---|
| LSE (UK) | N/A | +7.22% | New (strong) |
| STO (Sweden) | +0.12% | +5.24% | Significantly underrated |
| HKSE (Hong Kong) | -3.11% | +3.60% | Flipped to positive |
| SIX (Switzerland) | N/A | +3.59% | New (positive) |
| TAI (Taiwan) | -1.07% | +3.11% | Flipped to positive |
| XETRA (Germany) | +1.66% | +2.97% | Underrated |
| JPX (Japan) | N/A | +2.93% | New (positive) |
| KSC (Korea) | -1.02% | +2.54% | Flipped to positive |
| China | -2.15% | +0.89% | Flipped to positive |
| Canada | -1.08% | +1.04% | Flipped to positive |
| SET (Thailand) | -4.05% | +1.05% | Flipped to positive |
Eight exchanges show positive alpha vs local indices that wasn't visible in the old SPY comparison. The formula's stock selection was adding value all along. The old benchmark just couldn't see it.
For exchanges still compared against SPY (Indonesia, Saudi Arabia, South Africa), the cross-currency mismatch remains. Those numbers should be treated as approximate. Sweden, Switzerland, and Thailand now have local benchmarks (OMX Stockholm 30, SMI, SET Index), making those comparisons cleaner.
The Market Cap Threshold Lesson
This analysis corrected a significant error from earlier versions. The original backtests used marketCap > 1000000000 as a universal filter. In the US, that's $1B, a reasonable investability floor. In Indonesia, it's IDR 1B, approximately $65,000 USD. That's not a company, it's a corner shop.
The corrections were dramatic:
| Exchange | Old CAGR | New CAGR | Threshold Change |
|---|---|---|---|
| Indonesia | 19.58% | 7.71% | IDR 1B -> IDR 5T (5000x) |
| Thailand | 9.54% | 4.80% | B1B -> B10B (10x) |
| Korea | 11.96% | 7.35% | W1B -> W500B (500x) |
| India | 21.25% | 17.14% | Rs.1B -> Rs.20B (20x), NSE only |
Indonesia's "best risk-adjusted returns" were entirely micro-cap noise. Thailand dropped from marginal outperformer to barely positive. Korea lost its positive excess vs SPY, but gained positive excess vs KOSPI.
India's correction is notable: the old combined BSE+NSE analysis at 24.25% CAGR dropped to 17.14% once BSE was removed (38% dual-listing overlap was inflating results). The stricter threshold plus NSE-only universe gives a more honest picture.
The lesson generalizes: always check local currency equivalents before applying exchange filters to non-USD markets.
Limitations
Survivorship bias. Exchange membership uses current company profiles. Companies that delisted, went bankrupt, or were acquired aren't captured retrospectively. This biases returns upward across all exchanges, but the bias is likely larger in volatile emerging markets.
Incomplete local benchmarks. Three exchanges (Indonesia, Saudi Arabia, South Africa) don't have a local index in the dataset. Their excess returns are measured against SPY, which introduces a cross-currency mismatch. Results for these exchanges should be treated as directional, not precise.
Data quality exclusions. SAO (Brazil) and ASX (Australia) were excluded due to fatal adjClose data quality issues in FMP data (split adjustment artifacts). Their previous results (19.70% and 3.52% CAGR respectively) should not be relied upon.
Different market structures. Trading hours, settlement cycles, short-selling rules, and foreign ownership limits vary by exchange. The backtest assumes you can buy any qualifying stock at the rebalance date, which isn't always true.
Data coverage varies. FMP's coverage is deeper for US stocks than emerging markets. PAR (France) had zero qualifying stocks, likely due to data gaps. Results reflect data availability as much as strategy performance.
Sector composition. Excluding Financials and Utilities removes different proportions of each market. Financials make up ~30% of some markets vs ~15% of US exchanges.
Concentrated portfolios. 30 stocks per quarter is concentrated. In smaller markets (UK with 12.2 average, SIX with 14.3), the portfolio is even more concentrated.
Transaction costs are estimated. We use the same size-tiered cost model globally. Real costs in Indonesia or Saudi Arabia are higher than in the US.
What This Means
The Magic Formula beats local benchmarks in 14 of 16 exchanges. That's a broader result than the original analysis suggested.
The UK (+7.22% vs FTSE 100) and India (+6.02% vs Sensex) lead the pack. Sweden (+5.24% vs OMX Stockholm 30), Hong Kong (+3.60% vs Hang Seng), Switzerland (+3.59% vs SMI), Taiwan (+3.11% vs TAIEX), Germany (+2.97% vs DAX), Japan (+2.93% vs Nikkei), and Korea (+2.54% vs KOSPI) all add meaningful alpha against their local indices. The formula adds value in most markets where there's enough data to run it.
The shift to local benchmarks matters. The old BSE+NSE combined analysis made India look like a +13% alpha machine. Against Sensex with NSE only, it's +6%. Still strong, but far more honest. Sweden looked like a flat trade at +0.12% vs SPY. Against the OMX Stockholm 30, it's +5.24%. Switzerland shows +3.59% vs SMI.
For investors: the Magic Formula is a global strategy, not just an emerging market one. It works best where analyst coverage is thin and benchmarks are structurally weak, but it adds value in most developed markets too when measured against the right benchmark.
Part of a Series
This is the global comparison post. Individual exchange analyses with year-by-year breakdowns:
- Magic Formula on US Stocks (NYSE + NASDAQ + AMEX) - 9.26% CAGR, the baseline
- Magic Formula on Indian Stocks - 17.14% CAGR, the standout performer (NSE only, corrected from BSE+NSE)
- Magic Formula on Indonesian Stocks (JKT) - 7.71% CAGR, corrected from earlier analysis
Run This Screen Yourself
Via web UI: Run the Magic Formula screen on Ceta Research. Change the exchange filter and market cap threshold in the SQL to screen any market.
Via Python:
# Clone the backtest repo
git clone https://github.com/ceta-research/backtests.git
cd backtests

# Run the screen for a specific exchange
export CR_API_KEY="your-api-key"
python3 magic-formula/screen.py --exchange NSE

# Run the full global comparison
python3 magic-formula/run_all_exchanges.py
Get your API key at cetaresearch.com. The full backtest code (Python + DuckDB) is on GitHub.
Data: Ceta Research (FMP financial data warehouse). 16 exchanges tested, quarterly rebalance, equal weight top 30, 2000-2025. Next-day close (MOC) execution. Size-tiered transaction costs. Per-exchange market cap thresholds in local currency. Benchmarked against local market indices where available, S&P 500 otherwise.
Past performance does not guarantee future results. This is educational content, not investment advice.


