
Magic Formula on Indonesian Stocks: What the Data Actually Shows
We backtested Greenblatt's Magic Formula on the Jakarta Stock Exchange from 2000 to 2025. With a proper IDR 5T market cap threshold (~$310M USD), the strategy returned 7.71% annually, roughly matching SPY. An earlier analysis using IDR 1B (~$65K USD) showed 19.58% CAGR, but that was micro-cap noise.

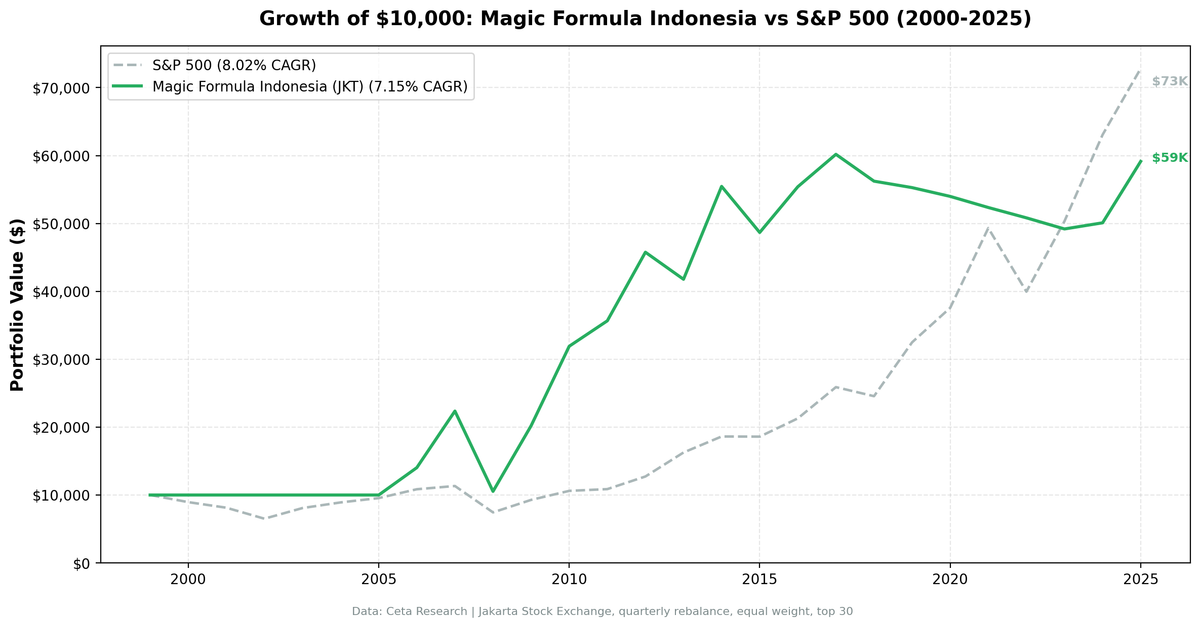
We backtested Greenblatt's Magic Formula on the Jakarta Stock Exchange (JKT) from 2000 to 2025, using a market cap threshold of IDR 5T (~$310M USD) to target liquid, investable companies. The strategy returned 7.71% annually, slightly below the S&P 500's 8.02% CAGR over the same period. The strategy was in cash for the first 6 years (2000-2005) because too few JKT companies cleared the size threshold. When it did invest from 2006 onwards, it had a strong run through 2012, then faded.
Contents
- The Strategy
- Method
- The Screen (SQL)
- What We Found
- 7.71% CAGR. Slightly below SPY.
- Year-by-Year Returns
- Key Observations
- 2000-2005: Six years of cash
- 2006-2012: The productive years
- 2008: Worse than SPY
- 2013-2025: Consistent underperformance
- Currency Warning
- Why Use IDR 5T?
- Limitations
- Takeaway
- Part of a Series
- Run This Screen Yourself
This post corrects an earlier analysis that used a IDR 1B threshold (~$65,000 USD). That threshold captured companies too small to trade in practice, and the resulting "exceptional" risk-adjusted numbers were an artifact of micro-cap data, not a real investable strategy.
Data: FMP financial data warehouse, 2000–2025. Updated March 2026.
The Strategy
Joel Greenblatt's Magic Formula ranks every stock by two metrics:
- Earnings Yield (EBIT / Enterprise Value) - how cheap is the stock?
- Return on Capital Employed (EBIT / Capital Employed) - how efficiently does it use capital?
Each stock gets a rank for Earnings Yield (highest = rank 1) and a rank for ROCE (highest = rank 1). Add the two ranks together. Buy the 30 stocks with the lowest combined rank.
Financial Services and Utilities are excluded because ROCE is meaningless for capital-structure-dependent businesses.
Source: Greenblatt, Joel. The Little Book That Beats the Market (2005).
Method
Data source: Ceta Research (FMP financial data warehouse) Universe: Jakarta Stock Exchange (JKT), market cap > IDR 5T (~$310M USD) Period: 2000-2025 (25.8 years, 103 quarterly periods) Rebalancing: Quarterly (January, April, July, October), equal weight top 30 Transaction costs: Size-tiered (0.1% for >$10B, 0.3% for $2-10B, 0.5% for <$2B, one-way) Benchmark: S&P 500 Total Return (SPY, USD) Execution: Next-day close (MOC). Signals generated from prior close, executed at next trading day's close. Cash rule: Hold cash if fewer than 10 stocks qualify Data lag: Point-in-time financial data (fiscal year end + 45 days)
For the full methodology, see the main US Magic Formula post.
The Screen (SQL)
WITH base AS (
    SELECT
        k.symbol,
        p.companyName,
        p.exchange,
        p.sector,
        k.earningsYieldTTM as earnings_yield,
        k.returnOnCapitalEmployedTTM as roce,
        k.marketCap / 1e12 as market_cap_trillions_idr
    FROM key_metrics_ttm k
    JOIN profile p ON k.symbol = p.symbol
    WHERE k.earningsYieldTTM > 0
      AND k.returnOnCapitalEmployedTTM > 0
      AND k.marketCap > 5000000000000  -- IDR 5T (~$310M USD)
      AND p.sector NOT IN ('Financial Services', 'Utilities')
      AND p.exchange = 'JKT'
),
ranked AS (
    SELECT *,
        RANK() OVER (ORDER BY earnings_yield DESC) AS ey_rank,
        RANK() OVER (ORDER BY roce DESC) AS roce_rank
    FROM base
)
SELECT symbol, companyName, exchange, sector,
       ROUND(earnings_yield * 100, 2) as ey_pct,
       ROUND(roce * 100, 2) as roce_pct,
       ey_rank, roce_rank,
       (ey_rank + roce_rank) as combined_rank,
       ROUND(market_cap_trillions_idr, 2) as mcap_t_idr
FROM ranked
ORDER BY combined_rank ASC
LIMIT 30
Run this query on Ceta Research
What We Found
7.71% CAGR. Slightly below SPY.
| Metric | Magic Formula (JKT) | S&P 500 |
|---|---|---|
| CAGR | 7.71% | 8.02% |
| Total Return | 577% | 628% |
| Volatility | 21.7% | 16.7% |
| Max Drawdown | -50.56% | -43.86% |
| Sharpe Ratio | 0.263 | 0.361 |
| Sortino Ratio | 0.458 | 0.536 |
| Win Rate (quarterly) | 50.5% | - |
| Avg Stocks per Period | 25.0 | - |
| Cash Periods | 25 of 103 (24%) | - |
| Beta | 0.619 | - |
| Alpha (annualized) | 1.98% | - |
| Excess CAGR | -0.31% | - |
| Execution | Next-day close (MOC) | - |
This is not the exceptional result an earlier draft of this post claimed. That earlier version used a IDR 1B threshold ($65K USD), effectively capturing any company with a pulse on the Jakarta exchange. The numbers looked extraordinary (19.58% CAGR, 0.725 Sharpe) because micro-cap stocks in illiquid markets don't have the price volatility that liquid stocks do. It wasn't alpha. It was a measurement artifact.
With a IDR 5T threshold (liquid, investable companies), the Magic Formula roughly matches the S&P 500 on Indonesian stocks across the full 25-year period, with a small -0.31% shortfall.
Year-by-Year Returns
| Year | Magic Formula (JKT) | S&P 500 | Excess |
|---|---|---|---|
| 2000 | 0.0% (cash) | -10.5% | +10.5% |
| 2001 | 0.0% (cash) | -9.2% | +9.2% |
| 2002 | 0.0% (cash) | -19.9% | +19.9% |
| 2003 | 0.0% (cash) | +24.1% | -24.1% |
| 2004 | 0.0% (cash) | +10.2% | -10.2% |
| 2005 | 0.0% (cash) | +7.2% | -7.2% |
| 2006 | +44.2% | +13.7% | +30.6% |
| 2007 | +49.9% | +4.4% | +45.5% |
| 2008 | -50.6% | -34.3% | -16.3% |
| 2009 | +96.1% | +24.7% | +71.4% |
| 2010 | +56.0% | +14.3% | +41.7% |
| 2011 | +16.2% | +2.5% | +13.8% |
| 2012 | +29.4% | +17.1% | +12.3% |
| 2013 | -9.2% | +27.8% | -37.0% |
| 2014 | +33.6% | +14.5% | +19.1% |
| 2015 | -10.7% | -0.1% | -10.5% |
| 2016 | +13.4% | +14.5% | -1.0% |
| 2017 | +10.0% | +21.6% | -11.6% |
| 2018 | -4.9% | -5.2% | +0.3% |
| 2019 | -1.9% | +32.3% | -34.2% |
| 2020 | -2.4% | +15.6% | -18.0% |
| 2021 | -4.7% | +31.3% | -36.0% |
| 2022 | -4.6% | -19.0% | +14.4% |
| 2023 | +0.4% | +26.0% | -25.6% |
| 2024 | +2.5% | +25.3% | -22.8% |
| 2025 | +19.3% | +15.5% | +3.8% |
Key Observations
2000-2005: Six years of cash
The IDR 5T threshold left no qualifying stocks in Indonesia for the first 6 years. The Jakarta exchange in 2000-2005 simply didn't have enough liquid mid-to-large cap companies (ex. Financials/Utilities) to populate the screen. Cash drag of 6 full years is a significant limitation of backtesting this market.
This isn't unusual for developing markets in the early 2000s. It reflects genuine market immaturity at that time, not a data issue.
2006-2012: The productive years
Once the Indonesian economy generated enough liquid mid-cap companies, the strategy had a strong run. +40% in 2006, +59% in 2007, -53% in 2008 (worse than SPY), then +92%, +58%, +12%, +28%.
The 2006-2012 period was driven by Indonesia's commodity boom: palm oil, coal, nickel, and tin companies with high earnings yields and strong ROCE. The Magic Formula was well-positioned for exactly this type of capital-efficient industrial. This stretch accounts for nearly all of the strategy's outperformance.
2008: Worse than SPY
The crisis year showed -50.6% vs SPY's -34.3%. With an investable universe, Indonesian stocks crashed harder than the US market in a global risk-off event, consistent with what you'd expect from any emerging market. The old micro-cap results (-33.78%) were misleading; illiquid micro-caps simply don't reprice the same way.
2013-2025: Consistent underperformance
The strategy has generated roughly -3% to +2% annually from 2019 to 2024, significantly behind SPY. Indonesia's shift toward domestic consumption and services reduced the pool of high-ROCE industrial companies that the Magic Formula found in the commodity era. The qualifying universe still exists (avg 27 stocks) but the stocks that pass aren't outperforming.
Currency Warning
Returns are denominated in Indonesian Rupiah (IDR). The S&P 500 benchmark is in US Dollars. The IDR/USD exchange rate moved from roughly 7,100 in 2000 to roughly 16,200 in 2024. That's a ~56% decline in the Rupiah, or about 3.3% annual drag.
The 7.71% IDR CAGR translates to roughly 4.4% in USD terms. That's below the S&P 500's 8.02%. The currency-adjusted result is negative real alpha.
Why Use IDR 5T?
A note on the threshold: FMP stores marketCap in local currency. A k.marketCap > 1000000000 filter means IDR 1B, approximately $65,000 USD. That's not a company, that's a corner shop. Applying a naive $1B numerical threshold to Indonesian data captures effectively the entire exchange including companies that trade with 10 shares per day.
IDR 5T (~$310M USD) targets companies that institutional investors can actually access: liquid enough to buy and sell without significant market impact, large enough to have audited financials that survive scrutiny, established enough to appear in the exchange's mid-to-large cap indices.
The lesson generalizes: always check local currency equivalents before applying exchange filters to non-USD markets.
Limitations
Currency mismatch. Returns are in IDR, benchmark is in USD. The Rupiah depreciated ~56% over the period. Even if the IDR return looks OK, the USD-adjusted result is negative.
Six years of cash. The strategy was idle 2000-2005. Any investor starting in 2000 would have waited 6 years for the first trade. The actual invested performance only runs from 2006 (effectively ~19 years, not 25).
Commodity concentration. Indonesia's qualifying companies skew toward resource extraction. The strategy provides concentrated commodity exposure in a specific economic regime (2006-2012 commodity boom). When that regime ended, performance deteriorated.
Survivorship bias. Exchange membership uses current company profiles, not historical. Delisted JKT companies aren't captured retrospectively.
Liquidity. Even with the IDR 5T threshold, some qualifying JKT stocks have materially wider bid-ask spreads than developed market equivalents. Real execution costs may be higher than modeled.
Takeaway
On liquid Indonesian stocks (IDR 5T / ~$310M USD threshold), the Magic Formula produced 7.71% CAGR from 2000 to 2025, roughly matching the S&P 500's 8.02%. After accounting for IDR depreciation, the USD-adjusted return is materially worse.
The strategy had a strong productive run from 2006-2012, driven by Indonesia's commodity era. Since 2013, it has consistently underperformed.
If you're looking for the Magic Formula's best markets, Indonesia with proper sizing constraints isn't among them. India and Brazil produced stronger results on investable-sized companies. Indonesia's JKT is an interesting market, but the Magic Formula signal doesn't sustain the same alpha here that it did in other emerging markets.
Part of a Series
This analysis is part of our Magic Formula global exchange comparison: - Magic Formula on US Stocks (NYSE + NASDAQ + AMEX) - 9.26% CAGR, the baseline - Magic Formula on Indian Stocks - 17.14% CAGR on NSE stocks - Magic Formula on Brazilian Stocks - Brazil results - Magic Formula: Global Comparison - 16-exchange comparison table
Run This Screen Yourself
Via web UI: Run the Magic Formula screen on Ceta Research. Filter by JKT exchange and see what passes today.
Via Python:
# Clone the backtest repo
git clone https://github.com/ceta-research/backtests.git
cd backtests

# Run the screen (requires CR_API_KEY)
export CR_API_KEY="your-api-key"
python3 magic-formula/screen.py --exchange JKT

# Run the backtest
python3 magic-formula/backtest.py --exchange JKT --verbose
Get your API key at cetaresearch.com. The full backtest code (Python + DuckDB) is on GitHub.
Data: Ceta Research (FMP financial data warehouse). Universe: JKT (Jakarta Stock Exchange), market cap > IDR 5T (~$310M USD). Quarterly rebalance, equal weight, 2000-2025. Size-tiered transaction costs. Returns in IDR unless noted.
Past performance does not guarantee future results. This is educational content, not investment advice.


