
Revenue Market Share Gainers in Germany: 3.7% CAGR vs Total-Return DAX
German market-share gainers returned 3.5% annually across 25 years, staying fully invested every period but underperforming by 4.3% annually. The signal finds stocks — it just doesn't find outperformers.

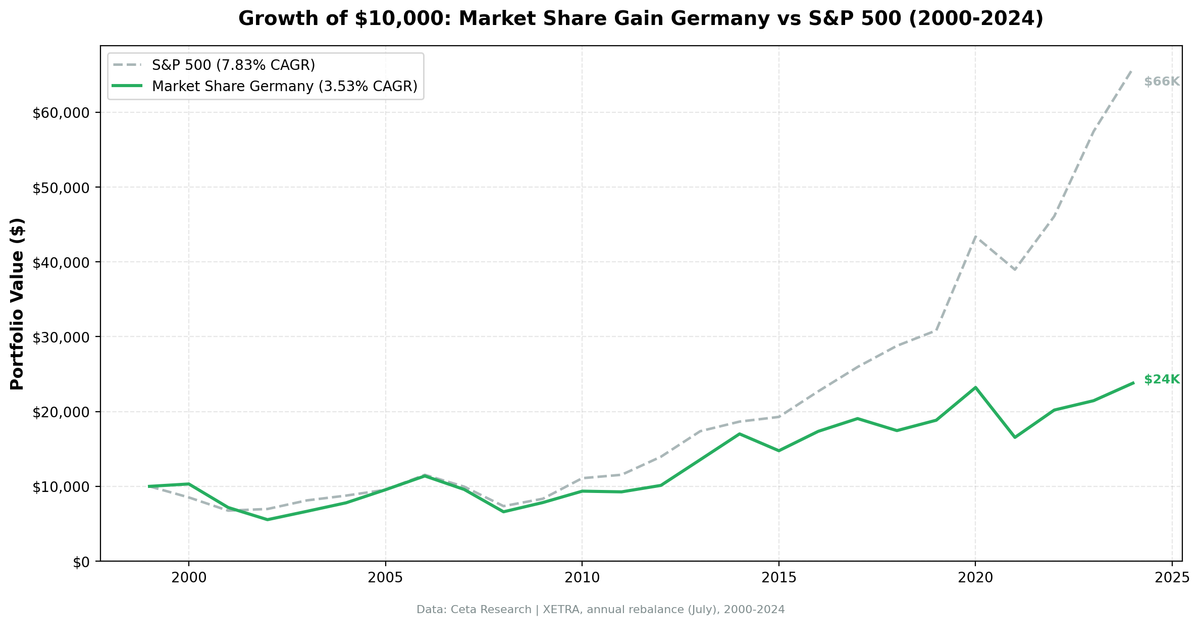
The market share signal never ran out of stocks in Germany. In all 25 years, the XETRA universe produced enough qualifying companies to stay fully invested. The signal found candidates consistently, but it couldn't keep pace with the DAX. CAGR of 3.71% vs the DAX's 5.04%, a -1.33% annual gap. That's a much narrower miss than the -4.30% gap when benchmarked against SPY.
Contents
- Method
- Key Finding
- Results Summary
- Annual Returns (2000-2024)
- When It Worked
- When It Failed
- Why Germany Is Different
- Simple Screen
- Limitations
- Takeaway
- References
One important context: the DAX is a total-return index, meaning it includes dividends reinvested. Most country indices (FTSE, SMI, TSX) are price-only. Comparing against the DAX is a strict test.
Data: FMP financial data warehouse, 2000–2025. Updated March 2026.
Method
We screened the XETRA universe for companies whose revenue grew at least 10 percentage points faster than their sector median year-over-year. To qualify, a company also needed ROE above 8% and operating profit margin above 5%. This filters out growth that comes from margin compression or loss-driven pricing.
- Signal: YoY revenue growth exceeds sector median by ≥ 10 percentage points
- Quality filters: ROE > 8%, operating profit margin > 5%
- Universe: XETRA, market cap > EUR 500M
- Portfolio: Equal weight, top 30 by revenue growth outperformance
- Rebalancing: Annual, July (45-day lag for point-in-time data)
- Cash rule: Hold cash if fewer than 10 names qualify
- Data quality guards: Entry price > $1, single-period return capped at 200%
- Benchmark: DAX (^GDAXI, total-return index)
- Period: 2000-2024 (25 years)
The 45-day lag applies the same point-in-time rigor used across all exchanges in this study. The DAX benchmark is a performance index (total return, dividends reinvested), which differs from the price-only indices used as benchmarks in other country studies in this series.
Key Finding
0% cash periods across all 25 years is notable. Germany's large industrial universe (chemicals, automotive, engineering, machinery) produces enough companies hitting the 10pp excess growth threshold in almost every environment. The signal is never starved for candidates.
But candidate availability doesn't mean the signal adds value. The 36% win rate (9 of 25 years beating the DAX) and -1.33% annual excess return indicate the signal consistently selects companies that don't match the total-return benchmark over the holding period.
The down capture vs the DAX is 83.82%. That means in years when the DAX fell, this portfolio fell roughly 84 cents for every dollar the index lost. That's better than 1:1 with the benchmark's drawdowns, a modestly defensive characteristic. The max drawdown of -46.93% vs the DAX's larger drawdowns in the same window shows the quality screen does offer some protection in severe sell-offs.
Compare this to the old SPY-benchmarked result, where down capture was 120.39%. The improvement to 83.82% against the local benchmark reflects that the DAX and this portfolio are exposed to similar German macro cycles, whereas SPY comparisons introduced a cross-market dynamic that made Germany look worse than it is.
Results Summary
| Metric | Strategy | DAX |
|---|---|---|
| CAGR (2000-2024) | 3.71% | 5.04% |
| Total Return | +148.48% | — |
| Max Drawdown | -46.93% | — |
| Sharpe Ratio | 0.087 | — |
| Sortino Ratio | 0.129 | — |
| Win Rate vs DAX | 36% (9/25 years) | — |
| Down Capture | 83.82% | — |
| Up Capture | 81.05% | — |
| Beta | 0.832 | — |
| Avg Stocks Held | 18.2 | — |
| Cash Periods | 0/25 years | — |
Total return context: $10,000 invested in 2000 grew to $24,800 on this strategy. The DAX, as a total-return index, compounded higher over the same window.
Annual Returns (2000-2024)
| Year | Strategy | DAX | Excess |
|---|---|---|---|
| 2000 | +1.04% | -12.21% | +13.24% |
| 2001 | -32.12% | -31.32% | -0.80% |
| 2002 | -21.82% | -22.76% | +0.94% |
| 2003 | +21.63% | +23.38% | -1.75% |
| 2004 | +18.82% | +15.62% | +3.20% |
| 2005 | +21.95% | +23.56% | -1.61% |
| 2006 | +19.26% | +39.31% | -20.05% |
| 2007 | -15.85% | -20.77% | +4.92% |
| 2008 | -31.46% | -25.17% | -6.30% |
| 2009 | +20.37% | +23.64% | -3.27% |
| 2010 | +19.19% | +27.58% | -8.38% |
| 2011 | -2.27% | -12.72% | +10.45% |
| 2012 | +8.87% | +21.78% | -12.91% |
| 2013 | +37.99% | +25.29% | +12.70% |
| 2014 | +23.74% | +11.99% | +11.75% |
| 2015 | -12.69% | -12.53% | -0.16% |
| 2016 | +18.16% | +28.49% | -10.33% |
| 2017 | +9.83% | -1.90% | +11.73% |
| 2018 | -9.87% | +2.36% | -12.23% |
| 2019 | +8.29% | +0.65% | +7.64% |
| 2020 | +22.94% | +24.12% | -1.19% |
| 2021 | -26.89% | -18.38% | -8.50% |
| 2022 | +22.69% | +25.89% | -3.21% |
| 2023 | +6.28% | +14.26% | -7.98% |
| 2024 | +13.15% | +29.47% | -16.33% |
Returns are July-to-July.
When It Worked
2013-2014 was the strategy's best consecutive run. Germany in 2013: +37.99% vs DAX's +25.29% (+12.70% excess). Germany in 2014: +23.74% vs DAX's +11.99% (+11.75% excess). The post-Euro-crisis recovery years created clear winners and laggards in German industry. Companies genuinely taking share in automotive supply chains, industrial equipment, and specialty chemicals stood out from the sector medians. The signal had real information content during a recovery phase.
2000: +1.04% vs -12.21% (+13.24% excess). The dot-com bust barely touched the German industrial strategy. XETRA's sector composition, heavy on real economy companies and light on tech, meant the signal selected companies insulated from the collapse.
2017: +9.83% vs -1.90% (+11.73% excess). One of the stronger single-year showings. The sector-relative filter picked up genuine industrial share gainers in a year the DAX total return index itself turned slightly negative (partially a dividend-timing effect in the July-July window).
When It Failed
2006: +19.26% vs +39.31% (-20.05% excess). The largest single-year miss. The DAX had an exceptional year driven by broad German industrial expansion. In a year when the entire sector rises sharply, the sector-relative filter's marginal picks don't have the same lifting effect as simply owning the index.
2024: +13.15% vs +29.47% (-16.33% excess). The second-worst single-year excess. German equities broadly re-rated higher, led by large-cap names in automotive and industrials. The equal-weight portfolio of sector-relative gainers didn't capture that large-cap re-rating.
2021: -26.89% vs -18.38% (-8.50% excess). Post-COVID German industrial companies faced simultaneous supply chain disruption, energy price shocks, and semiconductor shortages. Revenue growth figures were distorted by normalization effects. Companies that appeared to be taking market share in 2020 turned out to be benefiting from post-lockdown catch-up, not durable share gains. The July 2021 rebalance picked up many such false positives.
Why Germany Is Different
The structure of the German economy is the explanation. XETRA is dominated by cyclical industrials: automotive (VW, BMW, Mercedes), chemicals (BASF, Bayer), engineering (Siemens, ThyssenKrupp), and machinery. These sectors have a critical property: their revenue growth is highly correlated with the global economic cycle.
When the global economy grows, German industrial revenues grow across the board. The sector medians rise with the tide. A company beating its sector median by 10pp in a rising cycle is likely an industry leader, but it's also likely correlated with all other leaders. In the subsequent downturn, those same leaders fall together.
The DAX's total-return construction adds another layer. The DAX reinvests dividends, and German industrials are historically solid dividend payers. The strategy captures price appreciation without the dividend yield component, which is part of the persistent benchmark shortfall.
The 36% win rate against the DAX is partly structural. German industrials tend to outperform when the global cycle accelerates broadly. That's exactly the environment where sector-relative selection adds the least, because rising tides swamp the signal.
Compare this to Canada, where the sector-relative filter finds companies with durable demand within commodity sectors (down capture 55.06%), or Switzerland, where the signal naturally gravitates toward pharma and consumer goods. Germany's structural sector exposure and the DAX's total-return construction make this the most demanding comparison in the series.
Simple Screen
This is the core screen, adapted for XETRA. Run it in July, using prior fiscal year data.
WITH profile_data AS (
    SELECT DISTINCT symbol, sector
    FROM profile
    WHERE sector IS NOT NULL AND sector != ''
      AND exchange IN ('XETRA')
),
rev_current AS (
    SELECT symbol, revenue,
        ROW_NUMBER() OVER (PARTITION BY symbol ORDER BY dateEpoch DESC) AS rn
    FROM income_statement
    WHERE period = 'FY' AND revenue IS NOT NULL AND revenue > 0
),
rev_prior AS (
    SELECT symbol, revenue AS prior_revenue,
        ROW_NUMBER() OVER (PARTITION BY symbol ORDER BY dateEpoch DESC) AS rn
    FROM income_statement
    WHERE period = 'FY' AND revenue IS NOT NULL AND revenue > 0
),
growth AS (
    SELECT rc.symbol, pd.sector,
        (rc.revenue - rp.prior_revenue) / rp.prior_revenue AS rev_growth,
        k.returnOnEquityTTM, k.marketCap, f.operatingProfitMarginTTM
    FROM rev_current rc
    JOIN rev_prior rp ON rc.symbol = rp.symbol AND rp.rn = 2
    JOIN key_metrics_ttm k ON rc.symbol = k.symbol
    JOIN financial_ratios_ttm f ON rc.symbol = f.symbol
    JOIN profile_data pd ON rc.symbol = pd.symbol
    WHERE rc.rn = 1 AND rp.prior_revenue > 0
      AND k.returnOnEquityTTM > 0.08
      AND f.operatingProfitMarginTTM > 0.05
      AND k.marketCap > 500000000
),
sector_stats AS (
    SELECT sector,
        PERCENTILE_CONT(0.5) WITHIN GROUP (ORDER BY rev_growth) AS median_growth
    FROM growth GROUP BY sector HAVING COUNT(*) >= 3
)
SELECT g.symbol, g.sector,
    ROUND(g.rev_growth * 100, 1) AS rev_growth_pct,
    ROUND((g.rev_growth - ss.median_growth) * 100, 1) AS excess_growth_pct,
    ROUND(g.returnOnEquityTTM * 100, 1) AS roe_pct,
    ROUND(g.operatingProfitMarginTTM * 100, 1) AS opm_pct,
    ROUND(g.marketCap / 1e9, 1) AS mktcap_bn
FROM growth g
JOIN sector_stats ss ON g.sector = ss.sector
WHERE (g.rev_growth - ss.median_growth) >= 0.10
ORDER BY excess_growth_pct DESC
LIMIT 30
The 0% cash frequency means this screen reliably returns 10+ qualified names. Adjust the MCap floor if you want to broaden or narrow the investable universe.
Limitations
Sector concentration. Germany's industrial concentration means the portfolio is rarely truly diversified. In strong export years, it clusters in automotive supply chains and specialty chemicals. In weak years, those same clusters sell off together.
Currency. Returns converted to USD from EUR. A strengthening EUR inflates USD returns and vice versa. The mid-2000s EUR appreciation flattered German strategy returns in USD terms.
XETRA data quality note. We observe adjClose price data artifacts in certain XETRA names. The 200% per-period return cap mitigates this, but some returns in the annual table may be influenced by data artifacts in individual years.
Benchmark is total return. The DAX reinvests dividends, which compounds to a meaningfully higher return over 25 years. Most other country benchmarks used in this series are price-only. The -1.33% annual excess vs the DAX includes the drag from not capturing dividend yield.
Takeaway
Germany is the exchange where the market share signal most clearly lags its benchmark. But the gap is smaller than it appears against SPY: -1.33% per year vs the local total-return index, not -4.30%. The DAX's total-return construction, not a broken signal, accounts for a meaningful portion of that shortfall.
The 0% cash frequency shows the signal is never at a loss for candidates in Germany. The 36% win rate shows those candidates rarely translate into benchmark-beating returns. The down capture of 83.82% is modestly defensive. The portfolio falls less than the DAX in down years, just not by enough to offset the compounding gap in up years.
If you're allocating within Germany specifically, the screen provides a principled tilt toward relative quality. The signal identifies real share gainers. The structural headwind is Germany's cyclical sector concentration and the DAX's dividend inclusion, not a failure of the underlying logic.
Data: Ceta Research (FMP financial data warehouse), 2000-2024. Full methodology: METHODOLOGY.md. Past performance does not guarantee future results. This is educational content, not investment advice.
References
- Jegadeesh, N. & Livnat, J. (2006). "Revenue Surprises and Stock Returns." Journal of Accounting and Economics, 41(1-2), 147-171.
- Piotroski, J. & So, E. (2012). "Identifying Expectation Errors in Value/Glamour Strategies." Review of Financial Studies, 25(9), 2841-2875.


