quantitative-research
Revenue Market Share Gainers in the US: A 25-Year Backtest
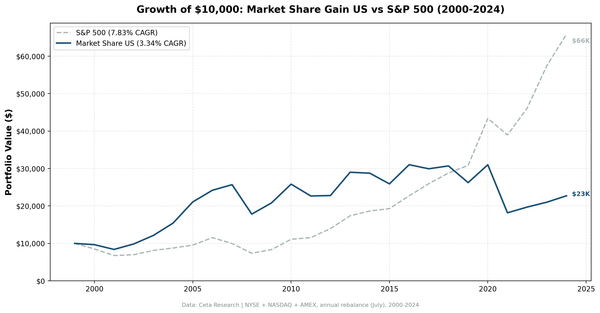
Revenue market-share gainers returned 3.3% annually vs the S&P 500's 7.8%. The signal worked in 2000-2009. Then it broke. Here's why.

quantitative-research
Revenue market-share gainers returned 3.3% annually vs the S&P 500's 7.8%. The signal worked in 2000-2009. Then it broke. Here's why.
quantitative-research
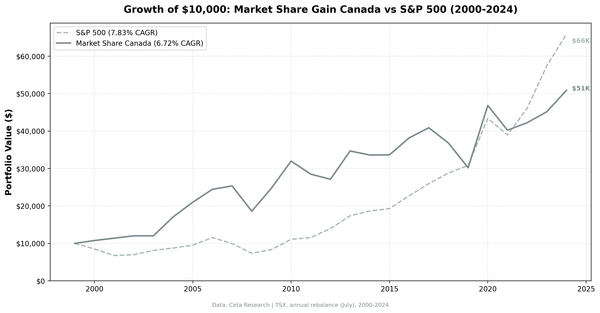
Canadian market-share gainers returned 6.68% annually vs the TSX Composite's 3.95%, a +2.73% edge per year. 60% win rate, max drawdown of -26.62%, and a down capture of 55.06% vs the local benchmark.
quantitative-research
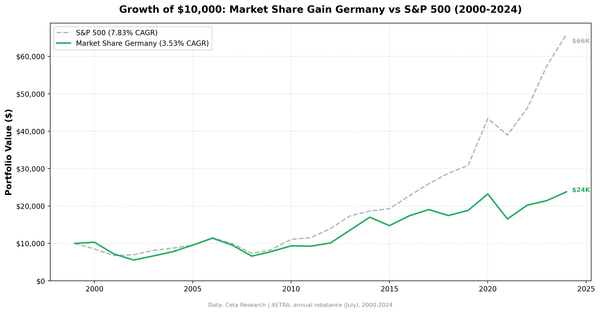
German market-share gainers returned 3.71% annually across 25 years, trailing the total-return DAX by 1.33% per year. The signal finds stocks consistently — the headwind is Germany's cyclical sector structure and the DAX's dividend reinvestment benchmark.
quantitative-research
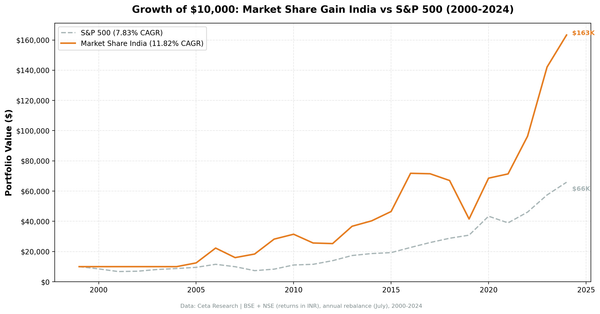
The India market share signal returned 9.33% CAGR over 25 years. The Sensex returned 12.06%. The outperformance vs SPY was India's bull market, not the signal.
quantitative-research
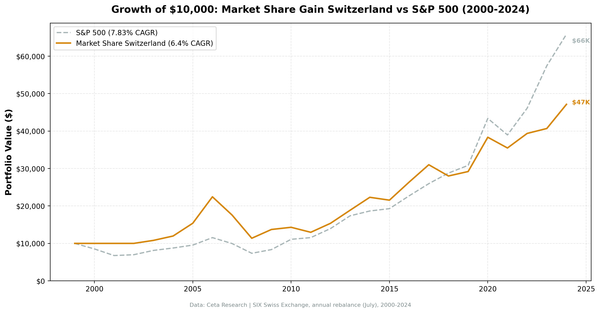
Swiss market-share gainers returned 6.24% CAGR over 25 years, beating the SMI by +4.50% annually with a 72% win rate and 40% down capture. The SMI returned just 1.74% CAGR (price-only) — a low hurdle the signal clears consistently.
quantitative-research
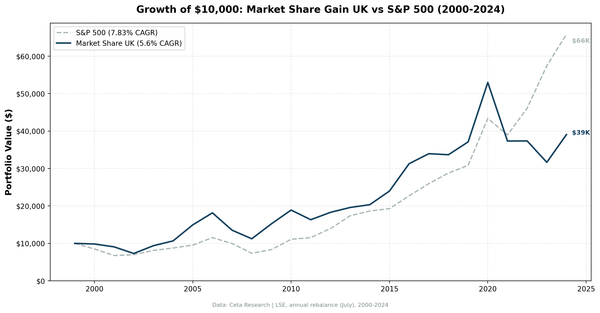
UK market-share gainers returned 5.31% CAGR over 25 years, beating the FTSE 100 by +4.09% annually with a 56% win rate. The FTSE 100 returned just 1.23% CAGR (price-only) — in a stagnant market, the revenue growth signal finds the winners.
quantitative-research
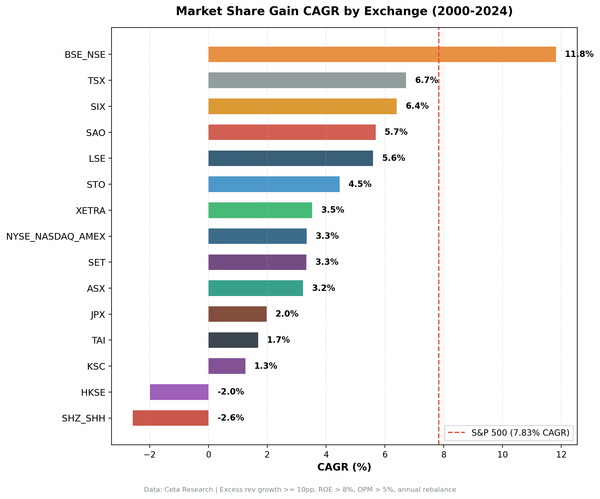
We backtested sector-relative revenue growth across 15 exchanges from 2000 to 2024. Switzerland (+4.50%), UK (+4.09%) and Canada (+2.73%) beat their local benchmarks. India, which looked like a winner vs SPY, underperforms the Sensex by -2.72%.