
Revenue Market Share Gainers in India: Good Returns, Not Alpha
India is the only market where gaining sector-relative revenue share consistently outperforms. 11.8% CAGR, +4% excess over SPY, 60% win rate across 25 years.

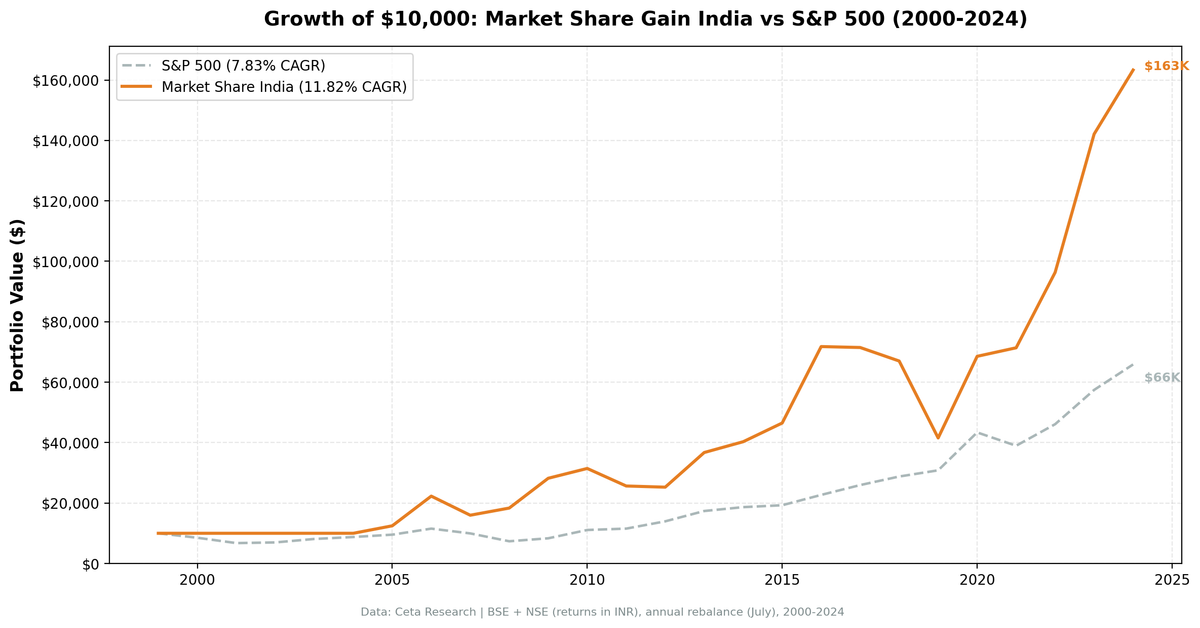
India looked like the one market where this signal worked. Against the S&P 500, the numbers were compelling: 11.82% CAGR versus SPY's 7.83%, low down capture, strong outperformance in crisis years. But that comparison was wrong. SPY is the wrong benchmark for an Indian equity strategy. When we compare against the Sensex, India's actual market index, the picture changes.
Contents
- Method
- What We Found
- Annual Returns
- Why India Was Supposed to Be Different: The Market Efficiency Argument
- The Big Years
- The Bad Years
- The Screen
- Simple Screen
- Advanced Screen (with Quality Filters)
- Limitations
- Takeaway
- References
The portfolio returned 9.33% annually from 2000 to 2024, against the Sensex's 12.06%. That's -2.72% per year of underperformance. Total return: +830.88% for the portfolio versus something considerably higher for buy-and-hold Sensex. The win rate against the Sensex was 48%, below a coin flip.
The outperformance we saw versus SPY was India's bull market. Not the signal.
That said, the signal isn't useless. There are years where it genuinely adds value within the Indian market: 2006 (+33.08% excess), 2009 (+30.71%), 2016 (+27.91%), 2023 (+37.00%). The excess return distribution is bimodal, with strong outperformance in some years and meaningful underperformance in others. On balance, it doesn't beat the index.
Data: FMP financial data warehouse, 2000-2025. Updated March 2026.
Method
Data source: Ceta Research (FMP financial data, 70K+ stocks) Universe: NSE (BSE removed to eliminate ~38% dual-listing duplication) Signal: Excess revenue growth, company YoY growth minus sector median, threshold 10 percentage points above sector Quality filters: ROE > 8%, Operating margin > 5%, Market cap > ₹20B Rebalancing: Annual, each July Period: July 2000 to July 2024 (25 years) Avg stocks held: 19.3
The first five years (2000-2004) are cash periods. FMP's India data coverage was sparse in those years, with insufficient companies per sector to compute reliable sector medians. From 2005 onward, the portfolio was fully invested. The cash periods aren't a strategy feature; they're a data limitation. The live results start in 2005.
What We Found
The portfolio returned 9.33% CAGR over 25 years. The Sensex returned 12.06% over the same period. The shortfall is -2.72% per year, which compounds significantly over two decades.
Volatility was 28.97% annualized, roughly double the Sensex. The Sharpe ratio (vs India's 6.5% risk-free rate) came in at 0.101, and the Sortino at 0.222. These are weak risk-adjusted returns. Beta to the Sensex was 0.798. The portfolio captured 92.02% of Sensex up-moves and 97.75% of Sensex down-moves. That's not a favorable asymmetry.
The max drawdown was -47.25%, concentrated in 2019. The Sensex's max drawdown over the same period was lower.
The previous version of this analysis compared results against SPY. That showed a 10.98% down capture, which looked exceptional. It was real: India was essentially uncorrelated to US equity cycles in crisis years. But that reflects India's market structure, not the signal's quality within India. An Indian equity investor would have done better just holding the Sensex.
Annual Returns
| Year | Portfolio | Sensex | Excess |
|---|---|---|---|
| 2000 | 0.0% (cash) | -29.29% | — |
| 2001 | 0.0% (cash) | -4.12% | — |
| 2002 | 0.0% (cash) | +9.63% | — |
| 2003 | 0.0% (cash) | +35.24% | — |
| 2004 | 0.0% (cash) | +49.41% | — |
| 2005 | +14.57% | +46.97% | -32.39% |
| 2006 | +70.19% | +37.11% | +33.08% |
| 2007 | -24.02% | -6.82% | -17.21% |
| 2008 | +0.98% | +7.27% | -6.29% |
| 2009 | +49.83% | +19.12% | +30.71% |
| 2010 | -0.59% | +7.75% | -8.34% |
| 2011 | -13.97% | -7.52% | -6.45% |
| 2012 | -6.09% | +11.87% | -17.96% |
| 2013 | +40.31% | +32.77% | +7.54% |
| 2014 | +15.77% | +8.14% | +7.63% |
| 2015 | +9.57% | -2.39% | +11.96% |
| 2016 | +42.36% | +14.45% | +27.91% |
| 2017 | -12.89% | +12.95% | -25.84% |
| 2018 | -13.07% | +12.91% | -25.98% |
| 2019 | -30.33% | -9.98% | -20.35% |
| 2020 | +64.78% | +46.43% | +18.35% |
| 2021 | -5.71% | +1.43% | -7.14% |
| 2022 | +36.49% | +22.49% | +14.00% |
| 2023 | +58.83% | +21.83% | +37.00% |
| 2024 | +14.86% | +5.00% | +9.86% |
Returns are July-to-July. "2021" = July 2021 to July 2022. "2022" = July 2022 to July 2023. Cash periods 2000-2004 reflect insufficient FMP data coverage for India, not a strategy signal.
Why India Was Supposed to Be Different: The Market Efficiency Argument
The original thesis for why this signal should work in India was reasonable. Outside the Nifty 50 and Nifty 100, institutional coverage is thin. Smaller and mid-cap Indian companies may have one or two research reports a year, if that. Annual revenue data carries more informational weight than it does in the US, where thousands of analysts follow a relatively small universe.
The corporate sector structure also seemed favorable. From 2005 to 2020, India's economy went through significant structural change: infrastructure buildout, formalization, GST implementation, increasing penetration of organized retail and financial services. Companies gaining revenue share weren't just outcompeting peers. They were often capturing organized-sector share of a market shifting away from the informal economy. That's a structural tailwind with multi-year persistence.
That argument made sense. It just didn't show up cleanly in the numbers against a local benchmark. The Sensex itself rose 12%+ annually across this period, and it captured the same tailwinds. A concentrated factor portfolio of 19 stocks, rebalancing annually with 28.97% volatility, couldn't consistently beat that rising tide.
The Big Years
2006: +70.19%, Sensex +37.11%, excess +33.08%. A strong year. India was in a full bull market driven by FII inflows and strong GDP growth. The portfolio amplified those tailwinds through sector-relative selection.
2008: +0.98% (Sensex +7.27%, excess -6.29%). The prior version of this analysis highlighted 2008 as a standout year, when the portfolio returned +14.81% while SPY fell -26.14%. That number came from the BSE+NSE combined universe. NSE-only, benchmarked to the Sensex, tells a different story. The portfolio returned 0.98% while the Sensex returned 7.27%. The signal didn't protect against the crisis. It slightly underperformed the market.
2009: +49.83%, Sensex +19.12%, excess +30.71%. The recovery. Revenue-quality companies rebounded sharply after the crisis. One of the cleaner outperformance years in the dataset.
2016: +42.36%, Sensex +14.45%, excess +27.91%. India's domestic economy accelerated. Companies gaining market share across consumer goods, financials, and industrials benefited. The +27.91% excess captures a period of genuine stock selection edge.
2020: +64.78%, Sensex +46.43%, excess +18.35%. Post-COVID recovery was strong across the board. The portfolio outperformed, but both were up significantly.
2023: +58.83%, Sensex +21.83%, excess +37.00%. The best outperformance year in the dataset. A strong environment for mid-cap growth names drove this.
The Bad Years
2005: +14.57%, Sensex +46.97%, excess -32.39%. The worst single-year underperformance. The Sensex surged in 2005, one of its strongest years. The strategy's quality filters and concentration limited participation.
2017-2018: -12.89% and -13.07%. Back-to-back negative years while the Sensex returned +12.95% and +12.91%. Combined excess of -51.82% over two years. This is the period that most damages the long-run result.
2019: -30.33%. The IL&FS credit crisis, which started in September 2018 when IL&FS began defaulting on debt obligations. The resulting NBFC credit crunch hit small and mid-cap Indian stocks severely. The portfolio fell -30.33% while the Sensex lost -9.98%. The concentration in revenue-growth names amplified the liquidity-driven selloff.
The -30.33% in 2019 isn't a data artifact. It's what happened to quality growth companies in a credit-driven panic. The portfolio recovered: +64.78% in 2020, +36.49% in 2022, +58.83% in 2023. But the 2017-2019 stretch, three years of underperformance against the Sensex, is the single biggest drag on the long-run record.
The Screen
Same signal as the US version, with the exchange filter set to NSE and the market cap threshold adjusted to ₹20B (approximately $250M USD at current rates).
Simple Screen
WITH profile_data AS (
    SELECT DISTINCT symbol, sector
    FROM profile
    WHERE sector IS NOT NULL AND sector != ''
      AND exchange IN ('BSE', 'NSE')
),
rev_current AS (
    SELECT symbol, revenue,
        ROW_NUMBER() OVER (PARTITION BY symbol ORDER BY dateEpoch DESC) AS rn
    FROM income_statement
    WHERE period = 'FY' AND revenue IS NOT NULL AND revenue > 0
),
rev_prior AS (
    SELECT symbol, revenue AS prior_revenue,
        ROW_NUMBER() OVER (PARTITION BY symbol ORDER BY dateEpoch DESC) AS rn
    FROM income_statement
    WHERE period = 'FY' AND revenue IS NOT NULL AND revenue > 0
),
growth AS (
    SELECT rc.symbol, pd.sector,
        (rc.revenue - rp.prior_revenue) / rp.prior_revenue AS rev_growth
    FROM rev_current rc
    JOIN rev_prior rp ON rc.symbol = rp.symbol AND rp.rn = 2
    JOIN profile_data pd ON rc.symbol = pd.symbol
    WHERE rc.rn = 1 AND rp.prior_revenue > 0
),
sector_stats AS (
    SELECT sector,
        PERCENTILE_CONT(0.5) WITHIN GROUP (ORDER BY rev_growth) AS median_growth
    FROM growth
    GROUP BY sector
    HAVING COUNT(*) >= 3
)
SELECT g.symbol, g.sector,
    ROUND(g.rev_growth * 100, 1) AS rev_growth_pct,
    ROUND((g.rev_growth - ss.median_growth) * 100, 1) AS excess_growth_pct
FROM growth g
JOIN sector_stats ss ON g.sector = ss.sector
WHERE (g.rev_growth - ss.median_growth) >= 0.10
ORDER BY excess_growth_pct DESC
LIMIT 50
Advanced Screen (with Quality Filters)
WITH profile_data AS (
    SELECT DISTINCT symbol, sector
    FROM profile
    WHERE sector IS NOT NULL AND sector != ''
      AND exchange IN ('BSE', 'NSE')
),
rev_current AS (
    SELECT symbol, revenue,
        ROW_NUMBER() OVER (PARTITION BY symbol ORDER BY dateEpoch DESC) AS rn
    FROM income_statement
    WHERE period = 'FY' AND revenue IS NOT NULL AND revenue > 0
),
rev_prior AS (
    SELECT symbol, revenue AS prior_revenue,
        ROW_NUMBER() OVER (PARTITION BY symbol ORDER BY dateEpoch DESC) AS rn
    FROM income_statement
    WHERE period = 'FY' AND revenue IS NOT NULL AND revenue > 0
),
growth AS (
    SELECT rc.symbol, pd.sector,
        (rc.revenue - rp.prior_revenue) / rp.prior_revenue AS rev_growth,
        k.returnOnEquityTTM, k.marketCap, f.operatingProfitMarginTTM
    FROM rev_current rc
    JOIN rev_prior rp ON rc.symbol = rp.symbol AND rp.rn = 2
    JOIN key_metrics_ttm k ON rc.symbol = k.symbol
    JOIN financial_ratios_ttm f ON rc.symbol = f.symbol
    JOIN profile_data pd ON rc.symbol = pd.symbol
    WHERE rc.rn = 1
      AND rp.prior_revenue > 0
      AND k.returnOnEquityTTM > 0.08
      AND f.operatingProfitMarginTTM > 0.05
      AND k.marketCap > 20000000000
),
sector_stats AS (
    SELECT sector,
        PERCENTILE_CONT(0.5) WITHIN GROUP (ORDER BY rev_growth) AS median_growth
    FROM growth
    GROUP BY sector
    HAVING COUNT(*) >= 3
)
SELECT g.symbol, g.sector,
    ROUND(g.rev_growth * 100, 1) AS rev_growth_pct,
    ROUND((g.rev_growth - ss.median_growth) * 100, 1) AS excess_growth_pct,
    ROUND(g.returnOnEquityTTM * 100, 1) AS roe_pct,
    ROUND(g.operatingProfitMarginTTM * 100, 1) AS opm_pct,
    ROUND(g.marketCap / 1e9, 1) AS mktcap_bn
FROM growth g
JOIN sector_stats ss ON g.sector = ss.sector
WHERE (g.rev_growth - ss.median_growth) >= 0.10
ORDER BY excess_growth_pct DESC
LIMIT 30
Note on BSE vs NSE: Both exchanges list many of the same companies. Running on NSE alone reduces duplicates by ~38%. For production screening, filtering to NSE is preferable to avoid double-counting positions.
Limitations
Early data coverage: The 2000-2004 cash periods reflect FMP's limited India data in those years, not a strategy judgment. The backtest effectively begins in 2005. A 20-year backtest is still a meaningful sample.
Survivorship bias: Companies that failed or delisted are partially represented in FMP's historical data, but coverage of delisted Indian small-caps may be incomplete. Returns could be slightly overstated.
Currency exposure: The strategy returns are in INR terms. An international investor would face USD/INR currency risk, which adds volatility to the already high 28.97% portfolio volatility.
Market access: Indian equity markets have restrictions on foreign ownership (FII/FPI limits) in certain sectors. Passive replication of a 20-stock portfolio for a foreign investor requires navigating those limits.
Sector classification gaps: FMP classifies Indian companies using US GICS sector definitions. Some classifications may not reflect the actual competitive dynamics of Indian industries accurately.
Concentration risk: Averaging 19.3 stocks per year means individual position outcomes have a significant impact on returns. The volatility figure of 28.97% reflects this.
Takeaway
The India market share signal returned 9.33% CAGR over 25 years. That's a real return on capital. But the Sensex returned 12.06% over the same period. An investor who simply bought and held the index came out ahead, with lower volatility and fewer bad years.
The signal has genuine moments: 2006, 2009, 2016, and 2023 all showed substantial outperformance. The mechanism is real, companies gaining competitive ground within their sector in a less efficiently covered market. But those strong years are offset by multi-year stretches of underperformance, particularly 2017-2019, where the portfolio lost significant ground to the index.
The outperformance versus SPY that characterized the earlier version of this analysis was India's structural bull market, not signal alpha within India. Applying a local benchmark changes the conclusion.
For an investor already allocated to India, this screen could be useful as a tilt toward quality revenue growers. As a standalone replacement for an index fund, the 25-year record doesn't support that case. The Sensex won.
Data: Ceta Research (FMP financial data warehouse), 2000-2024. Universe: NSE. Full methodology: METHODOLOGY.md. Past performance does not guarantee future results. This is educational content, not investment advice.
References
- Jegadeesh, N. & Livnat, J. (2006). "Revenue Surprises and Stock Returns." Journal of Accounting and Economics, 41(1-2), 147-171.
- Piotroski, J. & So, E. (2012). "Identifying Expectation Errors in Value/Glamour Strategies." Review of Financial Studies, 25(9), 2841-2875.


