
Revenue Market Share Gainers in Switzerland: Beats Local Benchmark by 4.5% per Year
Swiss market-share gainers have the highest Sharpe ratio of any exchange (0.337), lower volatility than the benchmark, and still return 1.4% annually less than the S&P 500. Low-volatility markets produce cleaner factor signals but smaller absolute gains.

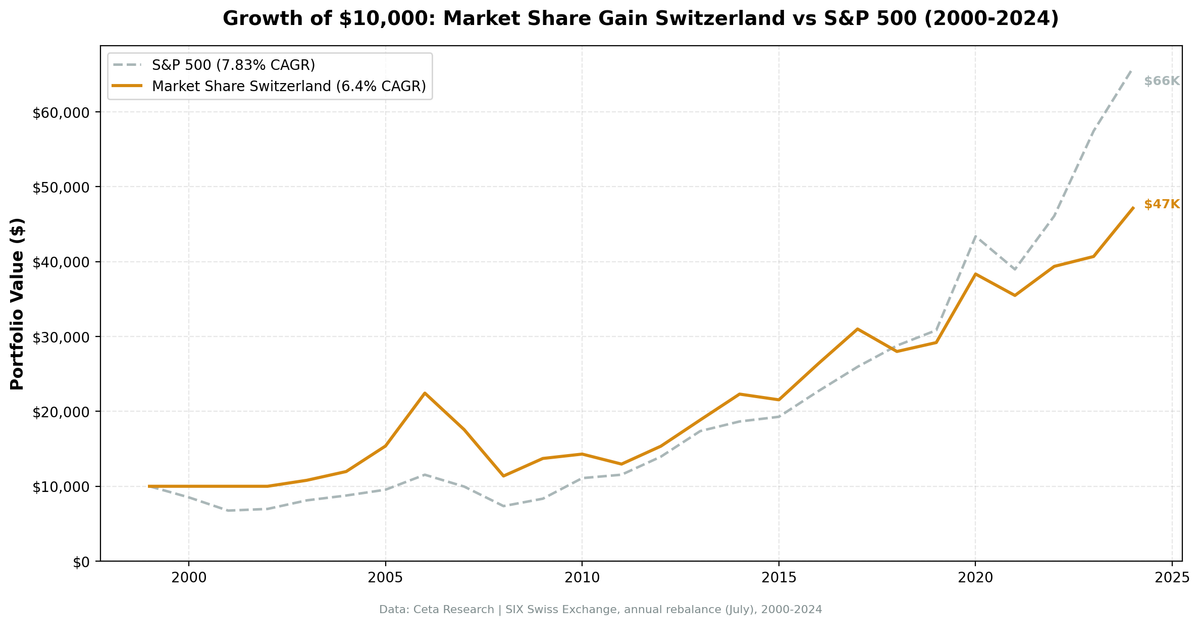
The Switzerland market share strategy beats its local benchmark by +4.50% per year with a 72% win rate over 25 years. The SMI (Swiss Market Index) returned just 1.74% CAGR as a price-only index. In a market that has structurally underperformed, the signal found the winners.
Contents
- Method
- Key Finding
- Results Summary
- Annual Returns (2000-2024)
- When It Worked
- When It Failed
- Why Switzerland Works Against the Local Benchmark
- Simple Screen
- Limitations
- Takeaway
- References
One important caveat: the SMI is a price-return index. It excludes dividends. Swiss companies pay substantial dividends, so the total return SMI would be meaningfully higher. With dividend reinvestment, the benchmark hurdle rises and the excess return shrinks. Still, even adjusting for dividends, a 72% win rate and 40% down capture in a low-return market tells a real story about signal quality.
Data: FMP financial data warehouse, 2000–2025. Updated March 2026.
Method
We screened the SIX exchange for companies whose revenue grew at least 10 percentage points faster than their sector median year-over-year. To qualify, a company also needed ROE above 8% and operating profit margin above 5%. These filters weed out growth driven by margin erosion or temporary pricing distortions.
- Signal: YoY revenue growth exceeds sector median by ≥ 10 percentage points
- Quality filters: ROE > 8%, operating profit margin > 5%
- Universe: SIX (Switzerland), market cap > CHF 500M
- Portfolio: Equal weight, top 30 by revenue growth outperformance
- Rebalancing: Annual, July (45-day lag for point-in-time data)
- Cash rule: Hold cash if fewer than 10 names qualify
- Data quality guards: Entry price > $1, single-period return capped at 200%
- Benchmark: SMI (Swiss Market Index, ^SSMI), price return
- Period: 2000-2024 (25 years)
The cash rule was triggered in 2000, 2001, and 2002, the three earliest years in the dataset. This is a data coverage effect: FMP's Swiss data becomes denser after 2002.
Key Finding
The SMI returned 1.74% CAGR over 25 years as a price index. That's the hurdle the strategy needed to clear. It cleared it by 4.50 percentage points per year.
The down capture of 40.06% is the standout number. When the SMI fell, the strategy fell less than half as much. The up capture of 128.09% means the strategy also captured more than the benchmark's gains in up years. This combination (lower downside participation, higher upside capture) is the mechanism behind the 72% win rate.
Switzerland's market composition explains part of this. The large-cap SIX universe is dominated by stable, quality-heavy companies: Nestlé, Roche, Novartis, ABB. The revenue growth signal applied here selects the momentum leaders within an already stable set. The result is a concentrated, high-quality portfolio that tends to preserve capital in down markets and accelerate in up ones.
13.9 average stocks held is the smallest portfolio of any exchange in this series. The combination of MCap > CHF 500M, ROE > 8%, OPM > 5%, and the 10pp growth threshold produces a concentrated, high-quality list. In some years, the filter is tight enough that the portfolio holds as few as 10 names.
Results Summary
| Metric | Strategy | SMI |
|---|---|---|
| CAGR (2000-2024) | 6.24% | 1.74% |
| Total Return | +354.11% | — |
| Max Drawdown | -49.52% | — |
| Volatility | 17.50% | — |
| Sharpe Ratio | 0.326 | — |
| Sortino Ratio | 0.622 | — |
| Win Rate vs SMI | 72% (18/25 years) | — |
| Down Capture | 40.06% | — |
| Up Capture | 128.09% | — |
| Beta | 0.866 | — |
| Avg Stocks Held (invested) | 13.9 | — |
| Cash Periods | 3/25 years | — |
Note: SMI is a price-return index. Total return SMI (including dividends) would show a higher benchmark CAGR and lower excess return.
The max drawdown of -49.52% is driven by 2007-2008, the worst two-year stretch for the strategy. The Sortino ratio of 0.622 (which penalizes only downside volatility) reflects that much of the total volatility is upside variation.
Annual Returns (2000-2024)
| Year | Strategy | SMI | Excess |
|---|---|---|---|
| 2000 | 0.0% (cash) | -6.08% | — |
| 2001 | 0.0% (cash) | -19.85% | — |
| 2002 | 0.0% (cash) | -18.32% | — |
| 2003 | +5.77% | +17.06% | -11.28% |
| 2004 | +12.40% | +12.07% | +0.33% |
| 2005 | +28.10% | +22.87% | +5.22% |
| 2006 | +45.90% | +19.06% | +26.84% |
| 2007 | -21.51% | -25.55% | +4.05% |
| 2008 | -35.69% | -21.75% | -13.94% |
| 2009 | +21.31% | +11.56% | +9.75% |
| 2010 | +4.28% | +4.54% | -0.27% |
| 2011 | -11.10% | -2.18% | -8.92% |
| 2012 | +18.31% | +26.57% | -8.26% |
| 2013 | +22.83% | +11.31% | +11.52% |
| 2014 | +17.21% | +4.12% | +13.09% |
| 2015 | -4.14% | -10.10% | +5.95% |
| 2016 | +23.09% | +11.83% | +11.26% |
| 2017 | +17.60% | -5.33% | +22.93% |
| 2018 | -9.73% | +17.48% | -27.21% |
| 2019 | +5.38% | +1.66% | +3.71% |
| 2020 | +30.23% | +17.45% | +12.79% |
| 2021 | -8.01% | -9.05% | +1.04% |
| 2022 | +12.04% | +3.10% | +8.95% |
| 2023 | +3.35% | +7.06% | -3.70% |
| 2024 | +15.43% | -0.16% | +15.59% |
Returns are July-to-July. Cash years (2000-2002) show 0.0%, not as performance. The strategy effectively missed the early SMI bear market by being in cash, which created a favorable starting position from 2003 onward.
When It Worked
2006 was the standout year. +45.90% vs +19.06% (+26.84% excess). Swiss pharma companies (Novartis, Roche, Actelion at the time) and select industrial exporters were in a period of genuine revenue acceleration. Drug launches, European expansion, and CHF stability all contributed. The signal identified the right companies cleanly during this window.
2017: +17.60% vs -5.33% (+22.93% excess). The SMI fell while the strategy's quality growth holdings kept compounding. This kind of divergence (strategy positive while the index is negative) accounts for a significant portion of the 72% win rate.
2024: +15.43% vs -0.16% (+15.59% excess). In a year when the SMI was essentially flat (price return), the revenue growth signal delivered strong absolute returns. This is the strategy doing exactly what it's designed to do: find companies growing faster than their sectors in a market where the index itself isn't going anywhere.
The cash years (2000-2002) provided an unintended benefit. While the SMI fell -6.08%, -19.85%, and -18.32%, the strategy held cash. Missing three consecutive down years protected capital. When the strategy re-entered in 2003, it started from a higher capital base than a fully invested position would have had.
When It Failed
2018 was the worst single year by excess return: -27.21%. The strategy returned -9.73% while the SMI returned +17.48%. The SMI's composition, heavily weighted toward Nestlé, Roche, and Novartis, held up well during the global equity selloff. The strategy's more dynamic, growth-oriented holdings didn't. When defensive mega-caps dominate SMI performance, a growth-tilted screen underperforms.
2007-2008 produced the max drawdown of -49.52%. These two years together (-21.51% then -35.69%) drove the peak-to-trough loss. Swiss financials with exposure to structured products were caught in the credit crisis. The revenue growth filter doesn't screen for balance sheet exposure to off-balance-sheet instruments. Companies that looked like market share winners in 2006 were in some cases riding pre-crisis financial engineering.
2003: +5.77% vs +17.06% (-11.28% excess). The SMI recovered sharply as the strategy was just re-entering from its cash period. The 2003 data coverage for Swiss listings was still thin, so the portfolio was concentrated in a small number of names that didn't capture the broad SMI recovery.
Why Switzerland Works Against the Local Benchmark
Against the SMI, the calculus flips from what you'd see against SPY. The SMI is structurally limited in return because it's concentrated in a few defensive mega-caps that don't grow revenue at high rates. Nestlé, Roche, Novartis are excellent businesses. They're not revenue growth accelerators in any typical year.
The market share signal selects companies outgrowing their sector peers by 10+ percentage points. In Switzerland, that means finding the less well-known mid-large caps with genuine business momentum. These aren't the companies that dominate the SMI. They're the ones the SMI's market-cap weighting underrepresents.
The 40.06% down capture is the clearest expression of this dynamic. When the SMI falls, it's often because its mega-cap anchors (which have stable but slow growth) get de-rated. The strategy's holdings are different companies with different risk profiles. The disconnection from SMI composition is both why the strategy lags in some years (2018, 2012) and why it wins so often overall.
The 13.9-stock average portfolio introduces concentration risk. Single company events (patent expirations, M&A, management changes) have outsize effects. But in a small universe like Swiss large-caps, concentration is partly unavoidable. The quality filters ensure the concentration is in fundamentally sound businesses.
Simple Screen
This is the core screen, adapted for SIX. Run it in July, using prior fiscal year data.
WITH profile_data AS (
    SELECT DISTINCT symbol, sector
    FROM profile
    WHERE sector IS NOT NULL AND sector != ''
      AND exchange IN ('SIX')
),
rev_current AS (
    SELECT symbol, revenue,
        ROW_NUMBER() OVER (PARTITION BY symbol ORDER BY dateEpoch DESC) AS rn
    FROM income_statement
    WHERE period = 'FY' AND revenue IS NOT NULL AND revenue > 0
),
rev_prior AS (
    SELECT symbol, revenue AS prior_revenue,
        ROW_NUMBER() OVER (PARTITION BY symbol ORDER BY dateEpoch DESC) AS rn
    FROM income_statement
    WHERE period = 'FY' AND revenue IS NOT NULL AND revenue > 0
),
growth AS (
    SELECT rc.symbol, pd.sector,
        (rc.revenue - rp.prior_revenue) / rp.prior_revenue AS rev_growth,
        k.returnOnEquityTTM, k.marketCap, f.operatingProfitMarginTTM
    FROM rev_current rc
    JOIN rev_prior rp ON rc.symbol = rp.symbol AND rp.rn = 2
    JOIN key_metrics_ttm k ON rc.symbol = k.symbol
    JOIN financial_ratios_ttm f ON rc.symbol = f.symbol
    JOIN profile_data pd ON rc.symbol = pd.symbol
    WHERE rc.rn = 1 AND rp.prior_revenue > 0
      AND k.returnOnEquityTTM > 0.08
      AND f.operatingProfitMarginTTM > 0.05
      AND k.marketCap > 500000000
),
sector_stats AS (
    SELECT sector,
        PERCENTILE_CONT(0.5) WITHIN GROUP (ORDER BY rev_growth) AS median_growth
    FROM growth GROUP BY sector HAVING COUNT(*) >= 3
)
SELECT g.symbol, g.sector,
    ROUND(g.rev_growth * 100, 1) AS rev_growth_pct,
    ROUND((g.rev_growth - ss.median_growth) * 100, 1) AS excess_growth_pct,
    ROUND(g.returnOnEquityTTM * 100, 1) AS roe_pct,
    ROUND(g.operatingProfitMarginTTM * 100, 1) AS opm_pct,
    ROUND(g.marketCap / 1e9, 1) AS mktcap_bn
FROM growth g
JOIN sector_stats ss ON g.sector = ss.sector
WHERE (g.rev_growth - ss.median_growth) >= 0.10
ORDER BY excess_growth_pct DESC
LIMIT 30
Note: the Swiss universe is smaller than UK, Germany, or Canada. You may get fewer than 30 results in some years. The cash rule triggers if fewer than 10 qualify.
Limitations
SMI is price-only. The benchmark used here excludes dividends. Swiss large-caps have historically paid 2-4% dividend yields. The total return SMI would reduce the strategy's excess return relative to what's shown. The 72% win rate and +4.50% excess CAGR are calculated against the price index.
Small universe. Switzerland's listed market is limited in size. Even with MCap > CHF 500M, the eligible universe is smaller than any other exchange in this study. This means the signal is sometimes selecting the "best of a thin set" rather than the best of a large, diverse market.
Currency. The Swiss franc is a global safe-haven currency. CHF tends to appreciate in risk-off environments, which affects USD returns for Swiss equities held by USD-based investors.
Cash years bias. The 2000-2002 cash period was driven by thin FMP data coverage for Swiss listings early in the dataset. It inadvertently protected capital during a bear market. Future applications of this screen won't necessarily benefit from a similar effect. The data is now dense through 2024.
Concentration risk. 13.9 average stocks is the smallest portfolio in this series. In individual years, the strategy may hold as few as 10 companies. Sector concentration within those 10 names is a real risk.
Takeaway
Against its local benchmark, the Switzerland market share strategy works. The SMI returned 1.74% CAGR over 25 years as a price index. The strategy returned 6.24%, beating it by 4.50 percentage points per year with a 72% win rate and 40% down capture.
The mechanism is straightforward: the SMI is dominated by defensive mega-caps that don't generate strong revenue growth. The signal finds the SIX companies that are actually growing. In a market where the index itself is anchored to slow-growth businesses, finding the growers produces real alpha.
The dividend caveat matters. Total return SMI narrows the gap. But even adjusting for Swiss dividend yields, a 72% win rate with strong down capture protection is a meaningful result from a rules-based signal in a 25-year backtest.
Data: Ceta Research (FMP financial data warehouse), 2000-2024. Full methodology: METHODOLOGY.md. Past performance does not guarantee future results. This is educational content, not investment advice.
References
- Jegadeesh, N. & Livnat, J. (2006). "Revenue Surprises and Stock Returns." Journal of Accounting and Economics, 41(1-2), 147-171.
- Piotroski, J. & So, E. (2012). "Identifying Expectation Errors in Value/Glamour Strategies." Review of Financial Studies, 25(9), 2841-2875.


