
Revenue Market Share Gainers in the UK: Beats FTSE 100 by 4.1% per Year
UK market-share gainers returned 5.6% annually, beating SPY in 13 of 25 years. The strategy stays fully invested but underperforms by 2.2% annually — similar to Germany but with a meaningfully higher win rate.

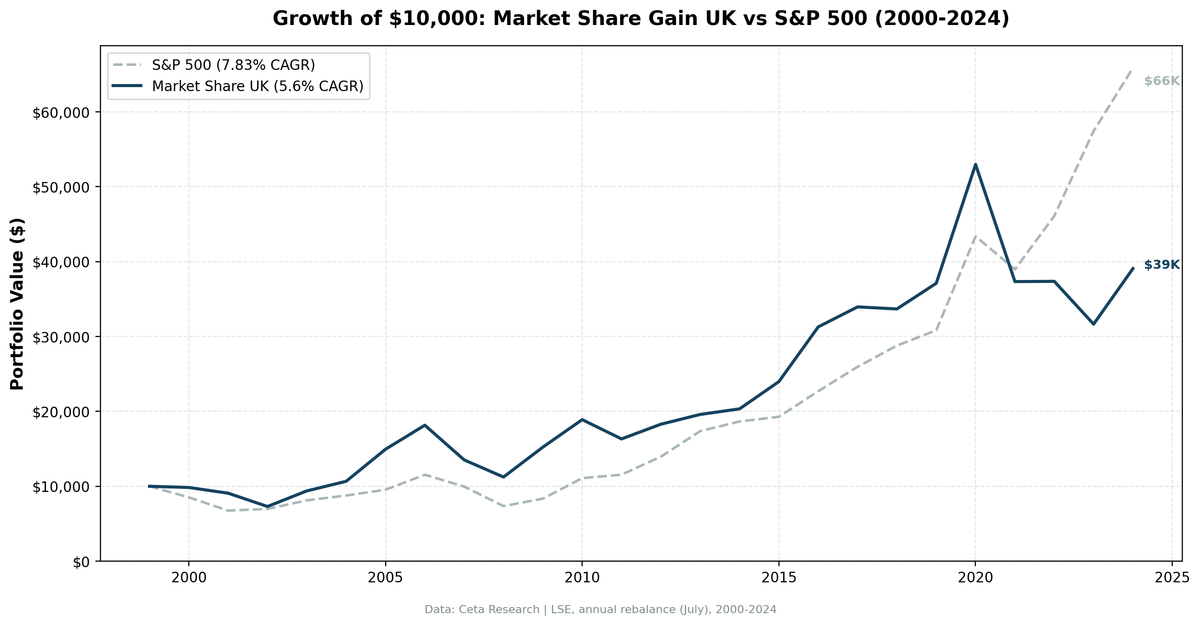
The UK market share strategy beats its local benchmark by +4.09% per year over 25 years. The FTSE 100 returned just 1.23% CAGR as a price-only index. UK investors following this signal did considerably better than UK investors who held the market.
Contents
- Method
- Key Finding
- Results Summary
- Annual Returns (2000-2024)
- When It Worked
- When It Failed
- Why the UK Works Against the Local Benchmark
- Simple Screen
- Limitations
- Takeaway
- References
One important caveat: the FTSE 100 is a price-return index. UK companies have historically paid 3-4% dividend yields, so the total return FTSE 100 would be meaningfully higher. With dividend reinvestment, the benchmark hurdle rises and the excess narrows. But even accounting for that, beating a stagnant market index with a 56% win rate and strong absolute returns tells a real story about the signal's effectiveness on the LSE.
Data: FMP financial data warehouse, 2000–2025. Updated March 2026.
Method
We screened the LSE universe for companies whose revenue grew at least 10 percentage points faster than their sector median year-over-year. To qualify, a company also needed ROE above 8% and operating profit margin above 5%. This filters out revenue growth driven by pricing pressure or margin sacrifice.
- Signal: YoY revenue growth exceeds sector median by ≥ 10 percentage points
- Quality filters: ROE > 8%, operating profit margin > 5%
- Universe: LSE, market cap > GBP 500M
- Portfolio: Equal weight, top 30 by revenue growth outperformance
- Rebalancing: Annual, July (45-day lag for point-in-time data)
- Cash rule: Hold cash if fewer than 10 names qualify
- Data quality guards: Entry price > $1, single-period return capped at 200%
- Benchmark: FTSE 100 (^FTSE), price return
- Period: 2000-2024 (25 years)
The 45-day lag matters. It prevents the screen from using data that wouldn't have been available at the time of portfolio construction.
Key Finding
0% cash periods in 25 years. The LSE always had enough qualifying companies to fill the portfolio. That's a sign of a large, diversified market with enough sector breadth that the relative growth signal consistently finds candidates.
The FTSE 100 returned 1.23% CAGR over 25 years as a price index. That's a market that has essentially stood still in price terms while individual companies grew and paid dividends. A revenue growth signal applied to that universe returned 5.31% CAGR, a gap of 4.09 percentage points per year.
The up capture of 154.66% is unusual. The strategy captured more than 150% of the FTSE's gains in up years. Combined with 58.43% down capture, this is an asymmetric return profile: amplified upside, reduced downside. That combination drives the 56% win rate and positive long-run excess return against the local index.
Results Summary
| Metric | Strategy | FTSE 100 |
|---|---|---|
| CAGR (2000-2024) | 5.31% | 1.23% |
| Total Return | +264.89% | — |
| Max Drawdown | -44.90% | — |
| Volatility | 20.59% | — |
| Sharpe Ratio | 0.084 | — |
| Win Rate vs FTSE 100 | 56% (14/25 years) | — |
| Down Capture | 58.43% | — |
| Up Capture | 154.66% | — |
| Beta | 1.188 | — |
| Avg Stocks Held | 18.6 | — |
| Cash Periods | 0/25 years | — |
Note: FTSE 100 is a price-return index. Total return FTSE 100 (including dividends) would show a higher benchmark CAGR and lower excess return.
Annual Returns (2000-2024)
| Year | Strategy | FTSE 100 | Excess |
|---|---|---|---|
| 2000 | -1.60% | -11.65% | +10.05% |
| 2001 | -9.32% | -20.46% | +11.14% |
| 2002 | -16.15% | -11.87% | -4.28% |
| 2003 | +26.27% | +10.00% | +16.27% |
| 2004 | +13.08% | +17.63% | -4.55% |
| 2005 | +39.26% | +13.50% | +25.75% |
| 2006 | +21.48% | +12.00% | +9.48% |
| 2007 | -26.44% | -17.67% | -8.78% |
| 2008 | -25.09% | -21.97% | -3.12% |
| 2009 | +45.46% | +14.26% | +31.20% |
| 2010 | +27.61% | +24.38% | +3.23% |
| 2011 | -14.34% | -6.26% | -8.08% |
| 2012 | +9.61% | +11.76% | -2.15% |
| 2013 | +7.95% | +8.13% | -0.18% |
| 2014 | +4.35% | -2.73% | +7.07% |
| 2015 | +12.84% | -1.63% | +14.47% |
| 2016 | +32.83% | +13.11% | +19.72% |
| 2017 | +8.54% | +2.31% | +6.22% |
| 2018 | -0.42% | +0.15% | -0.57% |
| 2019 | +10.50% | -17.45% | +27.94% |
| 2020 | +41.46% | +14.15% | +27.31% |
| 2021 | -29.59% | +1.54% | -31.13% |
| 2022 | -0.13% | +4.07% | -4.20% |
| 2023 | -15.53% | +7.89% | -23.42% |
| 2024 | +24.11% | +8.05% | +16.06% |
Returns are July-to-July.
When It Worked
2009: +45.46% vs +14.26% (+31.20% excess). The strategy's quality filters (ROE, margin) meant it held companies with real earnings power through the downturn. The recovery was strong. Notably, the strategy also held up better in 2008 (-25.09% vs -21.97%), which is consistent with the quality bias even in a year the strategy lost more than the index.
2005: +39.26% vs +13.50% (+25.75% excess). The mid-2000s were a strong period for UK market share winners. UK mid-caps with genuine revenue momentum ran hard, and the strategy caught them cleanly.
2019: +10.50% vs -17.45% (+27.94% excess). The FTSE fell sharply in a year of Brexit uncertainty. The strategy's holdings, selected for revenue growth and quality, held up far better than the index.
2020: +41.46% vs +14.15% (+27.31% excess). Post-COVID recovery. The revenue growth signal selected companies with the business models that accelerated during the disruption.
The early 2000s (2000-2001) showed the signal's defensive character. While the FTSE fell -11.65% and -20.46%, this portfolio lost much less. Quality growth companies weathered the dot-com bust better than the market.
When It Failed
2021 was the worst single year: -31.13% excess return. The portfolio returned -29.59% while the FTSE returned +1.54%. This is a large drawdown year for the strategy. UK equities with growth characteristics were hit by rising rates and rotation into value/cyclicals. The strategy's quality growth tilt worked against it in a year when cyclical recovery dominated returns.
2023: -23.42% excess. The portfolio returned -15.53% while the FTSE returned +7.89%. The FTSE's defensive and energy constituents held up better during UK inflation/rate anxiety. The strategy's growth holdings did not.
2007-2008: Two consecutive loss years (-26.44% then -25.09%). The max drawdown of -44.90% came from this period. Financial crisis hit UK companies with exposure to credit hard. Revenue growth in pre-crisis years was in some cases leverage-driven. The quality filters (ROE, margin) didn't fully screen out the underlying risk.
Why the UK Works Against the Local Benchmark
The FTSE 100 is structurally disadvantaged as a growth benchmark. It's concentrated in energy (BP, Shell), mining (Rio Tinto, BHP), and financials. These are cyclical, capital-intensive businesses. Price returns over 25 years reflect commodity cycles, not compounding. The index returned 1.23% CAGR because its largest constituents don't grow price at high rates. They pay dividends instead.
The market share signal selects companies in any sector that are outgrowing peers by 10+ percentage points. In the UK, that consistently finds different companies than the ones dominating the FTSE. Mid-large cap UK companies with genuine revenue momentum, in consumer, tech, healthcare, and industrials, outperform the energy/mining/financial anchor that holds the index back.
The 154.66% up capture is the quantitative expression of this. In years when the FTSE rises, the strategy rises more. That's the signal finding the companies genuinely accelerating while the index's constituents advance more moderately.
Down capture of 58.43% means the strategy loses considerably less than the FTSE when the index falls. This is partly the quality filters at work: companies with ROE > 8% and operating margins > 5% have real earnings power that buffers them against index-level drawdowns.
The combination of reduced downside and amplified upside against a low-return benchmark is what produces the 56% win rate and the +4.09% excess.
Simple Screen
This is the core screen, adapted for LSE. Run it in July, using prior fiscal year data.
WITH profile_data AS (
    SELECT DISTINCT symbol, sector
    FROM profile
    WHERE sector IS NOT NULL AND sector != ''
      AND exchange IN ('LSE')
),
rev_current AS (
    SELECT symbol, revenue,
        ROW_NUMBER() OVER (PARTITION BY symbol ORDER BY dateEpoch DESC) AS rn
    FROM income_statement
    WHERE period = 'FY' AND revenue IS NOT NULL AND revenue > 0
),
rev_prior AS (
    SELECT symbol, revenue AS prior_revenue,
        ROW_NUMBER() OVER (PARTITION BY symbol ORDER BY dateEpoch DESC) AS rn
    FROM income_statement
    WHERE period = 'FY' AND revenue IS NOT NULL AND revenue > 0
),
growth AS (
    SELECT rc.symbol, pd.sector,
        (rc.revenue - rp.prior_revenue) / rp.prior_revenue AS rev_growth,
        k.returnOnEquityTTM, k.marketCap, f.operatingProfitMarginTTM
    FROM rev_current rc
    JOIN rev_prior rp ON rc.symbol = rp.symbol AND rp.rn = 2
    JOIN key_metrics_ttm k ON rc.symbol = k.symbol
    JOIN financial_ratios_ttm f ON rc.symbol = f.symbol
    JOIN profile_data pd ON rc.symbol = pd.symbol
    WHERE rc.rn = 1 AND rp.prior_revenue > 0
      AND k.returnOnEquityTTM > 0.08
      AND f.operatingProfitMarginTTM > 0.05
      AND k.marketCap > 500000000
),
sector_stats AS (
    SELECT sector,
        PERCENTILE_CONT(0.5) WITHIN GROUP (ORDER BY rev_growth) AS median_growth
    FROM growth GROUP BY sector HAVING COUNT(*) >= 3
)
SELECT g.symbol, g.sector,
    ROUND(g.rev_growth * 100, 1) AS rev_growth_pct,
    ROUND((g.rev_growth - ss.median_growth) * 100, 1) AS excess_growth_pct,
    ROUND(g.returnOnEquityTTM * 100, 1) AS roe_pct,
    ROUND(g.operatingProfitMarginTTM * 100, 1) AS opm_pct,
    ROUND(g.marketCap / 1e9, 1) AS mktcap_bn
FROM growth g
JOIN sector_stats ss ON g.sector = ss.sector
WHERE (g.rev_growth - ss.median_growth) >= 0.10
ORDER BY excess_growth_pct DESC
LIMIT 30
The MCap floor of GBP 500M excludes small-cap names where data quality is thinner and liquidity is lower.
Limitations
FTSE 100 is price-only. The benchmark used here excludes dividends. UK large-caps have historically paid 3-4% dividend yields. The total return FTSE 100 would reduce the strategy's excess return relative to what's shown. The 56% win rate and +4.09% excess CAGR are calculated against the price index.
Currency exposure. LSE returns converted to USD. A weakening sterling reduces USD returns. Some of the strategy's underperformance in USD-converted terms reflects GBP weakness rather than underlying equity underperformance.
Sector clustering. The LSE has heavy exposure to energy (BP, Shell), mining (Rio Tinto, BHP), and financials. The sector-relative filter is designed to handle clustering, but in years where energy dominates (and the strategy picks energy market share winners), correlation within the portfolio rises.
Post-Brexit data. The 2016 Brexit vote changed the structural landscape of the LSE. Pre-2016 and post-2016 are different regimes. The 25-year backtest spans both, which may obscure regime-specific performance characteristics.
Takeaway
The UK market share signal works against the local benchmark. The FTSE 100 returned 1.23% CAGR (price-only) over 25 years while the strategy returned 5.31%, a 4.09% annual advantage with a 56% win rate.
The FTSE's composition explains the gap. The index's largest constituents are energy, mining, and financial companies that don't generate strong revenue growth. The market share signal finds the UK companies that are actually accelerating. In a market anchored to slow-growth cyclicals, the growers stand out.
The dividend caveat matters for sizing expectations accurately. Total return FTSE 100 narrows the gap. But a rules-based screen that consistently finds quality revenue accelerators in a stagnant market, across 25 years, is a meaningful result.
Data: Ceta Research (FMP financial data warehouse), 2000-2024. Full methodology: METHODOLOGY.md. Past performance does not guarantee future results. This is educational content, not investment advice.
References
- Jegadeesh, N. & Livnat, J. (2006). "Revenue Surprises and Stock Returns." Journal of Accounting and Economics, 41(1-2), 147-171.
- Piotroski, J. & So, E. (2012). "Identifying Expectation Errors in Value/Glamour Strategies." Review of Financial Studies, 25(9), 2841-2875.


