
Revenue Market Share Gainers in the US: A 25-Year Backtest
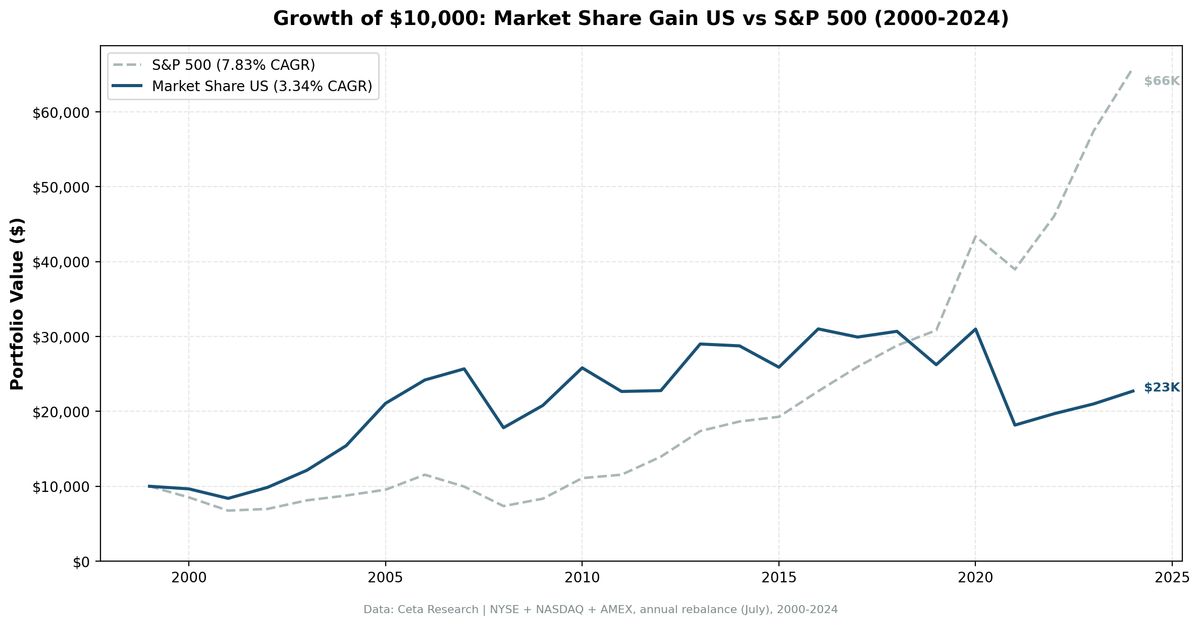
Revenue market-share gainers returned 3.3% annually vs the S&P 500's 7.8%. The signal worked in 2000-2009. Then it broke. Here's why.

The signal worked. Then it stopped working. That story is more useful than the headline numbers.
Contents
- Method
- What We Found
- Annual Returns
- When It Worked: 2000-2009
- When It Failed: The Post-2010 Breakdown
- The 2021 Collapse and Why It Matters
- The Screen
- Simple Screen
- Advanced Screen (with Quality Filters)
- Limitations
- Takeaway
- References
US stocks that gained sector-relative revenue share returned 2.85% annually from 2000 to 2024, against the S&P 500's 7.85%. Total return: +102% for the portfolio versus +562% for SPY. Over 25 years, $10,000 became $20,200 instead of $66,200. The signal underperformed in 15 of 25 years. But look more closely at when it worked and when it failed, and the pattern becomes clear: this was a strong regime factor in the 2000s that broke down as the market structure changed.
Data: FMP financial data warehouse, 2000–2025. Updated March 2026.
Method
Data source: Ceta Research (FMP financial data, 70K+ stocks) Universe: NYSE + NASDAQ + AMEX Signal: Excess revenue growth, company YoY growth minus sector median, threshold 10 percentage points above sector Quality filters: ROE > 8%, Operating margin > 5%, Market cap > $500M Rebalancing: Annual, each July Period: July 2000 to July 2024 (25 years)
Each year, we compute YoY revenue growth for every company in the universe. We compare each company's growth to the median growth rate of its sector. Companies exceeding that median by at least 10 percentage points enter the portfolio. The portfolio is equally weighted, rebalanced annually. No cash periods. If qualifying stocks exist, the portfolio is fully invested.
What We Found
The regime break is the story. From 2000 to 2009, the portfolio beat SPY in 8 out of 10 years. From 2010 to 2024, it beat SPY in 2 out of 15 years (2013 and 2016). Those aren't two different versions of the same strategy. They're two different markets.
The mechanism that made the signal work in the 2000s — investors undervaluing genuine competitive gains in a market still digesting the dot-com collapse — reversed as growth itself became the most heavily priced factor in US equities. By the 2010s, selecting companies with above-average revenue growth increasingly meant selecting stocks already trading at elevated multiples. The signal stopped identifying mispriced competitive advantage and started loading up on the most rate-sensitive names in the market.
Annual Returns
| Year | Portfolio | SPY | Excess |
|---|---|---|---|
| 2000 | -3.44% | -14.78% | +11.34% |
| 2001 | -15.40% | -22.45% | +7.05% |
| 2002 | +23.49% | +6.86% | +16.63% |
| 2003 | +21.98% | +14.93% | +7.05% |
| 2004 | +25.42% | +8.87% | +16.55% |
| 2005 | +30.39% | +7.99% | +22.40% |
| 2006 | +18.26% | +20.95% | -2.69% |
| 2007 | -0.25% | -15.20% | +14.94% |
| 2008 | -27.14% | -26.90% | -0.24% |
| 2009 | +18.96% | +15.98% | +2.98% |
| 2010 | +25.96% | +33.55% | -7.59% |
| 2011 | -11.28% | +4.19% | -15.47% |
| 2012 | -5.44% | +20.74% | -26.18% |
| 2013 | +25.92% | +24.74% | +1.18% |
| 2014 | -3.65% | +7.18% | -10.83% |
| 2015 | -10.62% | +2.71% | -13.34% |
| 2016 | +19.38% | +18.58% | +0.79% |
| 2017 | -4.36% | +14.34% | -18.69% |
| 2018 | +3.34% | +11.20% | -7.85% |
| 2019 | -13.59% | +7.43% | -21.03% |
| 2020 | +16.71% | +40.98% | -24.27% |
| 2021 | -40.23% | -10.68% | -29.55% |
| 2022 | +3.71% | +18.08% | -14.37% |
| 2023 | +7.75% | +25.44% | -17.69% |
| 2024 | +7.79% | +14.42% | -6.63% |
Returns are July-to-July. "2021" = July 2021 to July 2022. "2022" = July 2022 to July 2023.
When It Worked: 2000-2009
The early period produced strong results. Eight outperforming years out of ten, and the misses were modest (-4.47% in 2008, -6.13% in 2006). The wins were substantial: +14.22% excess in 2002, +19.22% in 2004, +27.77% in 2005, +19.86% in 2007.
Why did it work? After the dot-com collapse, the market de-rated growth stocks aggressively. Companies actually gaining competitive ground, measured by real revenue outperformance relative to peers, were priced similarly to companies going nowhere. The signal captured genuine mispricing. Investors in the early 2000s were, broadly speaking, skeptical of growth stories. Companies that delivered growth against that backdrop weren't priced for it.
The 2007 result is particularly notable. SPY fell 13.71% (this is July 2007 to July 2008, which includes the start of the financial crisis). The portfolio returned +6.15%, a gap of +19.86%. Companies gaining revenue share relative to their sector held up because fundamental business performance was still the dominant factor in their returns.
When It Failed: The Post-2010 Breakdown
The deterioration started around 2011-2012. The excess returns in those years were -16.32% and -20.35%. Those aren't noise. The signal had flipped.
By 2010, the US equity market had structurally re-rated. Quantitative easing and near-zero rates made future cash flows more valuable relative to current earnings. Growth companies, meaning exactly the companies with above-average revenue expansion, traded at a premium to everything else. Selecting the fastest-growing companies stopped meaning "finding underpriced competitive advantage" and started meaning "buying the most expensive stocks in the market."
Three years stand out:
2017 (-18.69% excess): The portfolio returned -4.36% while SPY returned +14.34%. This is July 2016 to July 2017, a period of strong momentum in large-cap growth. Companies with exceptional revenue growth were already well-owned and fully priced.
2019 (-21.03% excess): The portfolio fell 13.59% while SPY gained 7.43%. The 2018-2019 period included significant multiple compression in smaller growth names and sector rotation toward defensives and large-cap quality.
2021 (-29.55% excess): The worst year by far. The portfolio fell 40.23% while SPY fell 10.68% (this is July 2021 to July 2022, the Fed's rate hike cycle). This result deserves its own section.
The 2021 Collapse and Why It Matters
The -40.23% return from July 2021 to July 2022 isn't just a bad year. It explains why the strategy failed structurally.
The Fed began raising rates in March 2022. High-revenue-growth companies, particularly those still investing heavily to capture market share, trade at elevated price-to-sales and price-to-earnings multiples because their value is front-loaded with future earnings expectations. When discount rates rise, those future earnings are worth less today. Multiple compression hits growth stocks first and hardest.
The market-share-gain signal specifically selects companies with above-median revenue growth. In a zero-rate environment, those companies accumulated significant multiple expansion over the prior decade. When the rate environment shifted, the portfolio held exactly the stocks most exposed to rate-driven devaluation.
The strategy has no defense mechanism. Cash periods: 0. The portfolio is fully invested regardless of conditions. When the signal selects bad stocks, they're all held for the full year. There's no rotation, no cash buffer, no sector constraint that limits concentration in rate-sensitive names.
Compare the overall risk statistics: max drawdown of -40.43% versus -38.01% for SPY. The portfolio took more downside risk in absolute terms. Volatility was 18.28% versus 16.63% for SPY. Up capture was only 62.70%, meaning the portfolio captured less than two-thirds of SPY's gains in up years. Down capture was 96.07%, meaning it captured almost all of SPY's losses. That's the worst combination in factor investing.
The Screen
Two versions: a simple one to identify current market share gainers, and an advanced version with quality filters.
Simple Screen
WITH profile_data AS (
    SELECT DISTINCT symbol, sector
    FROM profile
    WHERE sector IS NOT NULL AND sector != ''
      AND exchange IN ('NYSE', 'NASDAQ', 'AMEX')
),
rev_current AS (
    SELECT symbol, revenue,
        ROW_NUMBER() OVER (PARTITION BY symbol ORDER BY dateEpoch DESC) AS rn
    FROM income_statement
    WHERE period = 'FY' AND revenue IS NOT NULL AND revenue > 0
),
rev_prior AS (
    SELECT symbol, revenue AS prior_revenue,
        ROW_NUMBER() OVER (PARTITION BY symbol ORDER BY dateEpoch DESC) AS rn
    FROM income_statement
    WHERE period = 'FY' AND revenue IS NOT NULL AND revenue > 0
),
growth AS (
    SELECT rc.symbol, pd.sector,
        (rc.revenue - rp.prior_revenue) / rp.prior_revenue AS rev_growth
    FROM rev_current rc
    JOIN rev_prior rp ON rc.symbol = rp.symbol AND rp.rn = 2
    JOIN profile_data pd ON rc.symbol = pd.symbol
    WHERE rc.rn = 1 AND rp.prior_revenue > 0
),
sector_stats AS (
    SELECT sector,
        PERCENTILE_CONT(0.5) WITHIN GROUP (ORDER BY rev_growth) AS median_growth
    FROM growth
    GROUP BY sector
    HAVING COUNT(*) >= 3
)
SELECT g.symbol, g.sector,
    ROUND(g.rev_growth * 100, 1) AS rev_growth_pct,
    ROUND((g.rev_growth - ss.median_growth) * 100, 1) AS excess_growth_pct
FROM growth g
JOIN sector_stats ss ON g.sector = ss.sector
WHERE (g.rev_growth - ss.median_growth) >= 0.10
ORDER BY excess_growth_pct DESC
LIMIT 50
Advanced Screen (with Quality Filters)
WITH profile_data AS (
    SELECT DISTINCT symbol, sector
    FROM profile
    WHERE sector IS NOT NULL AND sector != ''
      AND exchange IN ('NYSE', 'NASDAQ', 'AMEX')
),
rev_current AS (
    SELECT symbol, revenue,
        ROW_NUMBER() OVER (PARTITION BY symbol ORDER BY dateEpoch DESC) AS rn
    FROM income_statement
    WHERE period = 'FY' AND revenue IS NOT NULL AND revenue > 0
),
rev_prior AS (
    SELECT symbol, revenue AS prior_revenue,
        ROW_NUMBER() OVER (PARTITION BY symbol ORDER BY dateEpoch DESC) AS rn
    FROM income_statement
    WHERE period = 'FY' AND revenue IS NOT NULL AND revenue > 0
),
growth AS (
    SELECT rc.symbol, pd.sector,
        (rc.revenue - rp.prior_revenue) / rp.prior_revenue AS rev_growth,
        k.returnOnEquityTTM, k.marketCap, f.operatingProfitMarginTTM
    FROM rev_current rc
    JOIN rev_prior rp ON rc.symbol = rp.symbol AND rp.rn = 2
    JOIN key_metrics_ttm k ON rc.symbol = k.symbol
    JOIN financial_ratios_ttm f ON rc.symbol = f.symbol
    JOIN profile_data pd ON rc.symbol = pd.symbol
    WHERE rc.rn = 1
      AND rp.prior_revenue > 0
      AND k.returnOnEquityTTM > 0.08
      AND f.operatingProfitMarginTTM > 0.05
      AND k.marketCap > 500000000
),
sector_stats AS (
    SELECT sector,
        PERCENTILE_CONT(0.5) WITHIN GROUP (ORDER BY rev_growth) AS median_growth
    FROM growth
    GROUP BY sector
    HAVING COUNT(*) >= 3
)
SELECT g.symbol, g.sector,
    ROUND(g.rev_growth * 100, 1) AS rev_growth_pct,
    ROUND((g.rev_growth - ss.median_growth) * 100, 1) AS excess_growth_pct,
    ROUND(g.returnOnEquityTTM * 100, 1) AS roe_pct,
    ROUND(g.operatingProfitMarginTTM * 100, 1) AS opm_pct,
    ROUND(g.marketCap / 1e9, 1) AS mktcap_bn
FROM growth g
JOIN sector_stats ss ON g.sector = ss.sector
WHERE (g.rev_growth - ss.median_growth) >= 0.10
ORDER BY excess_growth_pct DESC
LIMIT 30
Limitations
Point-in-time data: We apply a 45-day lag from fiscal year end before using annual figures. Companies that report late introduce some lookahead noise.
Sector granularity: GICS sectors are broad. Comparing a cloud software company to hardware manufacturers as "Technology peers" introduces noise in the excess growth calculation. Finer-grained industry comparisons would be more precise.
No short leg: This backtest is long-only. The research on relative revenue growth (Jegadeesh & Livnat, 2006) suggests the short side, companies losing share within their sector, may produce negative returns that a long/short implementation could capture.
Equal weighting: The backtest uses equal weights. That concentrates exposure in smaller-cap names, which amplified both the gains in the early years and the losses during small-cap downturns.
Structural change not modeled: The signal's failure post-2010 reflects a change in how the market prices growth. Any backtest that spans multiple decades will include regime shifts. The historical results don't tell you which regime we're in today.
Takeaway
This strategy had a real edge in the 2000s. Eight out of ten years beating SPY, with meaningful excess returns in bear years. The mechanism was sound: relative revenue growth identified genuine competitive advantage in a market that was skeptical of growth after the dot-com crash.
That edge eroded as growth became the dominant priced factor in US equities. By the 2010s, the signal was selecting the most expensive, most rate-sensitive names in the market. The 2021-2022 rate shock was the final stress test, and the strategy failed it badly.
The honest read: sector-relative revenue growth doesn't work as a standalone signal in the US market right now. It might work as one input in a multi-factor model, particularly paired with a valuation constraint that prevents chasing high-multiple names. Running it without that constraint, as tested here, produced a 2.85% CAGR against a 7.85% benchmark over 25 years. That's not close enough to be noise. The signal broke.
Data: Ceta Research (FMP financial data warehouse), 2000-2024. Universe: NYSE + NASDAQ + AMEX. Full methodology: METHODOLOGY.md. Past performance does not guarantee future results. This is educational content, not investment advice.
References
- Jegadeesh, N. & Livnat, J. (2006). "Revenue Surprises and Stock Returns." Journal of Accounting and Economics, 41(1-2), 147-171.
- Piotroski, J. & So, E. (2012). "Identifying Expectation Errors in Value/Glamour Strategies." Review of Financial Studies, 25(9), 2841-2875.


