
12-Month Momentum on Indian Stocks: 17.33% CAGR Over 25 Years
Pure 12-month price momentum on NSE stocks from 2000 to 2025 returned 17.33% annually, +5.98% per year over the Sensex. The portfolio captured 118% of the Sensex''s upside with only 63% of its downside. India is where the momentum factor works.

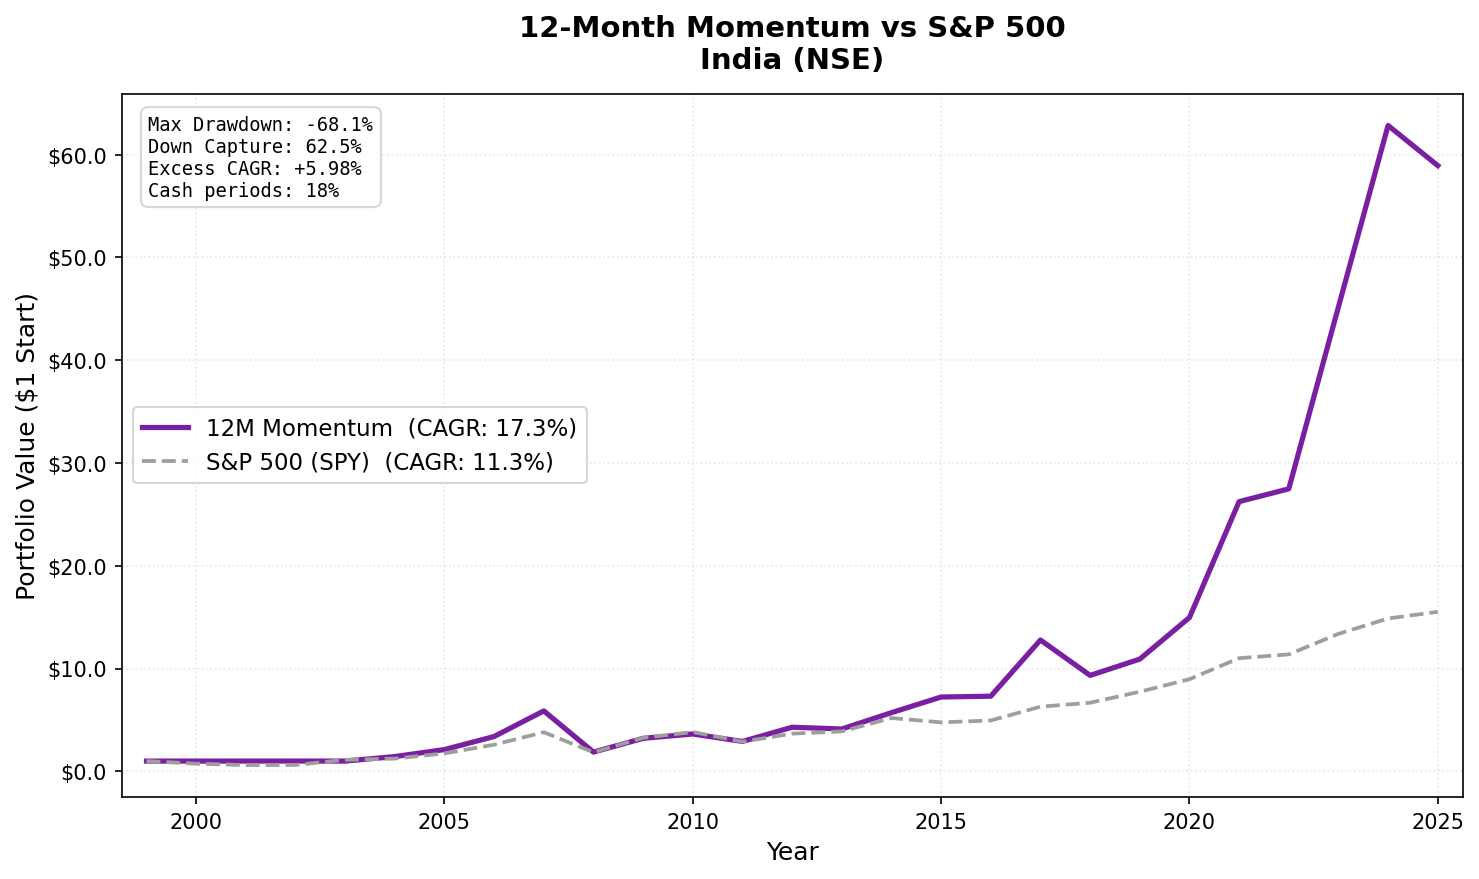
Pure price momentum works in India. Buying the top 30 NSE stocks by 12-month trailing return, semi-annually, delivered 17.33% annually from 2004 to 2025. That's +5.98% per year over the Sensex. The portfolio captured 118% of the Sensex's upside with 63% of its downside. The factor is alive in a market where it hasn't been systematically traded to exhaustion.
Contents
- Method
- What We Found
- Backtest Methodology
- Limitations
- Takeaway
- Part of a Series
- References
- Run This Screen Yourself
Data: FMP financial data warehouse, 2000–2025. Updated May 2026.
Method
| Parameter | Value |
|---|---|
| Universe | NSE (National Stock Exchange of India) |
| Rebalancing | Semi-annual (January, July) |
| Signal | 12-month return, skip last month (12M-1M) |
| Selection | Top 30 by momentum, equal weight |
| Cash rule | Fewer than 10 qualifying stocks |
| Data source | FMP via Ceta Research warehouse |
| Benchmark | BSE Sensex (^BSESN) |
| Execution | Next-day close (MOC) |
| Period | 2000–2025 |
| Market cap filter | > ₹20B (~$240M USD, point-in-time, 45-day lag) |
India started with 0% invested through 2003. The combination of market cap threshold and momentum data requirements excluded the full NSE universe in those early periods. The live backtest ran from the first period with 10+ qualifying stocks (mid-2004 entry).
What We Found
25-year summary (2000–2025):
| Metric | 12M Momentum | Sensex (^BSESN) |
|---|---|---|
| CAGR | 17.33% | 11.35% |
| Total Return | 5,792.9% | 1,451.8% |
| Sharpe Ratio | 0.370 | n/a |
| Max Drawdown | -68.13% | -51.34% |
| Down Capture | 62.53% | 100% |
| Up Capture | 118.40% | 100% |
| Cash Periods | 9 of 51 (18%) |
The total return difference is significant. $1 invested in the strategy in 2000 became $58.9 by 2025. The same dollar in the Sensex became $15.5. The 5,793% vs 1,452% comparison reflects what +5.98% annual excess return compounds to over 25 years.
The down capture of 62.53% looks like downside protection, but most of it is mechanical. The strategy held cash from 2000 through early 2004 (too few NSE stocks had data to qualify), booking 0% while the Sensex fell 25% in 2000 and 19% in 2001. That is avoidance by data coverage, not by design. And in the one major crash the strategy was actually invested for, 2008, it fell harder than the index: -68% vs -51%. Read the down-capture figure as flattered by the early cash window, not as evidence of structural defensiveness.
The 2008 exception. Momentum couldn't protect against the global financial crisis. The strategy fell -68.1% in 2008 vs the Sensex's -51.3%, the worst single-year performance in the dataset. Indian equities were caught in the same forced-selling wave as global risk assets. The subsequent recovery was fast: +71.4% in 2009.
Year-by-year standouts:
| Year | 12M Momentum | Sensex | Notes |
|---|---|---|---|
| 2005 | +47.3% | +40.6% | India structural growth peak |
| 2007 | +73.4% | +46.8% | Pre-crisis momentum |
| 2008 | -68.1% | -51.3% | Global crisis, worst year |
| 2009 | +71.4% | +76.3% | Recovery, tracked Sensex |
| 2017 | +74.8% | +27.1% | Domestic consumption boom |
| 2021 | +75.4% | +22.8% | Post-COVID recovery |
| 2022 | +4.7% | +3.4% | Domestic outperformance year |
| 2023 | +64.4% | +17.5% | Infrastructure/domestic rally |
2022 is a demonstration of the down capture story. The Sensex gained 3.4%, while the India momentum portfolio gained 4.7%. Even in a low-growth year, momentum names with genuine earnings strength held up.
The bull market magnification. Up capture of 118.40% means the portfolio amplified Indian bull markets. The years 2005, 2007, 2017, 2021, and 2023 all show the strategy running well above the Sensex. Indian equity bull markets have been concentrated in specific sectors, and momentum captures that concentration.
Backtest Methodology
- Data: FMP financial data via Ceta Research warehouse. Price data from
stock_eod(adjusted closes). - Point-in-time: Market cap filter uses annual
key_metricsfilings with 45-day lag. No look-ahead bias. Indian filings typically arrive April-May for fiscal year ending March. - Signal: Price at T-12M to T-1M. The 1-month skip avoids short-term reversal contamination.
- Data quality: Oscillation filter removes phantom holiday rows from adjClose. Stocks with adjusted close < $1 at either lookback date excluded. Momentum capped at 500% per stock.
- Cash periods: 18% of semi-annual periods had fewer than 10 qualifying stocks. These periods contribute 0% return (no positions taken). All nine fall in a continuous block from 2000 through early 2004, when FMP coverage of NSE was thinner. Because some of those windows were falling markets (2000, 2001), the cash position mechanically improves the down-capture and drawdown statistics.
- Equal weight: 30 positions when invested. No intraperiod rebalancing.
- Transaction costs: Modeled as size-tiered. Indian liquidity is lower than US, so costs are higher in the model.
- Benchmark: BSE Sensex (^BSESN) total return. Returns are in local currency (INR) terms.
- Entry execution: Next-day close (MOC model). Signals generated from prior close, positions entered at next trading day's close.
Limitations
Survivorship bias is the biggest caveat. The universe is drawn from currently listed NSE stocks (FMP's profile table), so companies that delisted, went bankrupt, or were acquired between 2000 and 2025 are largely absent. We checked the data directly: of roughly 2,800 NSE names, effectively none stopped trading before 2020. A strategy that ranks stocks by trailing return is the design most exposed to this. It systematically selects past winners that survived, while the high-momentum names that later collapsed are missing from the pool. This inflates the result. Treat the 17.33% CAGR and +5.98% excess as an optimistic upper bound rather than an achievable return. The bias is a property of the dataset, not something specific to India.
Local currency returns. The benchmark is the Sensex (INR). Returns are in local currency terms. For non-INR investors, currency fluctuations would affect realized returns. From 2000 to 2025, the INR depreciated roughly 50% against the USD, so USD-denominated returns would be lower.
2008 shows the tail risk. A -68.13% max drawdown is severe. The fast recovery is historically documented, but a drawdown that large requires patience most investors don't have.
18% cash periods in early data. Coverage of NSE in FMP's database is thinner before 2004, so the strategy held cash continuously from 2000 through early 2004. Because some of those windows were falling markets, the cash position flatters the down-capture and drawdown figures. Those numbers reflect data availability, not a timing skill the strategy actually has.
Emerging market structural risks. FPI limits, SEBI regulatory changes, and market access restrictions are real ongoing factors that can change the investability of this strategy. The historical backtest doesn't account for these.
No transaction costs in emerging market context. The model uses size-tiered costs, but Indian mid-cap liquidity can be thin. Actual execution costs for a large position would be higher than modeled.
Takeaway
12-month momentum on NSE stocks delivered 17.33% CAGR from 2000 to 2025, +5.98% over the Sensex in the raw backtest. Two caveats sit on top of that number. First, survivorship bias inflates it: ranking by trailing return on a survivors-only universe selects winners that lived, so the true investable figure is lower. Second, the 62.53% down capture is flattered by the 2000–2003 cash window. In the one crash the strategy was fully invested for (2008), it fell harder than the index.
The explanation likely involves market structure. Indian equities are driven by domestic growth cycles, consumer expansion, and infrastructure investment. Momentum in this environment captures real economic trends that persist for 6-12 months. The market is also less saturated with systematic momentum traders compared to US equities.
The 2008 risk remains the main caution, and 2008 shows the strategy offered no protection when it was fully invested. The honest read: momentum in India looks strong in this backtest, but part of the edge is survivorship and the apparent downside protection is mostly a coverage artifact. The signal is worth studying, not deploying on these numbers alone.
Part of a Series
This is part of a multi-exchange 12-month momentum study:
- 12M Momentum: Global 18-Exchange Comparison, published April 14
- 12M Momentum: Germany Best Sharpe in 18 Exchanges, published April 18
- 12M Momentum: UK Consistent Alpha, Low Down Capture, published April 20
- 12M Momentum: US Matches SPY with Double the Drawdown, published April 23
Data: Ceta Research (FMP financial data warehouse), 2000–2025. Universe: NSE, market cap > ₹20B (point-in-time, 45-day lag). Full methodology: METHODOLOGY.md. Past performance does not guarantee future results. This is educational content, not investment advice.
References
- Jegadeesh, N. & Titman, S. (1993). Returns to Buying Winners and Selling Losers. Journal of Finance, 48(1), 65-91.
- Asness, C., Moskowitz, T. & Pedersen, L. (2013). Value and Momentum Everywhere. Journal of Finance.
- Daniel, K. & Moskowitz, T. (2016). Momentum Crashes. Journal of Financial Economics.
Run This Screen Yourself
The current 12-month momentum screen for Indian stocks is live on Ceta Research:
cetaresearch.com/data-explorer?q=9S2cYgWPNk
-- 12-Month Momentum India Screen
-- Live at: cetaresearch.com/data-explorer?q=9S2cYgWPNk
WITH universe AS (
    SELECT p.symbol, p.companyName, p.exchange, k.marketCap / 1e9 AS market_cap_billions
    FROM profile p JOIN key_metrics_ttm k ON p.symbol = k.symbol
    WHERE k.marketCap > 20000000000 AND p.isActivelyTrading = true
      AND p.exchange IN ('NSE')
),
price_12m_ago AS (
    SELECT symbol, adjClose AS price_12m,
           ROW_NUMBER() OVER (PARTITION BY symbol ORDER BY ABS(CAST(dateEpoch AS BIGINT) -
               CAST(EXTRACT(EPOCH FROM (CURRENT_DATE - INTERVAL '365' DAY))::BIGINT AS BIGINT))) AS rn
    FROM stock_eod
    WHERE CAST(date AS DATE) BETWEEN CURRENT_DATE - INTERVAL '395' DAY
                                 AND CURRENT_DATE - INTERVAL '335' DAY
      AND adjClose > 0
),
price_1m_ago AS (
    SELECT symbol, adjClose AS price_1m,
           ROW_NUMBER() OVER (PARTITION BY symbol ORDER BY ABS(CAST(dateEpoch AS BIGINT) -
               CAST(EXTRACT(EPOCH FROM (CURRENT_DATE - INTERVAL '30' DAY))::BIGINT AS BIGINT))) AS rn
    FROM stock_eod
    WHERE CAST(date AS DATE) BETWEEN CURRENT_DATE - INTERVAL '45' DAY
                                 AND CURRENT_DATE - INTERVAL '15' DAY
      AND adjClose > 0
)
SELECT u.symbol, u.companyName, u.exchange,
    ROUND(u.market_cap_billions, 2) AS market_cap_billions,
    ROUND((p1m.price_1m - p12.price_12m) / p12.price_12m * 100, 1) AS return_12m_1m_pct
FROM universe u
JOIN price_12m_ago p12 ON u.symbol = p12.symbol AND p12.rn = 1
JOIN price_1m_ago p1m ON u.symbol = p1m.symbol AND p1m.rn = 1
WHERE p12.price_12m > 1.0 AND p1m.price_1m > 1.0
  AND (p1m.price_1m - p12.price_12m) / p12.price_12m <= 5.0
ORDER BY return_12m_1m_pct DESC NULLS LAST
LIMIT 30;


