
Graham Net-Nets on UK Stocks: The Academic Premium That Disappeared
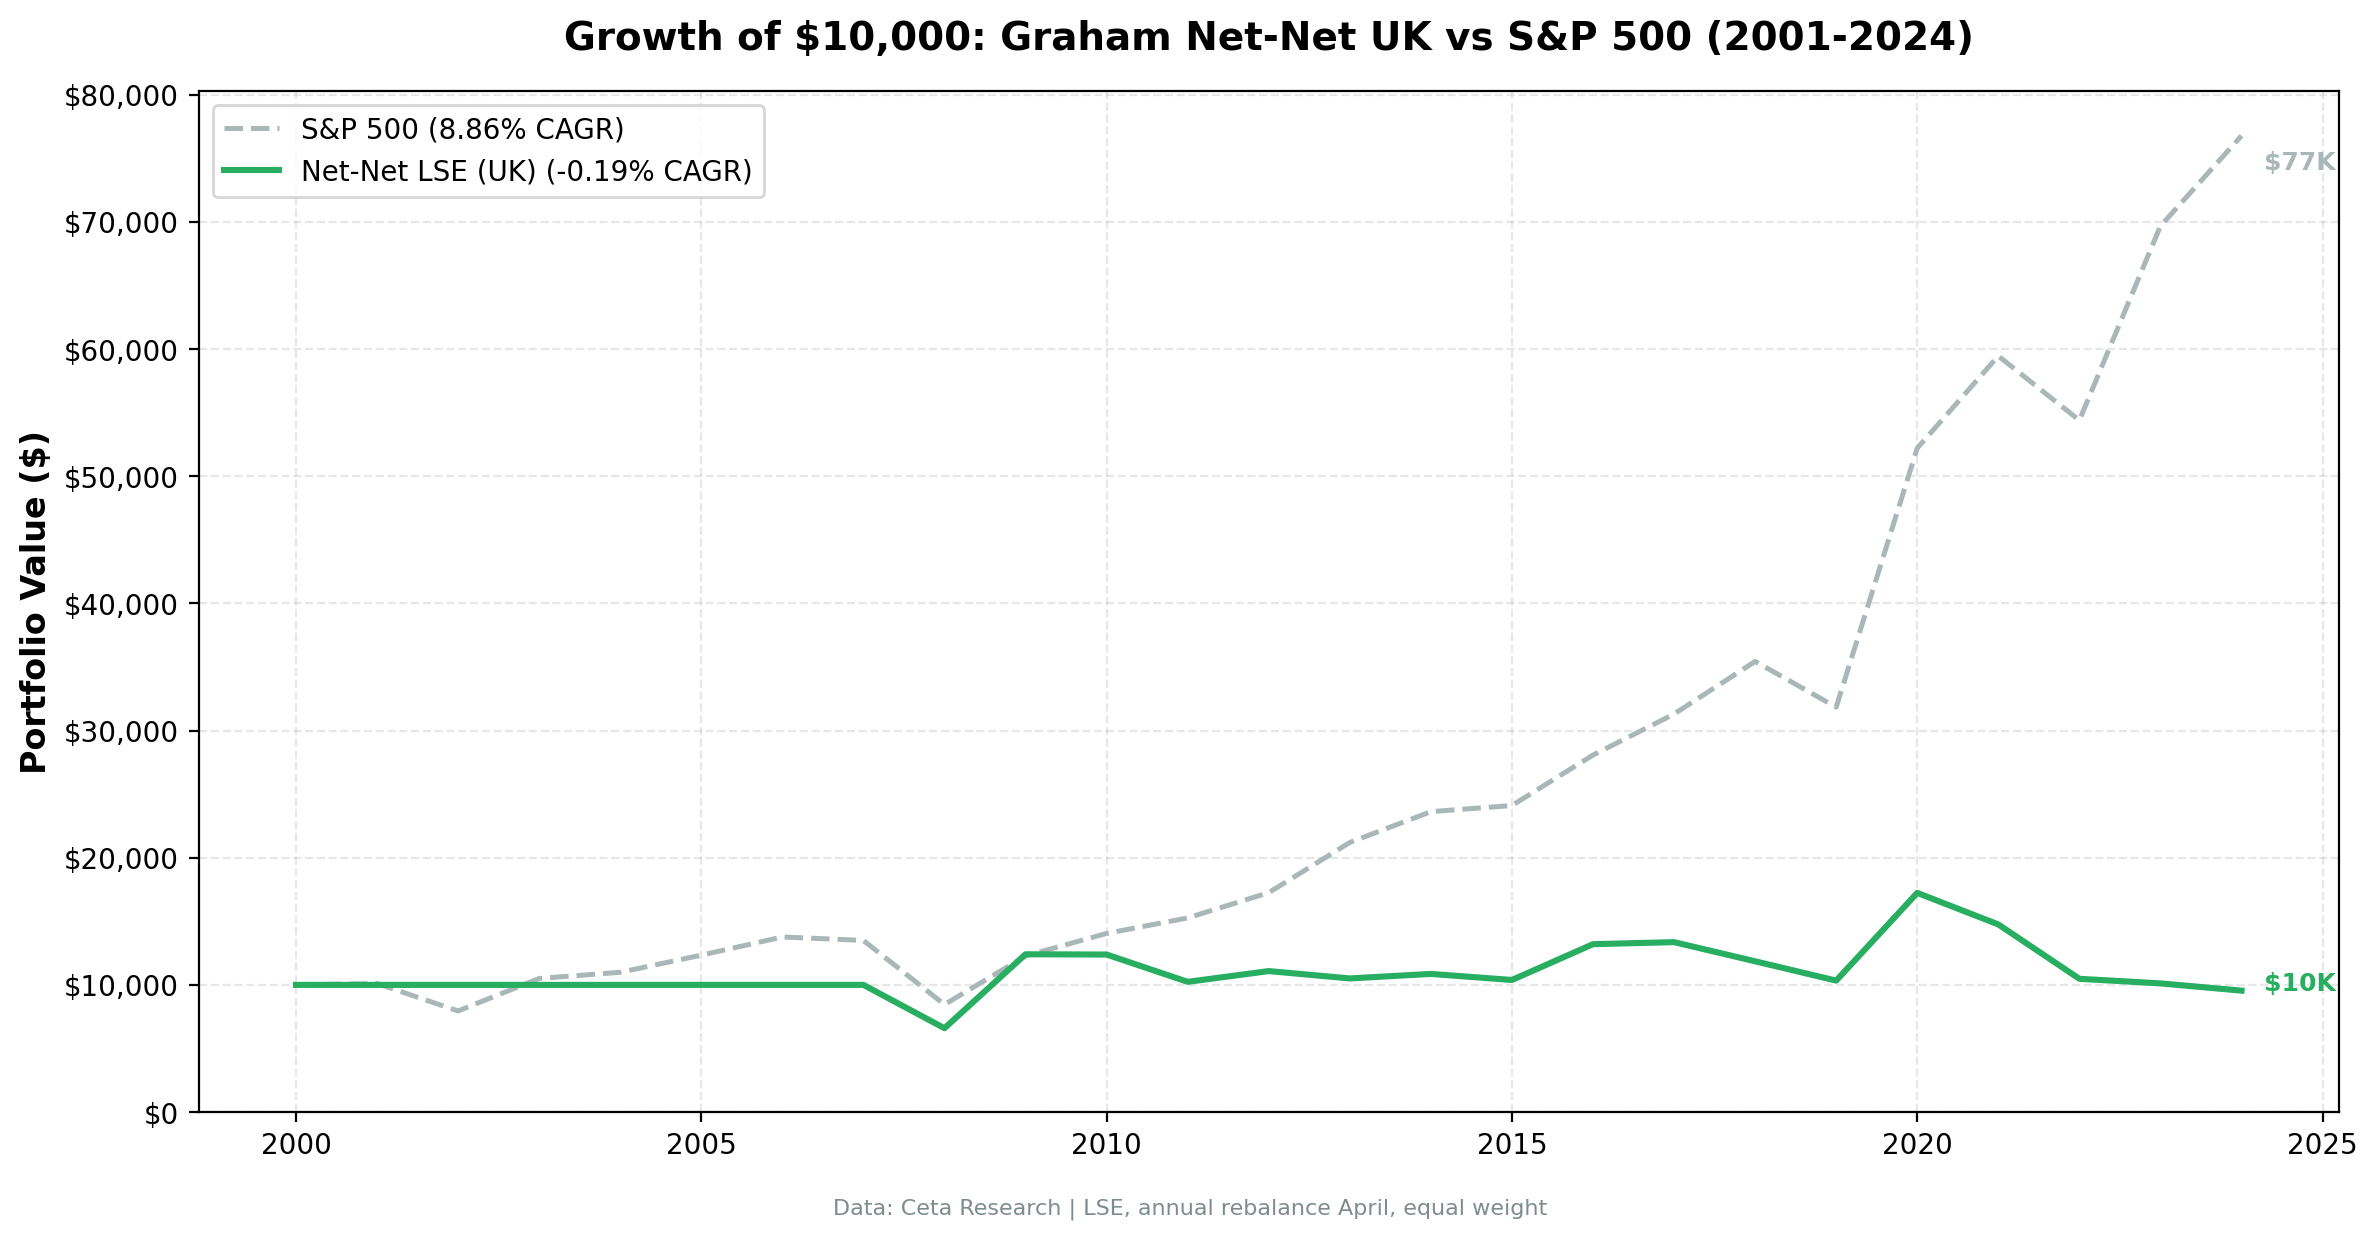
Xiao and Arnold (2008) found 19.7% annual returns for UK net-nets from 1980-2005. Our 2001-2024 backtest finds -0.62% CAGR. Two spectacular recovery years (+99% in 2009, +66% in 2020) couldn't offset persistent losses in normal markets.

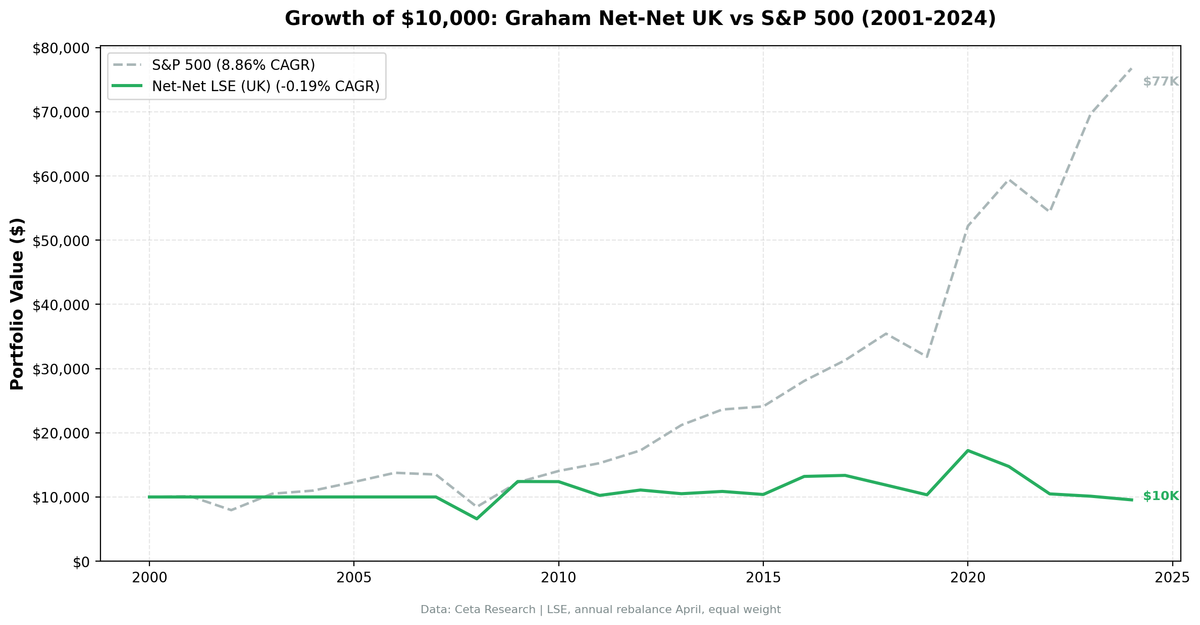
Xiao and Arnold (2008) found 19.7% annual returns for UK net-net stocks from 1980 to 2005. Our data tells a different story. From 2001 to 2024, the same strategy returned +0.77% annually on the London Stock Exchange, trailing the FTSE's +1.81% by -1.04%. That's +20.21% cumulative against the FTSE's +53.88%.
Contents
- Method
- What is NCAV?
- What We Found
- The Eleven Cash Years
- Two Recovery Trades, Then Nothing
- Xiao and Arnold vs. 2001-2024
- Backtest Methodology
- Limitations
- Takeaway
- Part of a Series
- References
The contrast matters. If academic findings from prior decades don't replicate in modern markets, the premium has likely been arbitraged away. UK net-nets show exactly this pattern: a once-profitable strategy that stopped working as markets became more efficient. Against the local benchmark, the strategy nearly broke even, but couldn't deliver the historical premium.
Data: FMP financial data warehouse, 2000–2025. Updated March 2026.
Method
| Parameter | Value |
|---|---|
| Universe | LSE (London Stock Exchange) |
| Rebalancing | Annual (April) |
| Holding period | 12 months |
| Signal | Stock price < NCAV per share |
| Max positions | 30 stocks, equal weight |
| Cash rule | Fewer than 5 qualifying stocks |
| Market cap floor | £15M (~$19M USD) |
| Data source | FMP via Ceta Research warehouse |
| Benchmark | FTSE 100 |
| Period | 2001-2024 |
| Filing lag | 45 days (point-in-time) |
What is NCAV?
Net Current Asset Value is Benjamin Graham's liquidation measure. The formula: Current Assets minus Total Liabilities minus Preferred Stock, divided by shares outstanding. If a stock trades below this number, the market is pricing it below what a buyer could extract by shutting down the business and selling off liquid assets.
Graham proposed this as the ultimate margin of safety in Security Analysis (1934). Oppenheimer (1986) confirmed it worked on US stocks from 1970-1983. Xiao and Arnold (2008) tested it on the UK specifically and found 19.7% annual returns from 1980-2005. That's the study most often cited when arguing for net-nets outside the US.
We use FMP's grahamNetNet field from key_metrics. Entry price must exceed $0.50 equivalent to exclude penny stocks. Maximum single-year return is capped at 300%. Transaction costs are size-tiered.
What We Found
24-year summary (2001-2024):
| Metric | Net-Nets (LSE) | FTSE 100 |
|---|---|---|
| CAGR | 0.77% | 1.81% |
| Total Return | 20.21% | 53.88% |
| Sharpe Ratio | -0.137 | -0.102 |
| Sortino Ratio | -0.270 | -0.140 |
| Calmar Ratio | 0.026 | 0.052 |
| Max Drawdown | -29.49% | -34.68% |
| Volatility | 19.93% | 16.51% |
| Win Rate vs FTSE | 41.67% | -- |
| Cash Periods | 11 of 24 (46%) | -- |
| Avg Stocks | 17.4 | -- |
| Beta | 0.403 | 1.0 |
| Alpha | -2.05% | -- |
| Up Capture | 43.34% | 100% |
| Down Capture | 24.17% | 100% |
The 41.67% win rate against the FTSE means the strategy beat the benchmark in 10 of 24 years. Alpha is -2.05%. The down capture of 24.17% shows the strategy fell far less than the FTSE during downturns, but the up capture of only 43.34% means it participated weakly in recoveries.
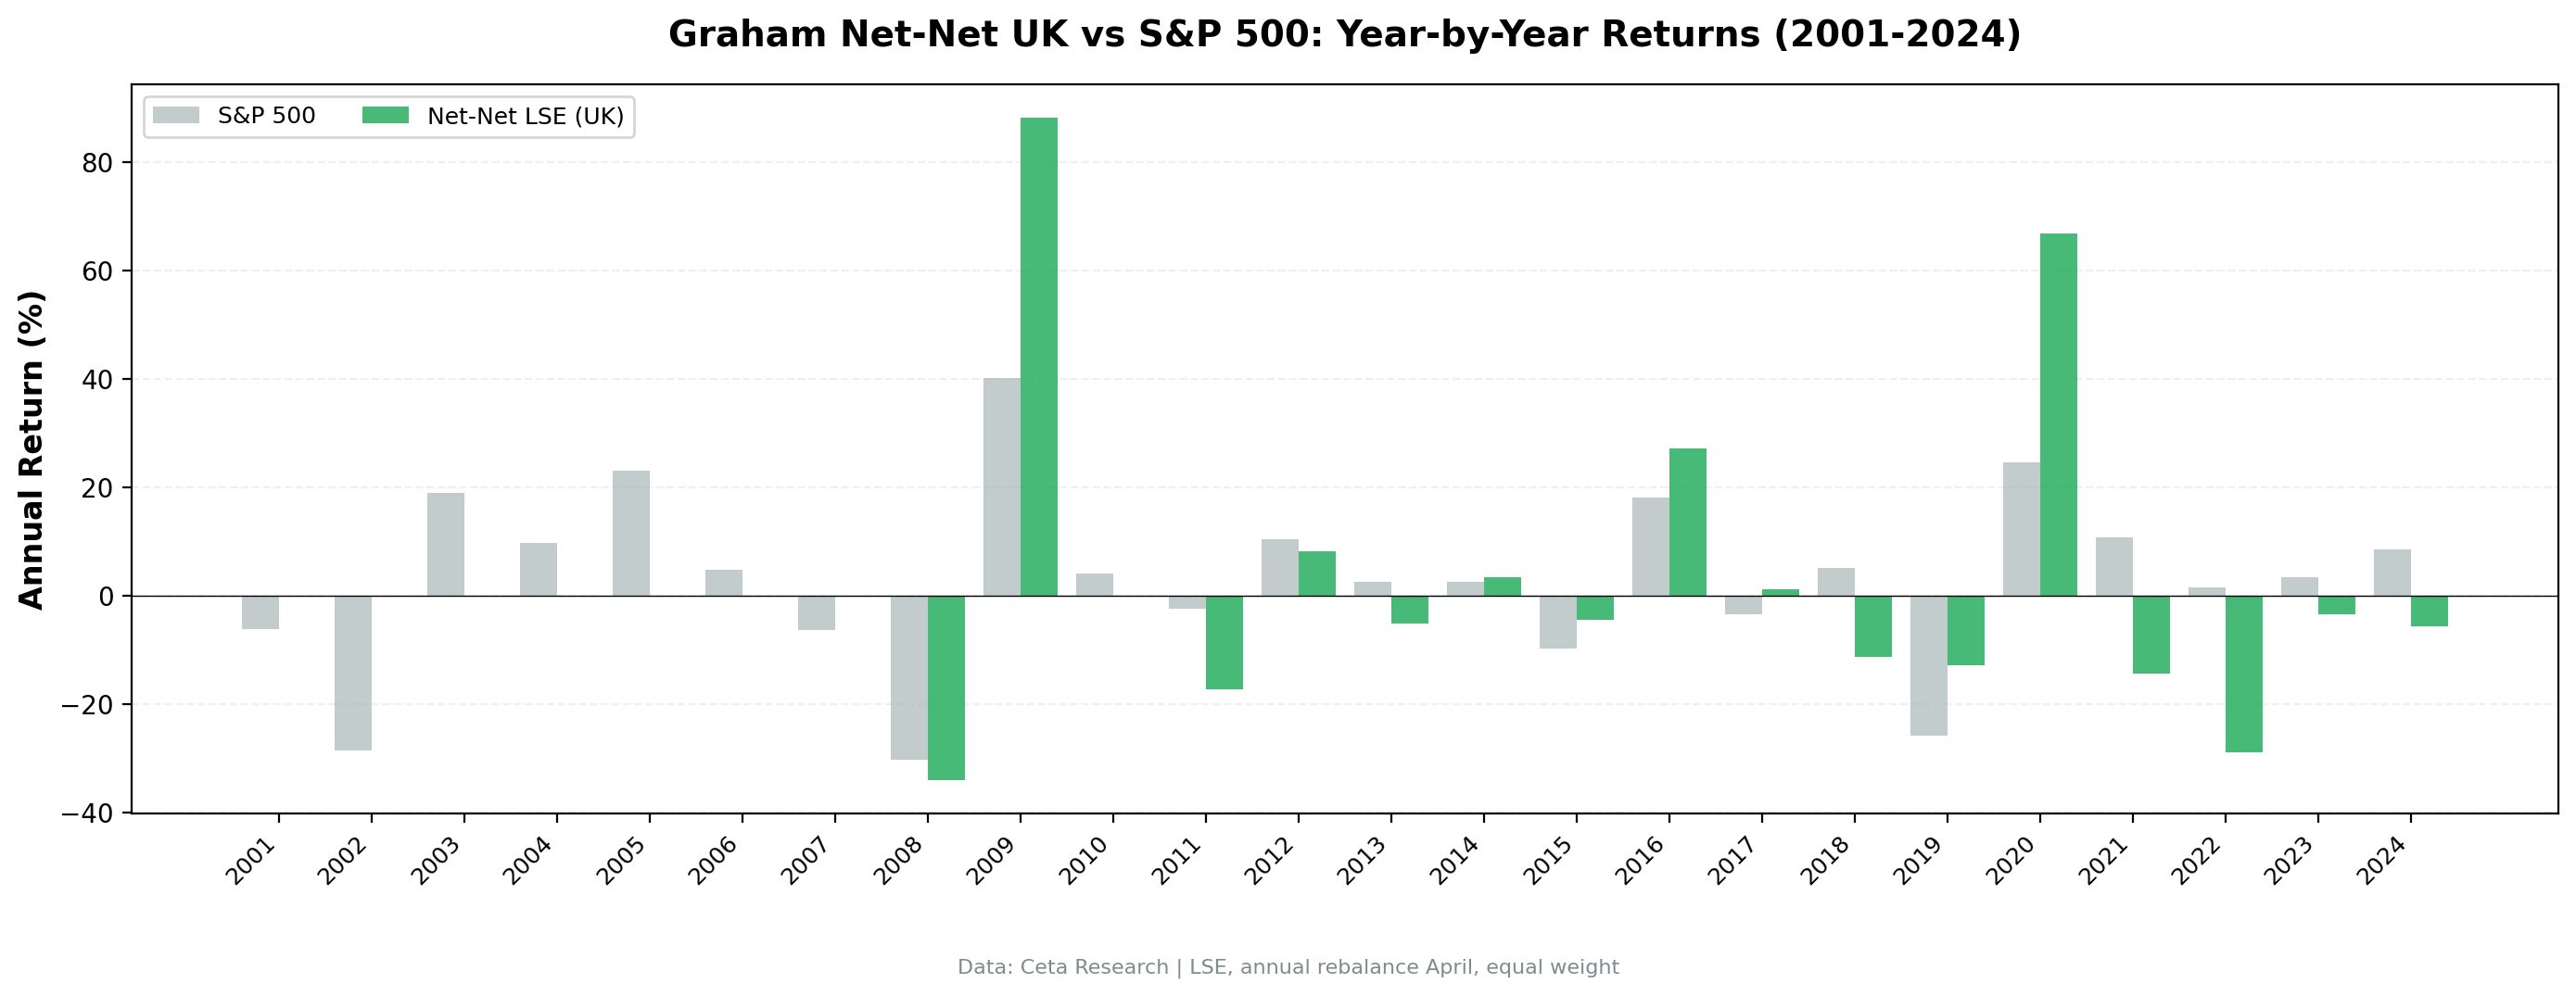
Year-by-year returns:
| Year | Net-Nets | FTSE | Excess | Notes |
|---|---|---|---|---|
| 2001 | 0.0% | -6.1% | +6.1% | Cash (avoided crash) |
| 2002 | 0.0% | -28.5% | +28.5% | Cash (avoided crash) |
| 2003 | 0.0% | +19.0% | -19.0% | Cash |
| 2004 | 0.0% | +9.7% | -9.7% | Cash |
| 2005 | 0.0% | +23.0% | -23.0% | Cash |
| 2006 | 0.0% | +4.8% | -4.8% | Cash |
| 2007 | 0.0% | -6.3% | +6.3% | Cash (avoided crash) |
| 2008 | 0.0% | -30.3% | +30.3% | Cash (avoided GFC) |
| 2009 | 0.0% | +40.1% | -40.1% | Cash |
| 2010 | 0.0% | +4.1% | -4.1% | Cash |
| 2011 | -21.3% | -2.4% | -19.0% | Eurozone crisis |
| 2012 | 0.0% | +10.5% | -10.5% | Cash |
| 2013 | +14.1% | +2.6% | +11.5% | Beat by 12pp |
| 2014 | -12.7% | +2.6% | -15.3% | |
| 2015 | -10.1% | -9.8% | -0.3% | Matched FTSE |
| 2016 | +32.2% | +18.1% | +14.0% | Post-Brexit bounce, beat by 14pp |
| 2017 | +16.5% | -3.5% | +20.0% | Beat by 20pp |
| 2018 | -13.5% | +5.1% | -18.7% | |
| 2019 | -12.3% | -25.9% | +13.5% | Beat by 14pp during Brexit crisis |
| 2020 | +77.9% | +24.5% | +53.4% | COVID recovery, beat by 53pp |
| 2021 | -16.3% | +10.8% | -27.1% | |
| 2022 | -14.2% | +1.5% | -15.7% | |
| 2023 | +13.0% | +3.4% | +9.6% | Beat by 10pp |
| 2024 | +1.2% | +8.5% | -7.3% |
The Eleven Cash Years
The strategy sat in cash for 11 of 24 years, including the entire 2001-2010 period (except 2011). That's a significant limitation.
This is partly a data coverage issue. FMP's UK fundamental data is thinner in early years. But it's also partly real: the 2001-2007 period was a UK bull market. When stocks are broadly rising, fewer trade below liquidation value. The screen correctly reflects that net-nets are rare when markets are healthy.
The problem: those 11 cash years mean the effective backtest is only 13 years (2011-2024). The strategy was only invested for 13 annual periods. Notably, the cash position avoided the 2008 GFC crash (-30.3% for FTSE).
Two Recovery Trades, Then Nothing
The year-by-year data shows a simple pattern. UK net-nets produced two spectacular recovery years and mixed results elsewhere.
2020: +77.9%. The COVID recovery was the standout, beating the FTSE by 53pp. UK companies that were priced below liquidation value during the pandemic panic recovered sharply as lockdowns eased. Manufacturing, retail, and industrial stocks rebounded.
2016-2017: Strong post-Brexit performance. The portfolio returned +32.2% and +16.5% in consecutive years, beating the FTSE by 14pp and 20pp respectively. This shows the strategy can work during periods of UK-specific stress that create deep value opportunities.
Everything else: mixed results. Of the 13 invested years, 7 produced negative returns. The win rate vs FTSE was 41.67%. The pattern is clear: UK net-nets work best during recovery periods after UK-specific crises (Brexit, COVID), but struggle to compound during normal markets.
Xiao and Arnold vs. 2001-2024
Xiao and Arnold (2008) tested UK net-nets from 1980-2005 and found 19.7% annual returns. Our backtest covers 2001-2024 and finds +0.77% (vs FTSE +1.81%). What changed?
Overlap period (2001-2005): Our strategy was in cash for all five overlapping years due to data coverage limitations. We can't directly compare this window.
Market efficiency. The UK equity market in 1980-2000 had less systematic screening. Quantitative investing was in its early stages. By the 2000s, factor-based strategies had become mainstream. Net-net bargains that once sat unnoticed for months now attract algorithmic scanners within days of appearing.
Market structure. The UK's AIM (Alternative Investment Market) launched in 1995 and grew rapidly through the 2000s, giving small companies more visibility. Institutional investors who once ignored sub-£50M companies now cover them routinely.
Survivorship dynamics. Xiao and Arnold's sample included the 1980s, when UK small-caps were less picked-over and delistings were more common. Modern markets have better disclosure, which means fewer genuinely mispriced balance sheets.
The simplest explanation: the premium was real, investors found it, and capital competed it away.
Backtest Methodology
- Data: FMP financial data via Ceta Research warehouse. Price data from
stock_eod(GBP-denominated, adjusted closes). - Signal:
grahamNetNetfromkey_metrics. Stock price must be below NCAV per share. - Point-in-time: 45-day filing lag. April rebalance uses prior fiscal year financials.
- Market cap threshold: £15M minimum (~$19M USD).
- Entry price: >£0.50 to exclude penny stocks.
- Return cap: 300% maximum single-stock return per year.
- Transaction costs: Size-tiered based on market cap of holdings.
- Equal weight: Up to 30 positions. Cash if fewer than 5 qualify.
- Benchmark: FTSE 100 total return (GBP).
Limitations
Eleven cash years reduce statistical power. The effective invested period is 13 years, not 24. That's a small sample. Recovery events like 2020 and 2016-2017 have outsized influence on the overall numbers.
Average of 17.4 stocks per period. The UK net-net universe is thin. At full investment, the portfolio rarely hit 30 stocks. Concentrated portfolios are noisier. Individual company outcomes matter more.
Currency exposure. Returns are in GBP. Sterling depreciated about 20% against the dollar over this period. For international investors, the GBP-denominated returns would look worse in USD terms.
FMP's UK coverage is weaker in early years. The 11 cash years may partly reflect missing data rather than a true absence of net-nets. This biases the backtest toward the post-2011 period. Notably, the cash position in 2008 avoided the -30.3% GFC crash.
The 41.67% win rate is decent. The strategy beat the FTSE in 10 of 24 years, or 7 of 13 invested years (54%). Against the local benchmark, UK net-nets were competitive, if not spectacular.
Takeaway
UK net-nets returned +0.77% annually from 2001 to 2024, trailing the FTSE's +1.81% by -1.04%. The academic premium that Xiao and Arnold documented for 1980-2005 (19.7% annual) doesn't appear in modern data. The strategy produces powerful recovery trades after UK-specific crises (+78% in 2020, +32% in 2016) but struggles to compound during normal markets.
Against the local FTSE benchmark, UK net-nets nearly broke even. Against global benchmarks, they severely underperformed. This is what premium erosion looks like. A strategy that worked when markets were less efficient stops working once enough capital targets it. The UK result suggests net-net investing in developed markets has passed its peak, though it can still work during severe UK-specific stress events.
Part of a Series
This is part of a multi-exchange NCAV net-net study:
References
- Graham, B. & Dodd, D. (1934). Security Analysis. McGraw-Hill.
- Oppenheimer, H. (1986). Ben Graham's Net Current Asset Values: A Performance Update. Financial Analysts Journal.
- Xiao, Y. & Arnold, G. (2008). Testing Benjamin Graham's Net Current Asset Value Strategy in London. Journal of Investing.
Data: FMP via Ceta Research warehouse, 2001-2024
Past performance does not guarantee future results. This is educational content, not investment advice.


