
Net Debt/EBITDA Screen: 22 Exchanges, 25 Years, One Signal
We ran the same Net Debt/EBITDA screen across 22 global exchanges over 25 years. With local benchmarks, 13 of 22 beat their home index. India: +6.50% vs Sensex. The exchange matters more than the signal.


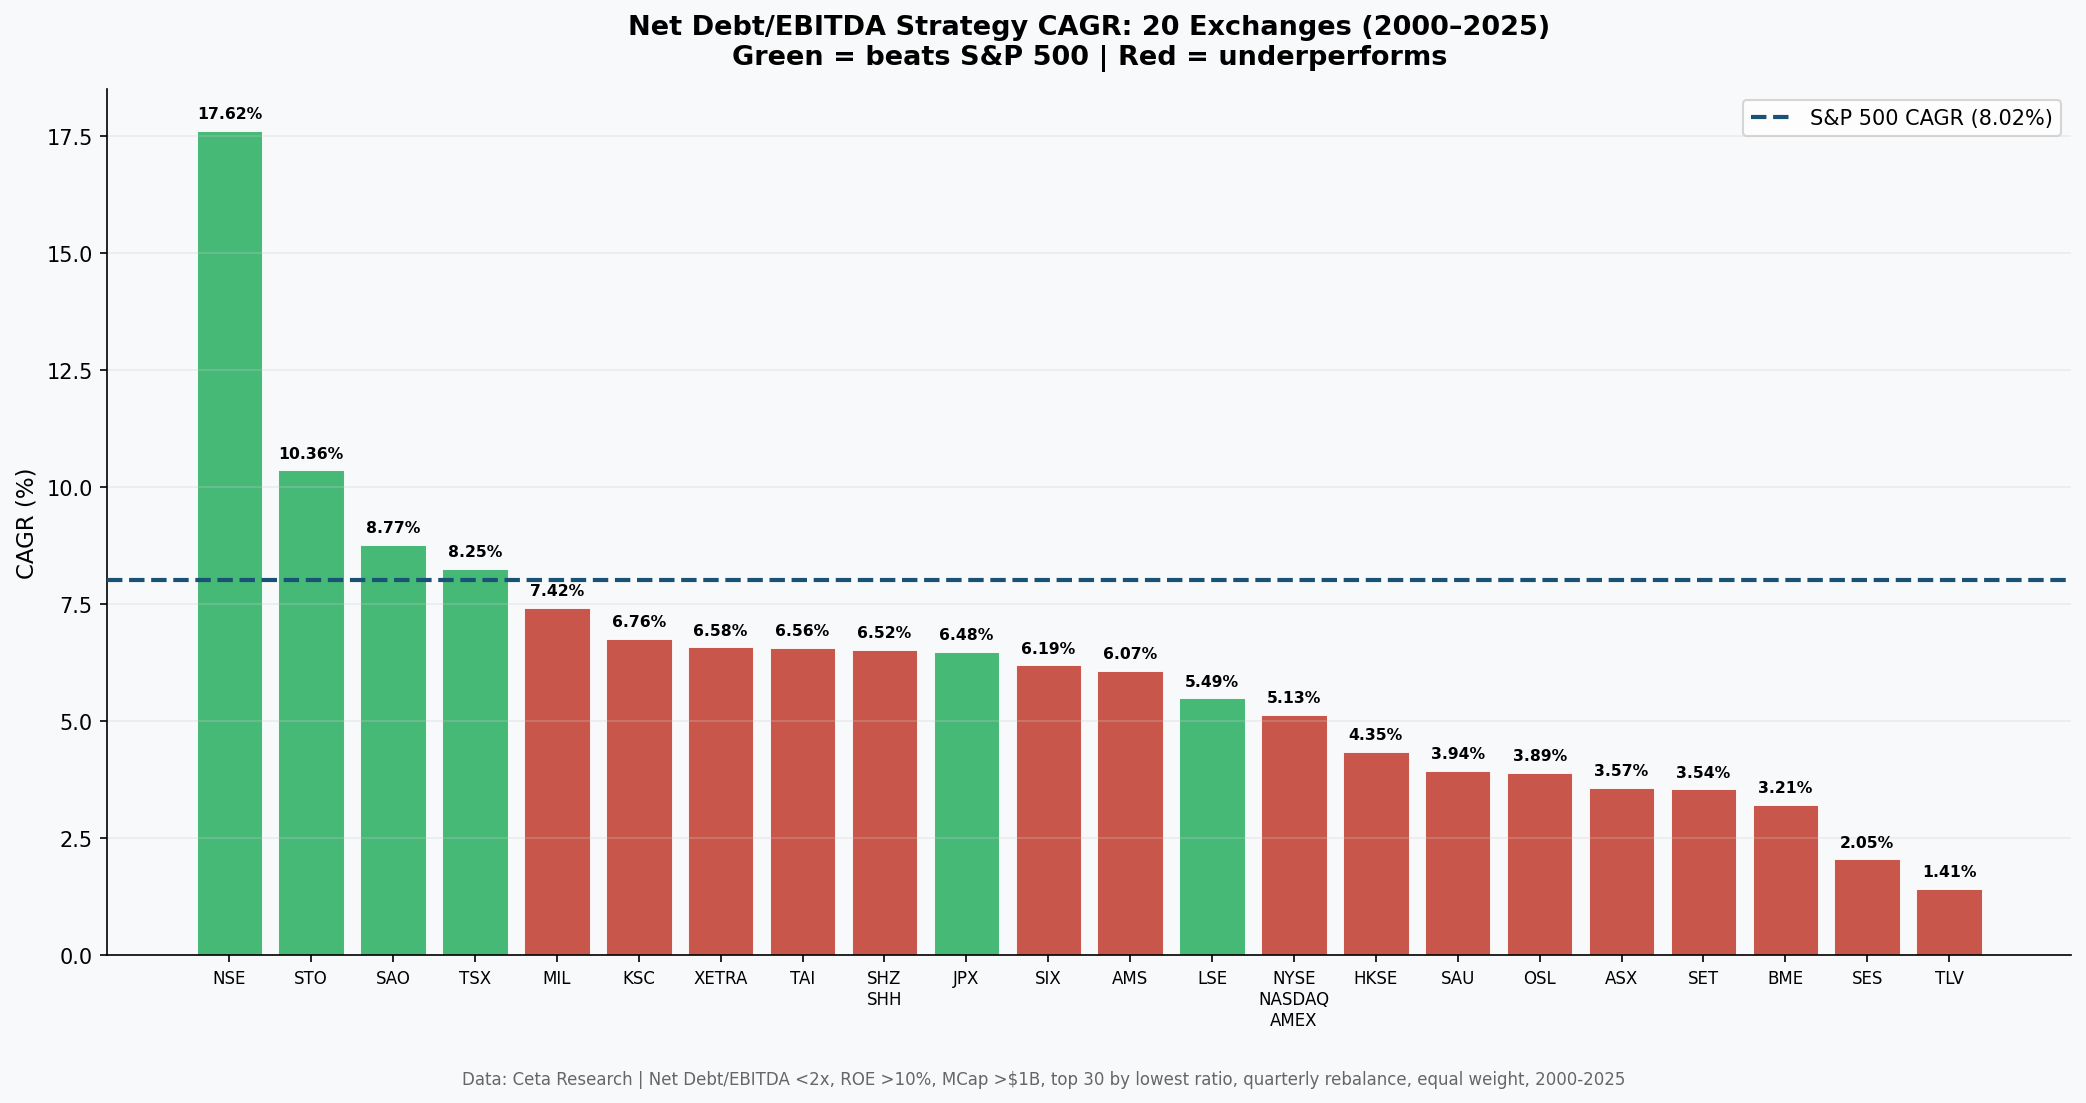
We ran the same Net Debt/EBITDA screen across 22 global exchanges, same signal, same parameters, same transaction cost model, from 2000 to 2025. The results range from 17.62% CAGR in India to 1.44% in Israel. The spread is large enough that the exchange you apply this signal to matters more than the signal parameters themselves.
Contents
- The Signal
- Full Results Table
- What We Found
- The Patterns That Explain the Variance
- Where This Works Best
- Methodology Notes
- Run It Yourself
- Limitations
A key finding: when measured against local benchmarks instead of SPY, the signal works in far more markets than it appears. Several exchanges that "underperformed SPY" actually beat their own local index by 2-5% annually.
Data: FMP financial data warehouse, 2000–2025. Updated March 2026.
The Signal
Net Debt/EBITDA < 2x and > -5x (excludes extreme net-cash anomalies), ROE > 10%, Market Cap > local-currency equivalent (~$200-500M USD per exchange). Top 30 stocks by lowest ratio, equal weight. Quarterly rebalance (January, April, July, October). 45-day filing lag for point-in-time data. Transaction costs: size-tiered model. Execution: market-on-close next trading day (MOC).
Net Debt = Total Debt minus Cash and Cash Equivalents. The ratio measures how many years of operating earnings (EBITDA) it would take to repay net debt. A value below 2x means the company could theoretically clear its debt in under two years, the threshold PE firms typically use to classify a company as conservatively leveraged.
Market cap thresholds are set per exchange in local currency (FMP stores marketCap in local currency, not USD). Examples: ₹20B (~$240M USD) for India, SEK 5B (~$460M USD) for Sweden, ₩500B (~$370M USD) for Korea. This ensures consistent filtering across exchanges.
Data: Ceta Research (FMP financial data warehouse).
Full Results Table
Where local benchmarks are available, excess is measured vs the local index. Where not available, excess is vs SPY. The "Benchmark" column shows which index was used.
| Exchange | Country | CAGR | Excess | Benchmark | Sharpe | MaxDD | Cash% | Avg Stocks |
|---|---|---|---|---|---|---|---|---|
| NSE | India | 17.62% | +6.50% | Sensex | 0.426 | -50.0% | 17% | 23.2 |
| STO | Sweden | 10.36% | +7.18% | OMX30 | 0.414 | -53.0% | 9% | 25.3 |
| SAO | Brazil | 10.16% | +1.21% | Bovespa | -0.014 | -62.4% | 13% | 19.6 |
| TSX | Canada | 7.91% | +2.83% | TSX Comp | 0.301 | -40.9% | 0% | 23.5 |
| MIL | Italy | 7.41% | -0.60% | SPY | 0.220 | -56.6% | 17% | 22.4 |
| SHZ+SHH | China | 7.35% | +3.16% | SSE Comp | 0.165 | -59.1% | 0% | 22.2 |
| XETRA | Germany | 7.18% | +2.06% | DAX | 0.230 | -66.4% | 0% | 18.8 |
| SIX | Switzerland | 6.81% | +4.70% | SMI | 0.330 | -48.2% | 0% | 19.1 |
| KSC | Korea | 6.79% | +1.98% | KOSPI | 0.246 | -48.5% | 22% | 25.3 |
| JPX | Japan | 6.48% | +3.08% | Nikkei 225 | 0.329 | -53.1% | 5% | 25.8 |
| TAI | Taiwan | 6.35% | +1.97% | TAIEX | 0.268 | -57.8% | 20% | 26.9 |
| LSE | UK | 5.49% | +4.13% | FTSE 100 | 0.088 | -50.0% | 0% | 12.1 |
| NYSE+NASDAQ+AMEX | US | 5.13% | -2.89% | SPY | 0.123 | -55.3% | 0% | 22.1 |
| AMS | Netherlands | 5.01% | -3.01% | SPY | 0.116 | -57.7% | 0% | 16.1 |
| HKSE | Hong Kong | 4.20% | +2.43% | Hang Seng | 0.042 | -60.2% | 0% | 20.0 |
| ASX | Australia | 4.00% | -0.21% | ASX 200 | 0.027 | -60.0% | 0% | 22.1 |
| SAU | Saudi Arabia | 3.99% | -4.03% | SPY | 0.027 | -50.8% | 28% | 23.3 |
| OSL | Norway | 3.98% | -4.04% | SPY | 0.056 | -60.7% | 28% | 15.1 |
| SET | Thailand | 3.89% | +0.14% | SET Index | 0.070 | -57.8% | 17% | 26.9 |
| BME | Spain | 3.12% | -4.89% | SPY | 0.007 | -57.2% | 20% | 18.2 |
| SES | Singapore | 1.95% | -0.22% | STI | -0.034 | -48.9% | 17% | 15.8 |
| TLV | Israel | 1.44% | -6.57% | SPY | -0.102 | -53.3% | 28% | 19.2 |
When measured against local benchmarks: 13 of 22 exchanges show positive excess. When all benchmarked against SPY: only 4 of 22 beat it. This distinction matters. SPY's dominance by mega-cap tech makes it an unfair comparison for non-US markets. A Korean stock screen beating KOSPI by 2% is a real signal. That same screen "underperforming SPY" was masking genuine alpha.
What We Found
The signal works in more markets than it appears, once you use the right benchmark.
The earlier version of this analysis benchmarked everything against SPY and excluded Japan and the UK. Using local-currency benchmarks where available and adding the two previously excluded exchanges, the picture shifts meaningfully:
- India remains the strongest result (+6.50% excess vs Sensex, 17.62% CAGR). The universe is NSE-only (removing ~38% duplicate BSE listings). Financial conservatism is genuinely rewarded in a market where credit risk is higher, defaults happen, and the gap between a leveraged and unleveraged balance sheet has historically been wide.
- Sweden (+7.18% vs OMX30) is the strongest developed-market result. The OMX Stockholm 30 performed poorly in USD terms over this period (3.17% CAGR due to SEK depreciation), making the absolute excess look large. The underlying signal is real: capital-efficient Swedish industrials outperformed their local index consistently.
- UK (+4.13% vs FTSE 100) and Switzerland (+4.70% vs SMI) both beat their local benchmarks strongly. The FTSE 100 and Swiss Market Index both performed poorly in USD terms, dragged down by banks, energy, and pharma. The low-leverage screen avoided the biggest structural problem sectors.
- China (+3.16% vs SSE Composite), Japan (+3.08% vs Nikkei), Canada (+2.83% vs TSX Composite), Hong Kong (+2.43% vs Hang Seng), Germany (+2.06% vs DAX), Korea (+1.98% vs KOSPI), and Taiwan (+1.97% vs TAIEX) all show meaningful positive excess against local benchmarks.
- Brazil (+1.21% vs Bovespa) beats its local benchmark but has a negative Sharpe ratio when adjusted for Brazil's 10.5% risk-free rate.
- Thailand (+0.14% vs SET Index), Australia (-0.21% vs ASX 200), and Singapore (-0.22% vs STI) are essentially flat against local benchmarks.
The exchanges that truly underperform: Israel (-6.57%), Spain (-4.89%), Norway (-4.04%), Saudi Arabia (-4.03%), the Netherlands (-3.01%), and Italy (-0.60%) all fall short of their benchmarks (or SPY where no local data is available).
The Patterns That Explain the Variance
Pattern 1: Local benchmark vs SPY changes the story
The biggest insight from this update: most of the apparent underperformance in earlier analysis came from comparing local equity markets to SPY, which is increasingly a bet on US mega-cap tech. Germany's 7.18% CAGR "underperformed SPY" but beat the DAX by 2.06% annually. That's genuine alpha in the German equity market. The same applies to Korea, Taiwan, Hong Kong, and China.
Pattern 2: Emerging markets amplify the signal
India (+6.50% vs Sensex, NSE-only) clearly outperforms. The credit-quality premium is larger in markets where leverage genuinely matters. India has had sustained periods of high credit risk, currency stress, and corporate governance pressure that directly punish leveraged companies. The signal captures that genuine differential.
Pattern 3: High cash periods structurally limit results
Israel (28% cash periods), Saudi Arabia (28%), Norway (28%), Korea (22%), Taiwan (20%), and Spain (20%) all have elevated cash periods, quarters where fewer than 10 stocks qualified and the portfolio sat in cash. Cash periods hurt both returns and statistical confidence.
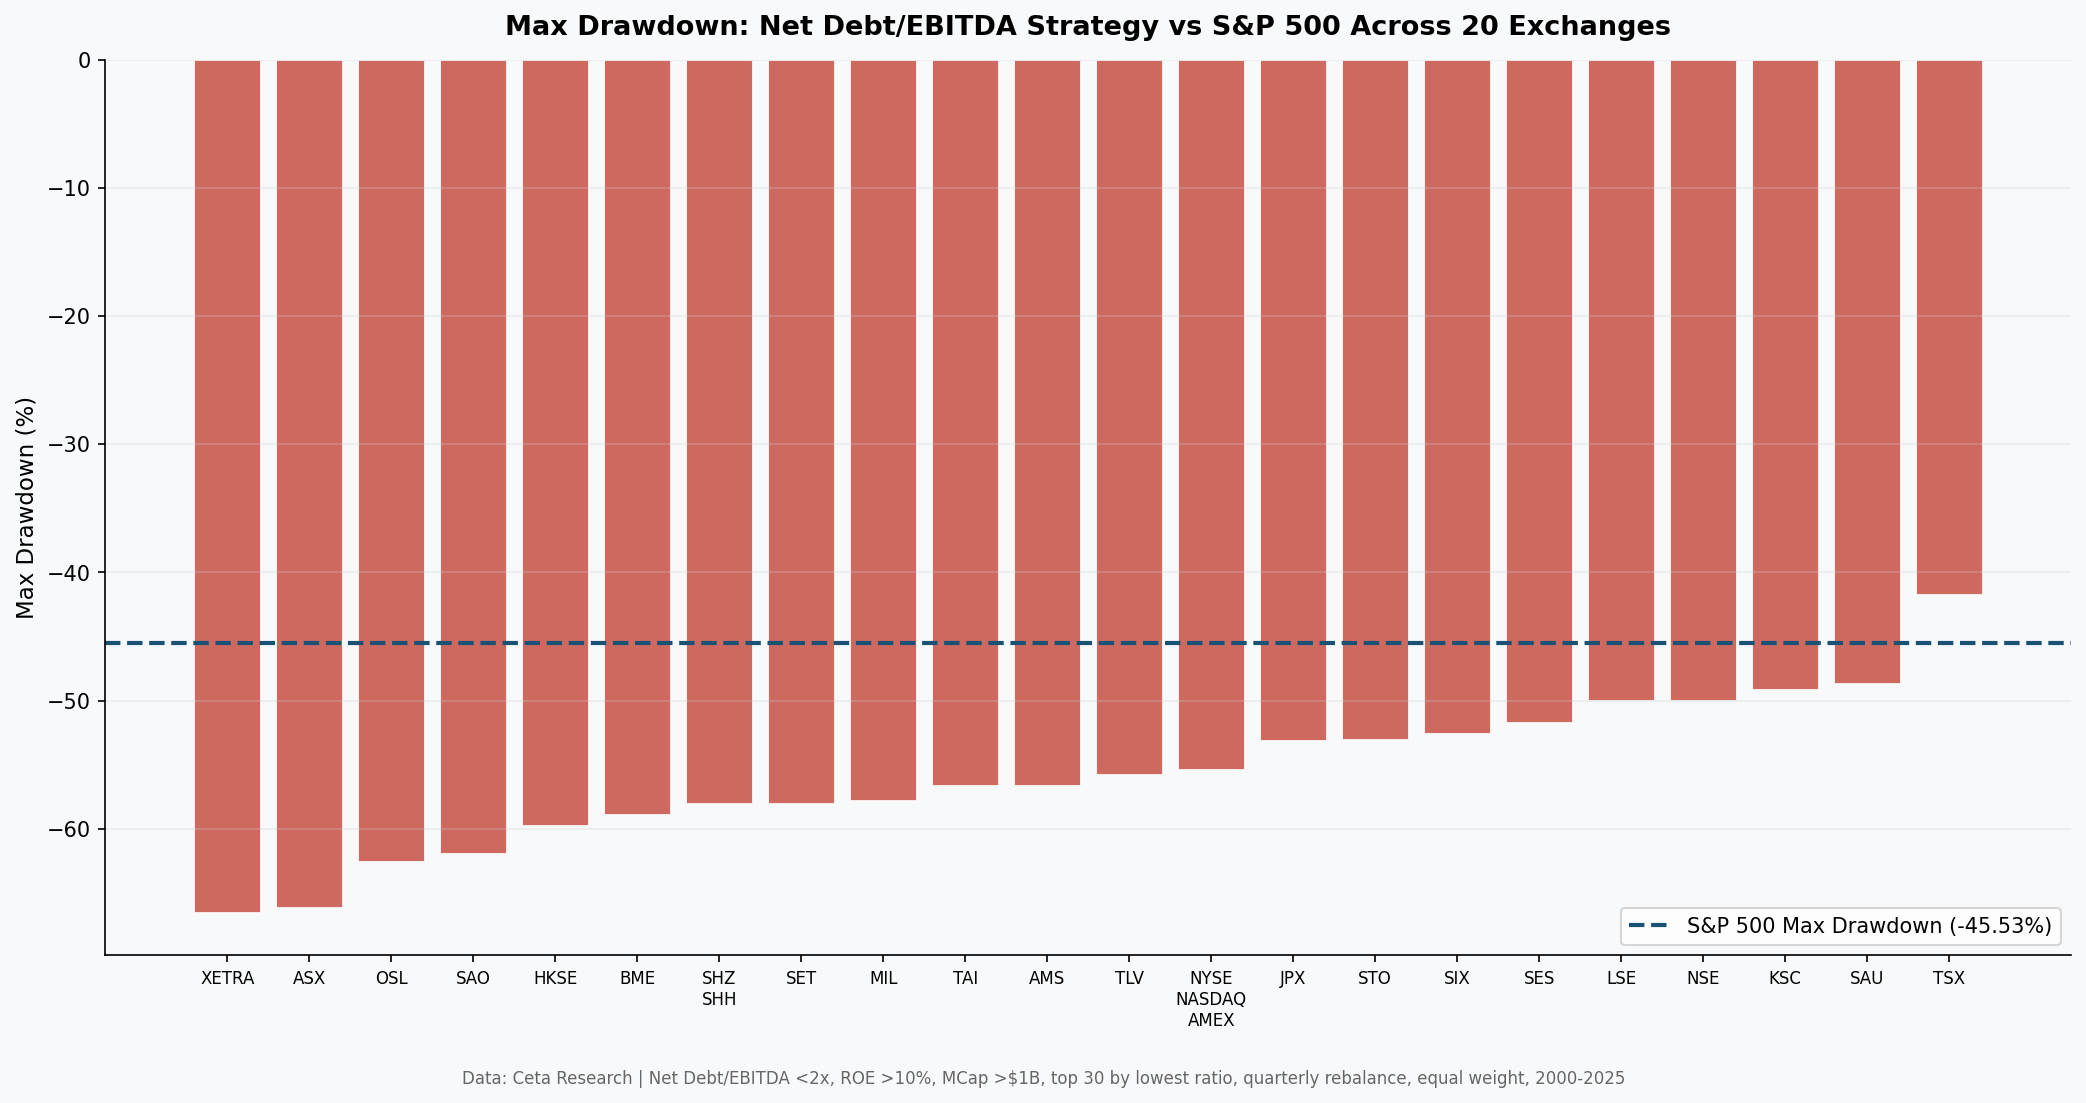
Pattern 4: Canada has the best drawdown profile
Canada (TSX) beats its local benchmark by +2.83% with the best max drawdown of any positive-excess exchange (-40.9%). Canada's equity market has a mix of financials, energy, and diversified industrials where Net Debt/EBITDA filtering selects genuine quality. Zero cash periods across 25 years.
Where This Works Best
If you're using this screen, the evidence points toward:
- India, strongest absolute result and good risk-adjusted (+6.50% vs Sensex, Sharpe 0.426)
- Switzerland (+4.70% vs SMI) and UK (+4.13% vs FTSE 100), strong developed-market results
- Sweden, best developed-market Sharpe (0.414), +7.18% vs OMX30
- China (+3.16% vs SSE Composite) and Japan (+3.08% vs Nikkei), strong Asian results
- Canada, best drawdown among outperformers (-40.9%), +2.83% vs TSX Composite
If you're applying it in the US, Netherlands, or Israel, the data suggests underperformance against both SPY and (where measurable) local benchmarks. The US result (-2.89% vs SPY) reflects the mega-cap tech concentration problem that affects all non-momentum fundamental screens.
Methodology Notes
All 22 exchanges use identical signal parameters (same ratio thresholds, same portfolio construction, same transaction cost model, same filing lag). Market cap thresholds differ by exchange and are set to target liquid mid-to-large cap stocks (~$200-500M USD equivalent). Risk-free rates are region-specific (used for Sharpe/Sortino ratio calculations). All backtests use next-day close execution (MOC model) to avoid same-bar entry bias.
Run It Yourself
Run the screen on India (best result):
SELECT
    k.symbol,
    p.companyName,
    p.exchange,
    ROUND(k.netDebtToEBITDATTM, 2)      AS net_debt_ebitda,
    ROUND(k.returnOnEquityTTM * 100, 1) AS roe_pct,
    ROUND(k.marketCap / 1e9, 1)         AS mktcap_bn
FROM key_metrics_ttm k
JOIN profile p ON k.symbol = p.symbol
WHERE k.netDebtToEBITDATTM < 2.0
  AND k.netDebtToEBITDATTM > -5.0
  AND k.returnOnEquityTTM > 0.10
  AND k.marketCap > 20000000000  -- ₹20B (~$240M USD)
  AND p.exchange = 'NSE'
ORDER BY k.netDebtToEBITDATTM ASC
LIMIT 30
Run this query on Ceta Research
Run the full multi-exchange backtest:
cd backtests
python3 net-debt-ebitda/backtest.py --global --output results/exchange_comparison.json --verbose
Per-exchange:
python3 net-debt-ebitda/backtest.py --preset india --verbose
python3 net-debt-ebitda/backtest.py --preset sweden --verbose
python3 net-debt-ebitda/backtest.py --preset us --verbose
Limitations
FX effects. Comparing local equity returns across 22 countries in USD introduces currency noise. Some of the India excess return is rupee-era tailwind. Some of the Israel and Australia underperformance includes FX headwinds.
Cash period bias. Exchanges with frequent cash periods (Israel, Saudi Arabia, Norway) have shorter effective history. Comparing their CAGR directly to a fully-invested exchange (US, India) is misleading.
Single-factor screen. This test isolates one signal in isolation. Real portfolios combine multiple signals. Net Debt/EBITDA below 2x combined with additional quality or momentum filters would produce different results.
Survivorship. FMP data includes delisted stocks, which reduces survivorship bias. However, coverage quality varies by exchange and by time period.
Local benchmarks are not available for all exchanges. Italy, Netherlands, Norway (Oslo All Share data starts 2013 only), Spain, Saudi Arabia, and Israel are still benchmarked against SPY. Norway's Oslo All Share has data only from 2013, so a full-period comparison isn't possible. Switzerland, Sweden, and Thailand now use local benchmarks (SMI, OMX30, SET Index).
Related posts: US flagship | India | Sweden
Data: Ceta Research (FMP financial data warehouse), 2000-2025. Universe: 22 global exchanges, market cap thresholds set per exchange in local currency. Quarterly rebalance, equal weight, top 30 by lowest Net Debt/EBITDA. Point-in-time data with 45-day filing lag. Transaction costs: size-tiered model. Local benchmarks used where available; SPY used for Italy, Netherlands, Saudi Arabia, Norway, Spain, and Israel. Full methodology: backtests/METHODOLOGY.md. Backtest code: backtests/net-debt-ebitda/. Past performance does not guarantee future results. This is educational content, not investment advice.


