
Owner Earnings Yield on Hong Kong Stocks: 5.2% CAGR With Zero Cash Periods
We screened HKSE stocks for high Owner Earnings yield from 2000 to 2025. The strategy returned 5.24% annually vs 1.64% for the Hang Seng Index, with zero cash periods across all 25 years. 60% win rate, 58.5% down capture.

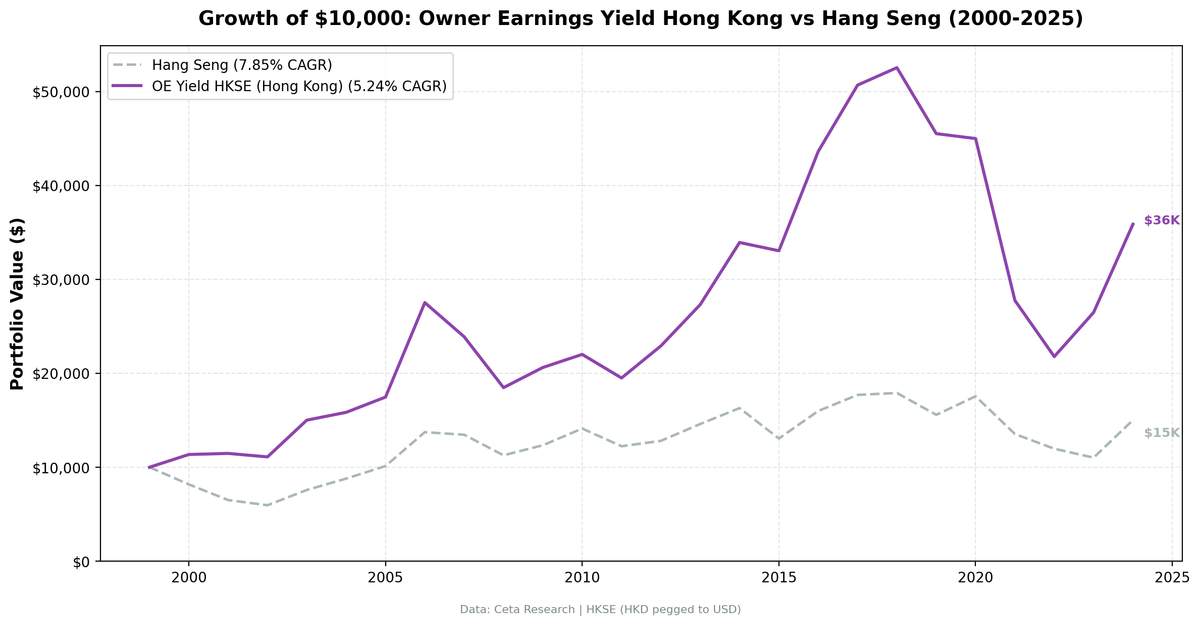
Owner Earnings Yield returned 5.24% annually on HKSE-listed stocks from 2000 to 2025. That's +3.6% excess CAGR over the Hang Seng Index, which managed only 1.64% annually over the same period. Zero cash periods across all 25 years. The screen always found at least 20 qualifying stocks. Hong Kong is one of the few markets where this strategy was fully invested every single rebalance, but the absolute return is modest because the local index itself returned almost nothing.
Contents
- Method
- The Screen (SQL)
- What We Found
- 25 years of data. +3.6% annual excess over the Hang Seng.
- Year-by-Year Returns
- Key Observations
- Zero cash periods. Always fully invested.
- 2000-2006: The golden stretch
- The HKD-USD peg: Clean currency, clean benchmark
- 2021-2022: The structural break
- Pre-2018 vs post-2018
- 2023: A recovery year
- 2024: Index-led rally
- Backtest Methodology
- Limitations
- Takeaway
- Part of a Series
- Run This Screen Yourself
Data: FMP financial data warehouse, 2000–2025. Updated May 2026.
Method
Signal: OE Yield 5-50%, ROE > 10%, Operating Margin > 10%, Market Cap > HK$2B (~$256M USD) Portfolio: Top 30 by OE Yield, equal weight. Annual rebalance (July). Cash rule: Hold cash if fewer than 10 stocks qualify. Period: 2000-2025 (25 annual periods) Benchmark: Hang Seng Index (^HSI) Execution: Next-day close (market-on-close after signal date) Data quality: Skip any stock with entry price < $1 or single-period return > 200% (penny-stock and split-artifact filter)
Owner Earnings = Net Income + D&A - min(|Capex|, D&A). The min() function proxies maintenance capex. For full methodology and the rationale behind this metric, see the US flagship post.
The Screen (SQL)
WITH income_latest AS (
    SELECT symbol, netIncome, depreciationAndAmortization,
        ROW_NUMBER() OVER (PARTITION BY symbol ORDER BY date DESC) AS rn
    FROM income_statement
    WHERE period = 'FY'
      AND netIncome IS NOT NULL
      AND depreciationAndAmortization IS NOT NULL
),
cashflow_latest AS (
    SELECT symbol, capitalExpenditure,
        ROW_NUMBER() OVER (PARTITION BY symbol ORDER BY date DESC) AS rn
    FROM cash_flow_statement
    WHERE period = 'FY'
      AND capitalExpenditure IS NOT NULL
),
calculated AS (
    SELECT
        i.symbol,
        i.netIncome + i.depreciationAndAmortization
            - LEAST(ABS(c.capitalExpenditure), i.depreciationAndAmortization)
            AS owner_earnings
    FROM income_latest i
    JOIN cashflow_latest c ON i.symbol = c.symbol AND c.rn = 1
    WHERE i.rn = 1
)
SELECT
    calc.symbol,
    p.companyName,
    ROUND(calc.owner_earnings / p.marketCap * 100, 2) AS oe_yield_pct,
    ROUND(k.freeCashFlowYieldTTM * 100, 2) AS fcf_yield_pct,
    ROUND(k.returnOnEquityTTM * 100, 1) AS roe_pct,
    ROUND(f.operatingProfitMarginTTM * 100, 1) AS op_margin_pct,
    ROUND(p.marketCap / 1e9, 1) AS market_cap_billions
FROM calculated calc
JOIN key_metrics_ttm k ON calc.symbol = k.symbol
JOIN financial_ratios_ttm f ON calc.symbol = f.symbol
JOIN profile p ON calc.symbol = p.symbol
WHERE calc.owner_earnings > 0
  AND calc.owner_earnings / p.marketCap > 0.05
  AND calc.owner_earnings / p.marketCap < 0.50
  AND k.returnOnEquityTTM > 0.10
  AND f.operatingProfitMarginTTM > 0.10
  AND p.marketCap > 2e9
  AND p.exchange = 'HKSE'
  AND p.isFund = false
  AND p.isEtf = false
  AND p.isActivelyTrading = true
QUALIFY ROW_NUMBER() OVER (PARTITION BY p.companyName
                           ORDER BY p.averageVolume DESC) = 1
ORDER BY calc.owner_earnings / p.marketCap DESC
LIMIT 30
Run this query on Ceta Research
What We Found
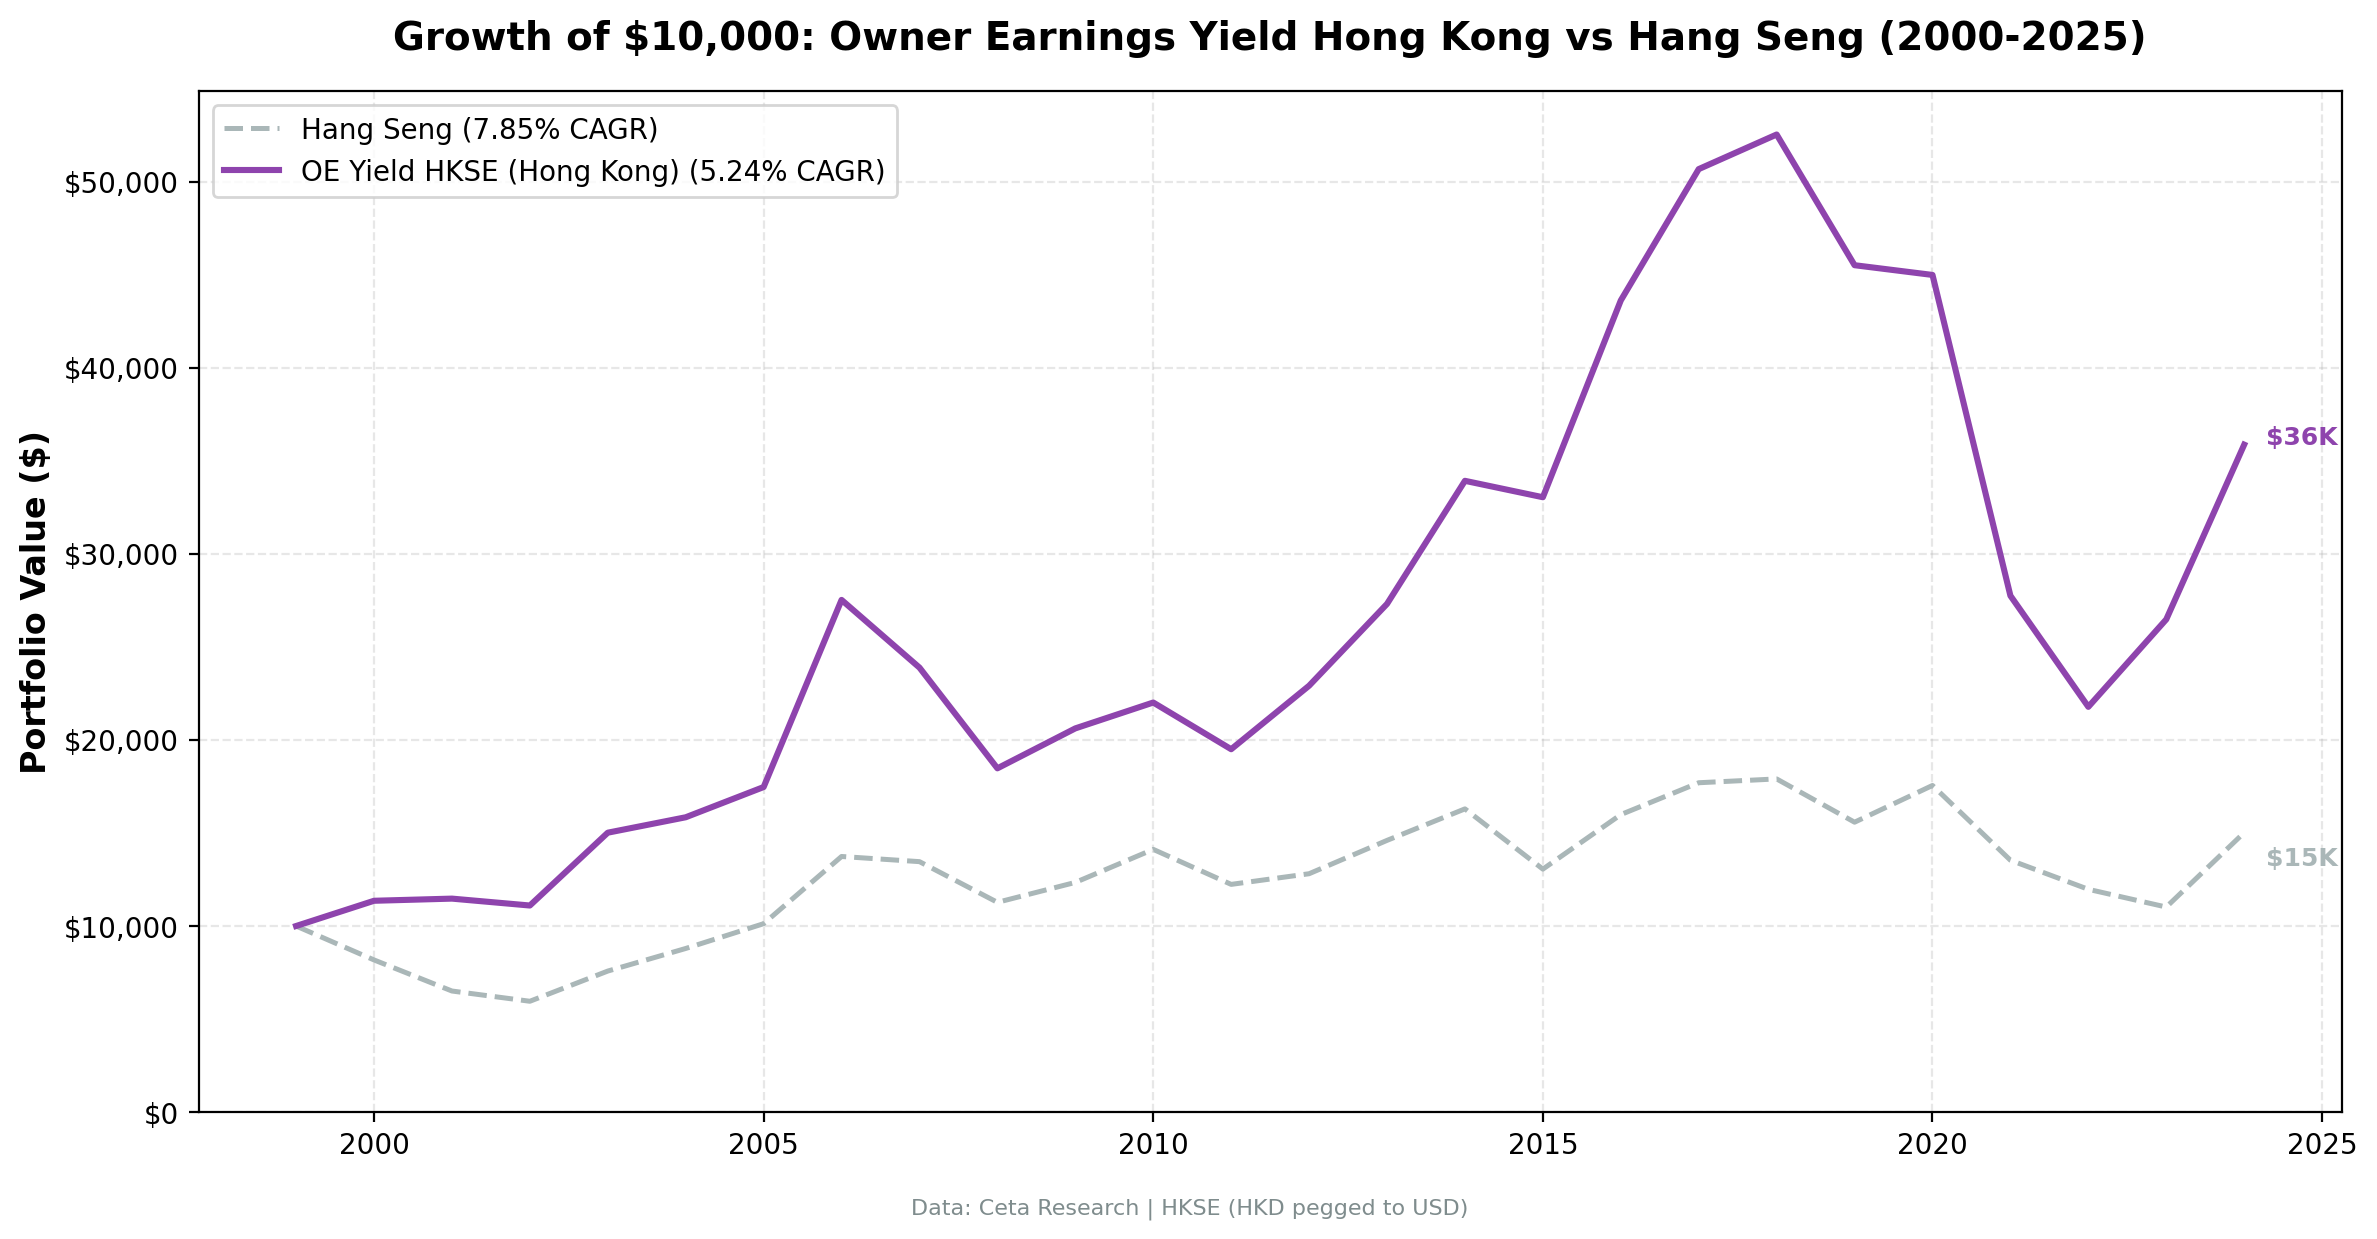
25 years of data. +3.6% annual excess over the Hang Seng.
| Metric | OE Yield (HKSE) | Hang Seng |
|---|---|---|
| CAGR | 5.24% | 1.64% |
| Total Return | 259% | 50% |
| Max Drawdown | -58.55% | -40.45% |
| Sharpe Ratio | 0.105 | -0.077 |
| Sortino Ratio | 0.182 | -0.114 |
| Win Rate (annual) | 60% | - |
| Alpha | 3.53% | - |
| Beta | 0.950 | - |
| Up Capture | 118.3% | - |
| Down Capture | 58.5% | - |
| Avg Stocks per Period | 21.3 | - |
| Cash Periods | 0 of 25 | - |
The Hang Seng returned just 1.64% annually over 25 years. OE Yield returned 5.24%. The strategy never sat in cash. Every single year, at least 20 stocks passed the screen. Hong Kong's deep market of profitable businesses keeps the pipeline full.
Up capture of 118.3% means the portfolio captured almost 20% more than the benchmark's gains in rising years. Down capture of 58.5% means it absorbed roughly 60% of the losses. That mild asymmetry, compounded over 25 years, produced +3.6% annual excess.
One caveat: the absolute Sharpe ratio (0.105) is low. Hong Kong is a volatile market and OE Yield doesn't escape that. But compared to the Hang Seng's Sharpe of -0.077, the strategy is in a different league. The local index spent 25 years going almost nowhere.
Year-by-Year Returns
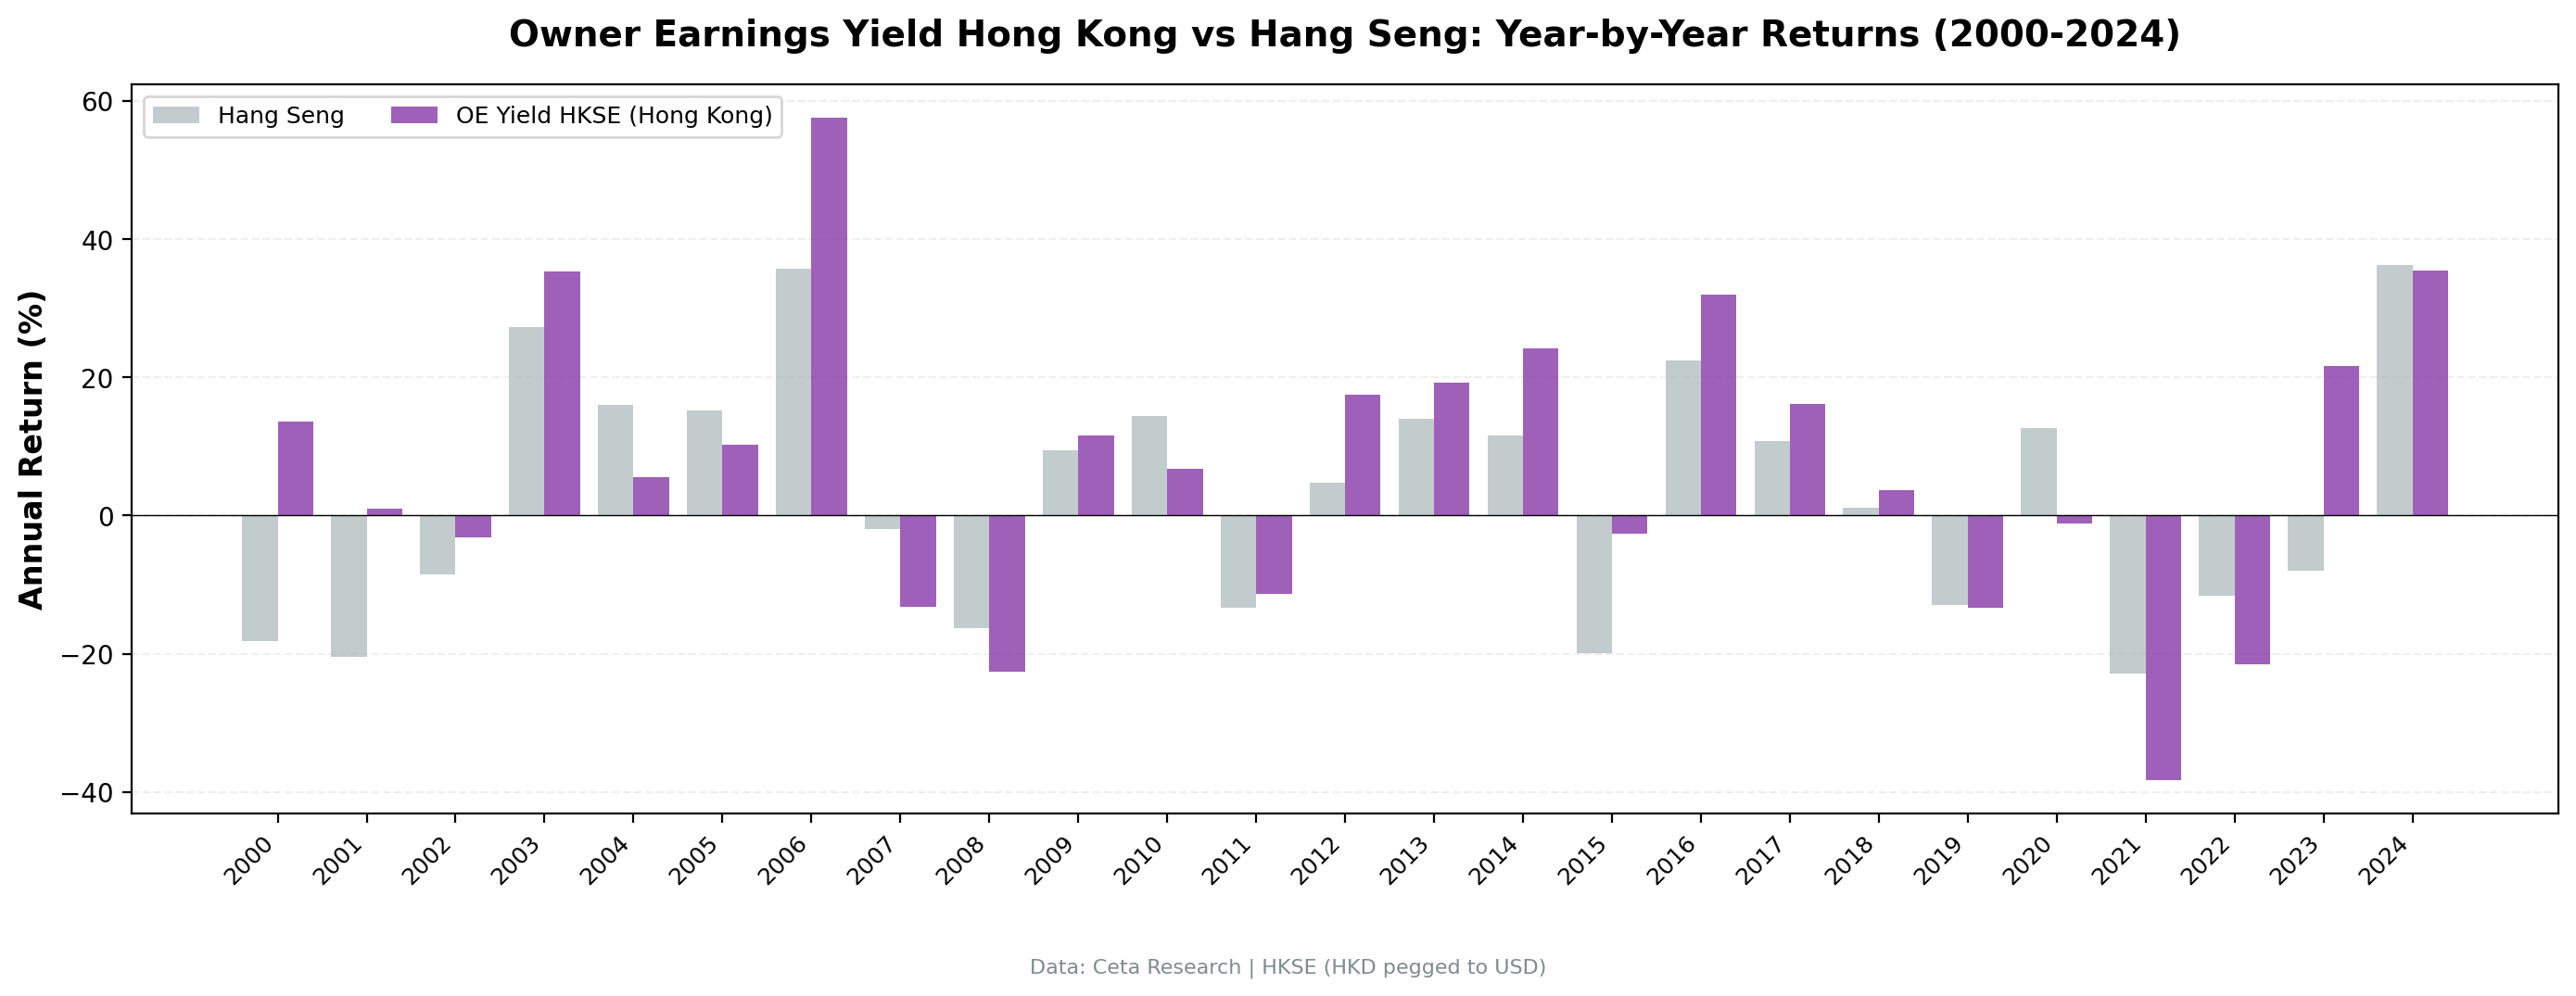
| Year | OE Yield (HKSE) | Hang Seng | Excess |
|---|---|---|---|
| 2000 | +13.6% | -18.2% | +31.8% |
| 2001 | +1.0% | -20.4% | +21.4% |
| 2002 | -3.2% | -8.5% | +5.2% |
| 2003 | +35.3% | +27.3% | +8.0% |
| 2004 | +5.5% | +16.0% | -10.5% |
| 2005 | +10.2% | +15.2% | -4.9% |
| 2006 | +57.6% | +35.7% | +21.9% |
| 2007 | -13.2% | -2.0% | -11.2% |
| 2008 | -22.7% | -16.2% | -6.4% |
| 2009 | +11.6% | +9.5% | +2.1% |
| 2010 | +6.7% | +14.4% | -7.7% |
| 2011 | -11.4% | -13.3% | +1.9% |
| 2012 | +17.5% | +4.7% | +12.8% |
| 2013 | +19.2% | +14.0% | +5.2% |
| 2014 | +24.2% | +11.6% | +12.6% |
| 2015 | -2.6% | -19.9% | +17.3% |
| 2016 | +32.0% | +22.4% | +9.6% |
| 2017 | +16.2% | +10.7% | +5.5% |
| 2018 | +3.7% | +1.2% | +2.5% |
| 2019 | -13.4% | -13.0% | -0.4% |
| 2020 | -1.1% | +12.7% | -13.8% |
| 2021 | -38.3% | -22.9% | -15.4% |
| 2022 | -21.5% | -11.6% | -10.0% |
| 2023 | +21.6% | -8.0% | +29.6% |
| 2024 | +35.5% | +36.3% | -0.8% |
Key Observations
Zero cash periods. Always fully invested.
The screen found 20+ qualifying stocks in every single rebalance across 25 years. Hong Kong's exchange is packed with profitable, modestly-valued businesses. Property developers, industrial conglomerates, consumer companies, shipping firms. Many of them carry low debt relative to earnings and generate strong owner earnings. The pipeline never ran dry.
This matters because cash periods are a hidden performance drag. In India, the strategy sat in cash for four years. In Hong Kong, OE Yield was putting money to work from day one.
2000-2006: The golden stretch
| Year | OE Yield | Hang Seng | Excess |
|---|---|---|---|
| 2000 | +13.6% | -18.2% | +31.8% |
| 2001 | +1.0% | -20.4% | +21.4% |
| 2003 | +35.3% | +27.3% | +8.0% |
| 2006 | +57.6% | +35.7% | +21.9% |
The strategy held up well during the dot-com bust and rallied through the mid-2000s. 2006 was the best single year at +57.6%, riding China's pre-Olympic investment boom. Capital flooded into Hong Kong as the gateway to mainland China's rapid industrialization. Owner Earnings Yield picked up the cheapest beneficiaries of that flow.
The HKD-USD peg: Clean currency, clean benchmark
Hong Kong pegs its dollar to the US dollar within a narrow band (7.75-7.85 HKD per USD). That peg has held since 1983. Unlike our India or China blogs, there's no currency mismatch to worry about. The strategy's real alpha is measured against the local Hang Seng, which returned just 1.64% CAGR over 25 years. The peg also means these returns translate directly into USD for international investors.
2021-2022: The structural break
| Year | OE Yield | Hang Seng | Excess |
|---|---|---|---|
| 2021 | -38.3% | -22.9% | -15.4% |
| 2022 | -21.5% | -11.6% | -10.0% |
The worst two-year stretch in the backtest. The portfolio lost roughly 51% peak-to-trough across both years. Three forces converged. China's regulatory crackdown on tech and property companies tanked Hong Kong-listed stocks. Political uncertainty after the 2020 National Security Law reduced foreign investor confidence. And capital rotated out of the region entirely.
The strategy underperformed the Hang Seng in both years by wide margins. This wasn't just a market-level issue. The OE Yield screen overweighted the sectors hit hardest by regulation and property deleveraging.
Pre-2018 vs post-2018
Splitting the record at 2018 shows the strategy's edge was concentrated in the first half. Through 2017, OE Yield compounded at roughly 11% CAGR while the Hang Seng managed about 4%, a 7-point lead. From 2018-2024, both struggled: OE Yield averaged near zero while the Hang Seng was negative in 4 of 7 years. The 25-year CAGR of 5.24% blends a strong first half with a flat recent stretch. The +3.6% annual excess over the Hang Seng held up because the index itself was so poor.
2023: A recovery year
After the 2021-2022 drawdown, 2023 returned +21.6% while the Hang Seng was still negative at -8.0%. The +29.6 point excess was one of the strategy's three best years in the backtest. Profitable, cash-generative businesses recovered first when Chinese policy began shifting toward stimulus.
2024: Index-led rally
The most recent year returned +35.5%, but the Hang Seng actually edged it out at +36.3%. Chinese policy shifted toward economic stimulus in late 2023, and Hong Kong stocks rallied broadly. The strategy kept pace but didn't lead, suggesting the rally was market-wide rather than value-driven.
Backtest Methodology
| Parameter | Choice |
|---|---|
| Universe | HKSE, Market Cap > HK$2B (~$256M USD) |
| Signal | OE Yield 5-50%, ROE > 10%, OPM > 10% |
| Portfolio | Top 30 by OE Yield, equal weight |
| Rebalancing | Annual (July) |
| Execution | Next-day close (market-on-close after signal date) |
| Cash rule | Hold cash if < 10 qualify |
| Benchmark | Hang Seng Index (^HSI) |
| Period | 2000-2025 (25 annual periods) |
| Data | Point-in-time (45-day lag for FY filings) |
| Transaction costs | Size-tiered (0.1-0.5% one-way by market cap) |
| Data quality | Skip entries < $1 or single-period returns > 200% |
Full methodology details: backtests/METHODOLOGY.md
Limitations
Deep drawdowns. Max drawdown was -58.55% vs -38.4% for the US version. Hong Kong equities are more volatile than US equities during global sell-offs and China-specific events. The 2021-2022 drawdown was driven by political and regulatory risk that no financial screen can filter out.
Post-2018 structural weakness. The strategy underperformed the Hang Seng in 2021 and 2022 by wide margins. Capital outflows from Hong Kong, China regulatory risk, and property deleveraging created extended headwinds. The 25-year record is positive, but the recent stretch includes the worst consecutive losses in the backtest.
Survivorship bias. Exchange membership uses current company profiles. Delisted companies, companies that moved their primary listing away from HKSE, and bankruptcies aren't fully captured in the historical universe.
Concentrated portfolio. 21.3 stocks on average, but all drawn from a single exchange heavily influenced by mainland China policy. Stock-specific and geographic concentration risk is higher than the US version.
Annual rebalancing only. We test July-to-July periods using the most recent FY filing. Quarterly rebalancing with TTM data might produce different results, particularly given Hong Kong's volatile market structure.
Takeaway
OE Yield works on Hong Kong stocks, but the absolute return is modest. 5.24% CAGR over 25 years, +3.6% excess over the Hang Seng, with zero cash periods. The screen always found enough qualifying companies.
The asymmetry is mild: 118% up capture, 58.5% down capture. The portfolio captures slightly more of the benchmark's gains and absorbs about 60% of its losses. That pattern held for 25 years despite vastly different market regimes. The 60% win rate confirms it: the strategy beat the Hang Seng in 15 of 25 years.
The cost is clear. The 2021-2022 drawdown was brutal, and the strategy couldn't avoid it. OE Yield doesn't protect against regime-level risks like regulatory crackdowns or political instability. It selects cheap, profitable businesses. When the entire market reprices downward, cheap profitable businesses go down too, sometimes faster than the index.
The broader context matters: the Hang Seng returned just 1.64% CAGR over 25 years. Hong Kong's index has been one of the worst-performing major markets in the world. OE Yield's 5.24% CAGR shows that stock selection can add to a poor market environment, though it can't overcome it entirely. For investors who believe Hong Kong will remain a viable financial center, the screen still beats the local index by a wide margin even after the worst recent stretch.
Part of a Series
This analysis is part of our Owner Earnings Yield global exchange comparison. We tested the same screen on 14 exchanges worldwide: - OE Yield on US Stocks (NYSE + NASDAQ + AMEX) - 9.22% CAGR, +1.4% vs S&P 500 - OE Yield on Indian Stocks (NSE) - 15.5% CAGR, +3.4% vs Sensex - OE Yield on UK Stocks (LSE) - 8.7% CAGR, +7.5% vs FTSE 100 - OE Yield on Swedish Stocks (STO) - 9.5% CAGR, +7.0% vs OMX Stockholm 30 - OE Yield on Chinese Stocks (SHZ + SHH) - 6.8% CAGR, +4.3% vs SSE Composite - OE Yield: 14-Exchange Global Comparison - full comparison table
Run This Screen Yourself
All metrics used in this analysis (Owner Earnings, ROE, operating margin, market cap) are queryable via SQL on Ceta Research. Filter by exchange (HKSE) and see what passes today.
The full backtest code (Python + DuckDB) is available in our GitHub repository.
Data: Ceta Research, FMP financial data warehouse. Universe: HKSE. Benchmark: Hang Seng Index. Annual rebalance (July), equal weight top 30, 2000-2025. Next-day close execution. Transaction costs included.
Past performance does not guarantee future results. This is educational content, not investment advice.

