
Owner Earnings Yield: Buffett's Metric Backtested on 25 Years of US Stock Data
We screened for stocks with high Owner Earnings yield across all US exchanges from 2000 to 2025. The strategy returned 9.22% annually vs 7.85% for the S&P 500 with a down capture ratio of 42.1%.


We screened for stocks with high Owner Earnings yield, strong profitability, and reasonable size across all US exchanges from 2000 to 2025. The strategy returned 9.22% annually vs 7.85% for the S&P 500. Zero cash periods, 21 stocks per rebalance on average, and a down capture ratio of 42.1%. The portfolio kept pace with the market in rallies and absorbed less than half its losses. After all transaction costs and tightened data-quality filters, the excess CAGR works out to +1.37%.
Contents
- Method
- What is Owner Earnings?
- The Signal
- The Screen (SQL)
- What We Found
- 25 years of data. 1.37% annual alpha over the S&P 500.
- Year-by-year returns
- The early 2000s: OE Yield's golden era
- The 2019 anomaly
- Where OE Yield struggles: post-2017 growth dominance
- Backtest Methodology
- Limitations
- Takeaway
- Part of a Series
- References
- Run This Screen Yourself
Data: FMP financial data warehouse, 2000–2025. Updated May 2026.
Method
Data source: Ceta Research (FMP financial data warehouse) Universe: All US exchanges (NYSE, NASDAQ, AMEX), market cap > $1B USD Period: 2000-2025 (25 years, 25 annual periods) Rebalancing: Annual (July, after FY filings + 45-day lag), equal weight top 30 Benchmark: S&P 500 Total Return (SPY) Execution: Next-day close (market-on-close after signal date) Cash rule: Hold cash if fewer than 10 stocks qualify Transaction costs: Size-tiered model (0.1-0.5% one-way based on market cap) Data quality: Skip any stock with entry price < $1 or single-period return > 200% (penny-stock and split-artifact filter)
Owner Earnings computed from raw financial statements at each rebalance: Net Income + D&A - min(|Capex|, D&A). The min() function proxies maintenance capex. If a company spends less on capex than its depreciation, all capex is maintenance. If it spends more, the excess is treated as growth investment and excluded.
What is Owner Earnings?
Warren Buffett introduced Owner Earnings in his 1986 Berkshire Hathaway letter. He wanted a metric that answers one question: what does this business actually earn for its owners?
Owner Earnings = Net Income + D&A - Maintenance Capex
Standard free cash flow deducts all capital expenditure. Every dollar spent building a new factory gets the same treatment as a dollar replacing a broken machine. Owner Earnings only deducts the maintenance portion. It doesn't penalize companies for investing in growth.
Consider two companies with identical operations generating $500M in net income:
- Company A spends $200M on maintenance. Owner Earnings: $300M. FCF: $300M. Same.
- Company B spends $200M on maintenance and $400M building new capacity. Owner Earnings: $300M. FCF: -$100M. Dramatically different.
FCF makes Company B look like a money-losing operation. Owner Earnings shows both businesses have identical earning power from existing operations.
OE Yield = Owner Earnings / Market Cap
Higher yield means you're paying less per dollar of owner earnings. We screen for the cheapest stocks on this metric.
The Signal
| Filter | Threshold | Rationale |
|---|---|---|
| OE Yield | > 5% | Less than 20x owner earnings |
| OE Yield | < 50% | Removes data artifacts |
| ROE | > 10% | Solid returns on shareholder equity |
| Operating Margin | > 10% | Genuine pricing power |
| Market Cap | > $1B USD | Liquidity filter |
Top 30 by highest OE yield, equal weight. Annual rebalance in July (after FY filings become available, with a 45-day lag to prevent look-ahead bias).
The signal is deliberately simple. Four quality/value filters plus a size gate. Unlike our FCF Yield strategy, there's no interest coverage filter. This means more stocks qualify, particularly industrial and consumer companies that carry moderate debt but generate strong owner earnings.
The Screen (SQL)
WITH income_latest AS (
    SELECT symbol, netIncome, depreciationAndAmortization,
        ROW_NUMBER() OVER (PARTITION BY symbol ORDER BY date DESC) AS rn
    FROM income_statement
    WHERE period = 'FY'
      AND netIncome IS NOT NULL
      AND depreciationAndAmortization IS NOT NULL
),
cashflow_latest AS (
    SELECT symbol, capitalExpenditure,
        ROW_NUMBER() OVER (PARTITION BY symbol ORDER BY date DESC) AS rn
    FROM cash_flow_statement
    WHERE period = 'FY'
      AND capitalExpenditure IS NOT NULL
),
calculated AS (
    SELECT
        i.symbol,
        i.netIncome + i.depreciationAndAmortization
            - LEAST(ABS(c.capitalExpenditure), i.depreciationAndAmortization)
            AS owner_earnings
    FROM income_latest i
    JOIN cashflow_latest c ON i.symbol = c.symbol AND c.rn = 1
    WHERE i.rn = 1
)
SELECT
    calc.symbol,
    p.companyName,
    ROUND(calc.owner_earnings / k.marketCap * 100, 2) AS oe_yield_pct,
    ROUND(k.freeCashFlowYieldTTM * 100, 2) AS fcf_yield_pct,
    ROUND(k.returnOnEquityTTM * 100, 1) AS roe_pct,
    ROUND(f.operatingProfitMarginTTM * 100, 1) AS op_margin_pct,
    ROUND(k.marketCap / 1e9, 1) AS market_cap_billions
FROM calculated calc
JOIN key_metrics_ttm k ON calc.symbol = k.symbol
JOIN financial_ratios_ttm f ON calc.symbol = f.symbol
JOIN profile p ON calc.symbol = p.symbol
WHERE calc.owner_earnings > 0
  AND calc.owner_earnings / k.marketCap > 0.05
  AND calc.owner_earnings / k.marketCap < 0.50
  AND k.returnOnEquityTTM > 0.10
  AND f.operatingProfitMarginTTM > 0.10
  AND k.marketCap > 1e9
  AND p.exchange IN ('NYSE', 'NASDAQ', 'AMEX')
ORDER BY calc.owner_earnings / k.marketCap DESC
LIMIT 30
Run this query on Ceta Research
What We Found
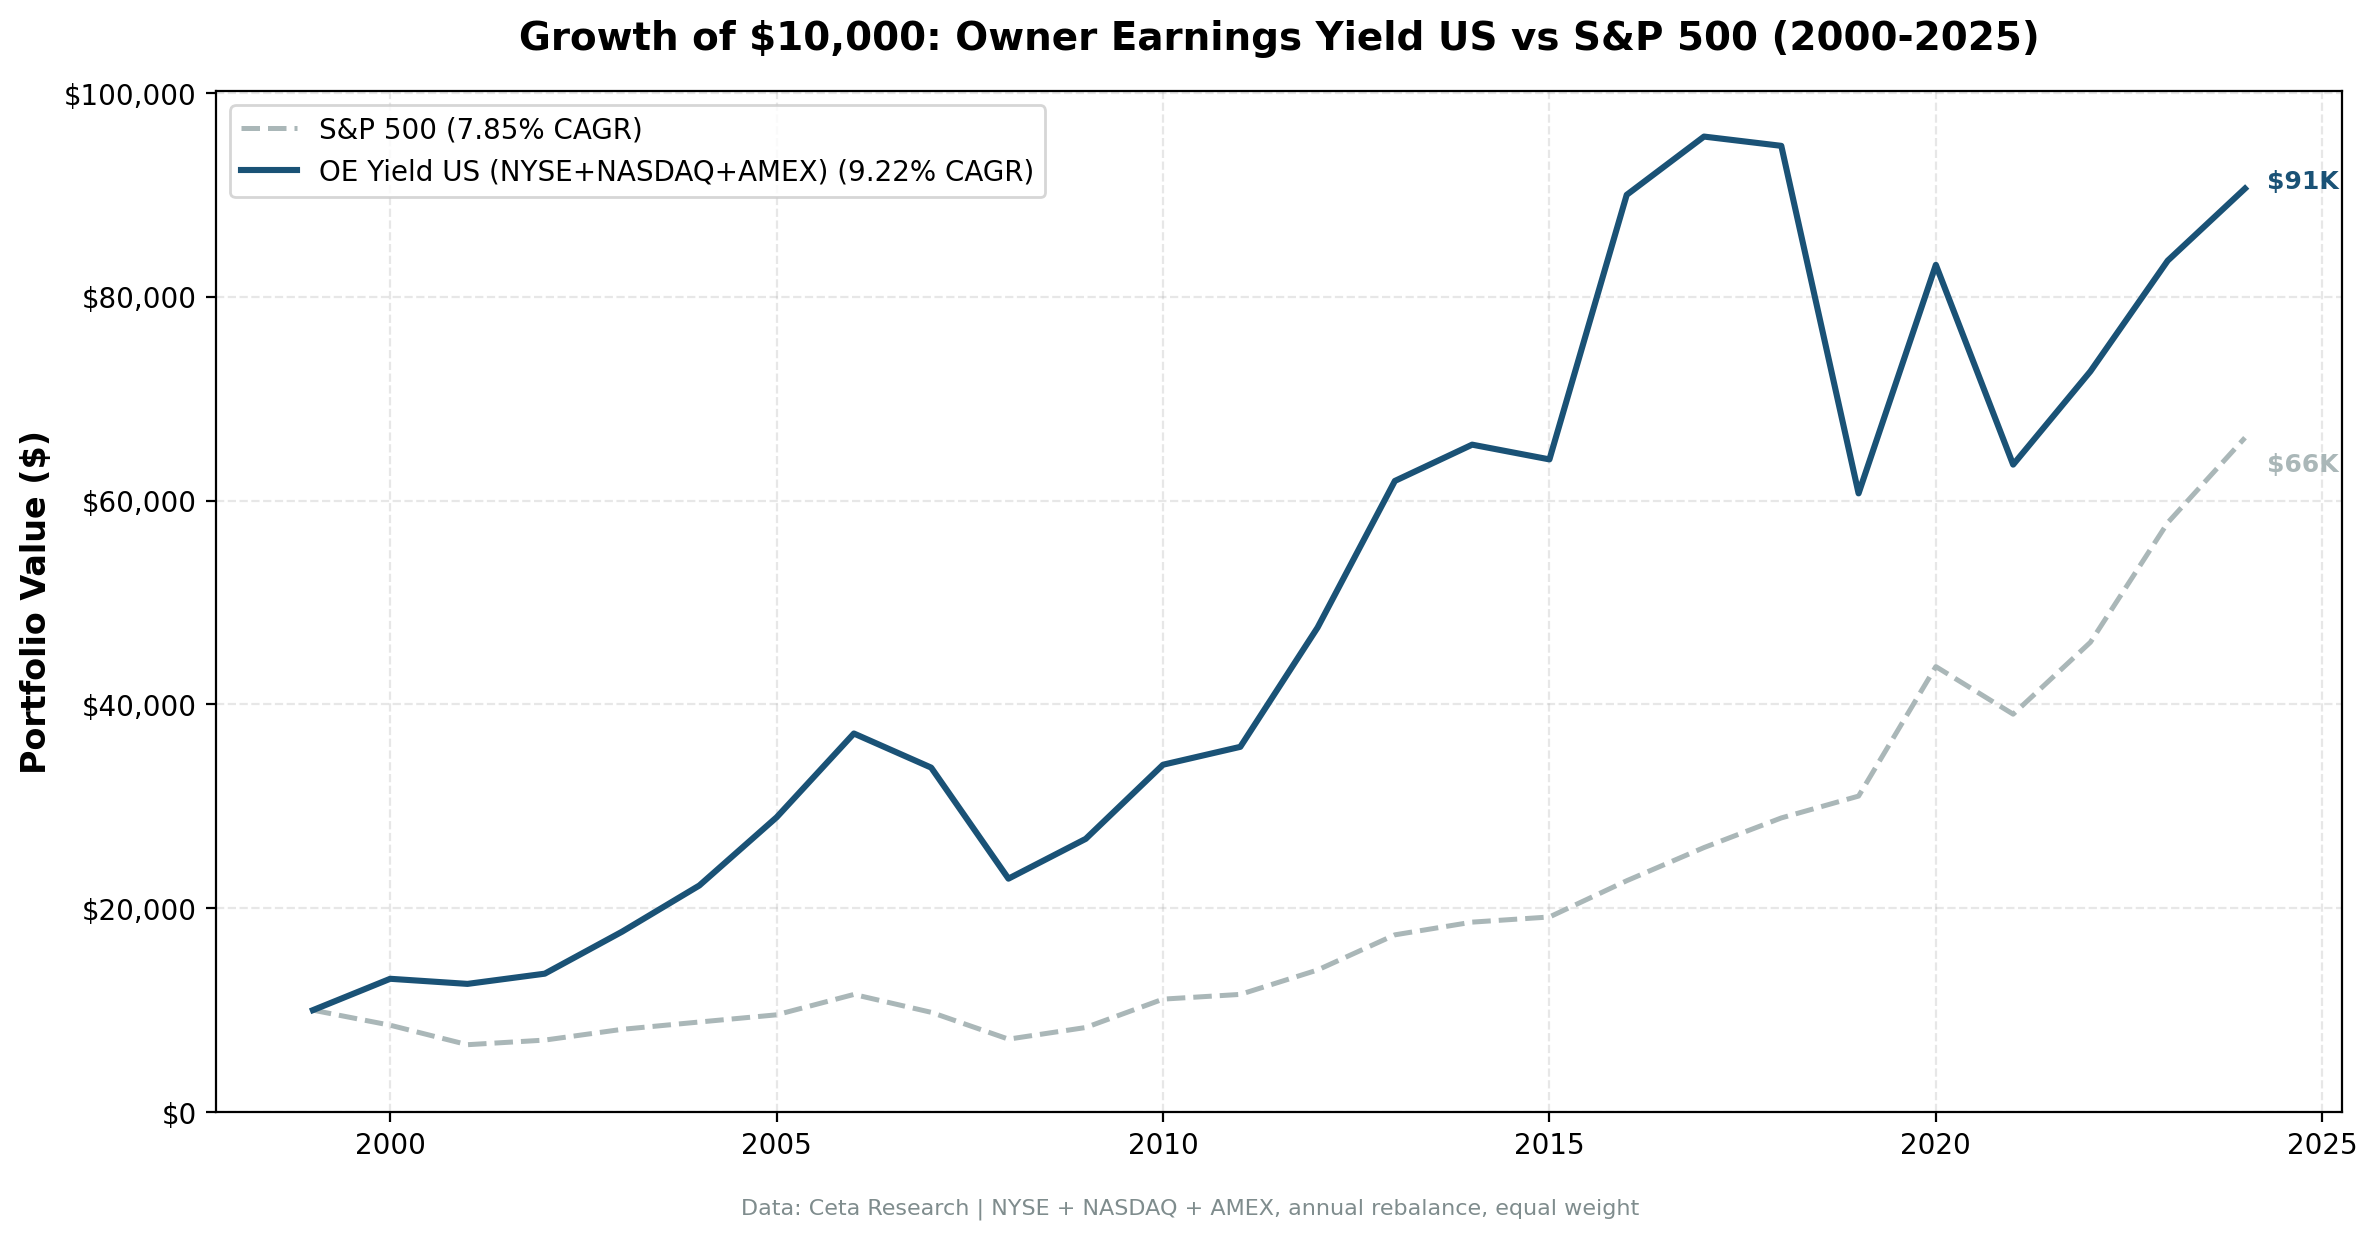
25 years of data. 1.37% annual alpha over the S&P 500.
| Metric | OE Yield (US) | S&P 500 |
|---|---|---|
| CAGR | 9.22% | 7.85% |
| Total Return | 806% | 562% |
| Volatility | 21.1% | 16.6% |
| Max Drawdown | -38.4% | -38.0% |
| Sharpe Ratio | 0.342 | 0.352 |
| Sortino Ratio | 0.614 | 0.628 |
| Win Rate (annual) | 52% | - |
| Avg Stocks per Period | 21.3 | - |
| Cash Periods | 0 of 25 | - |
OE Yield turned $10,000 into $90,640. The S&P 500 turned it into $66,170. The strategy was fully invested every single period.
Down capture was 42.1%, up capture 101.2%. The portfolio matched the market's upside and absorbed less than half its losses. The combination, near-full participation in rallies with cushioned drawdowns, drives the 1.37% excess CAGR. After applying tighter data-quality filters that catch penny-stock artifacts and broken adjusted prices, the strategy's edge over SPY is smaller than older versions of this backtest suggested, but it remains positive across 25 years.
Year-by-year returns
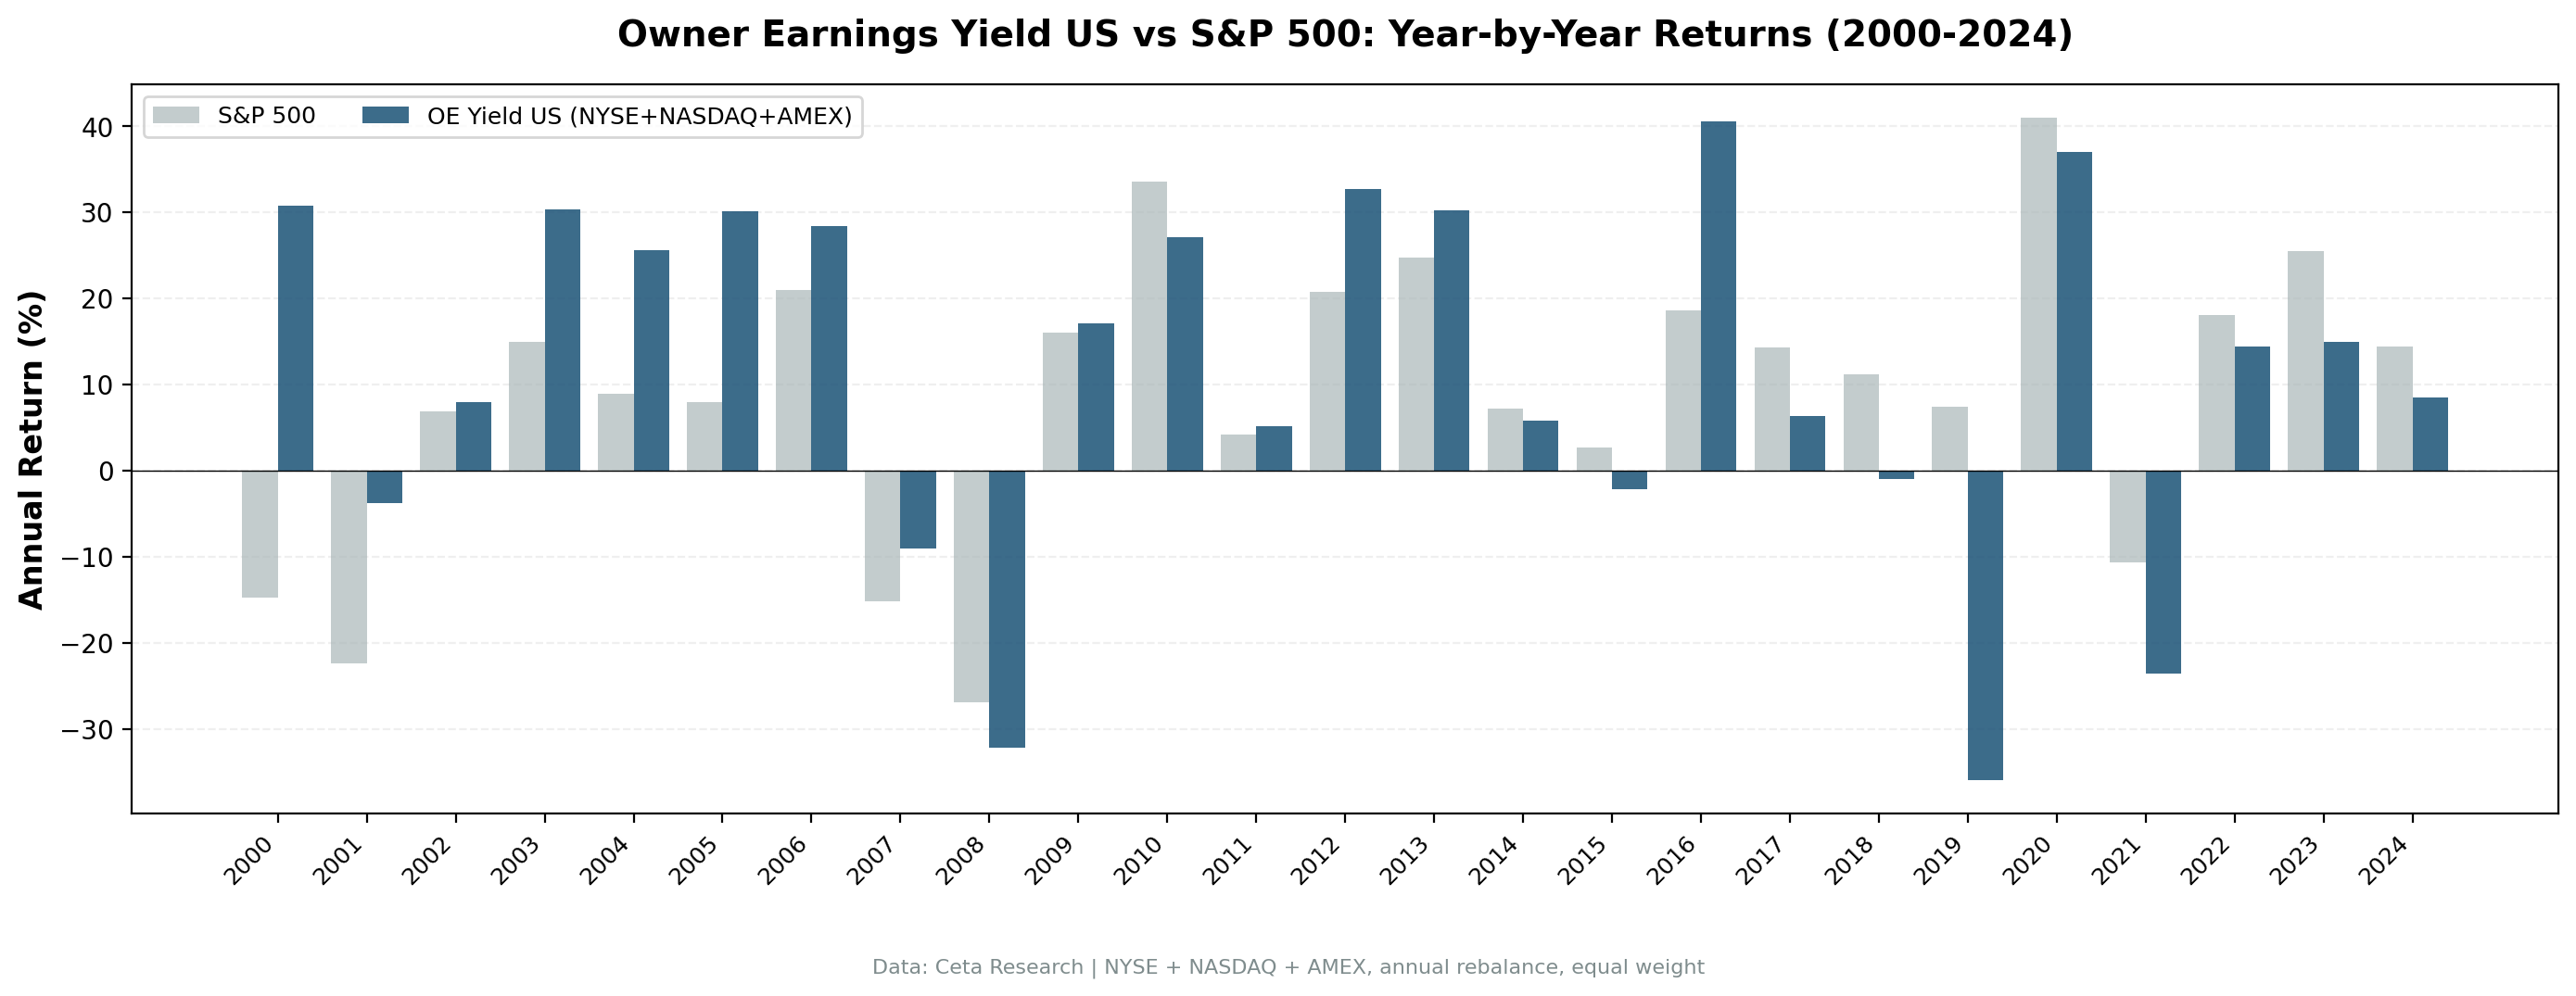
| Year | OE Yield | S&P 500 | Excess |
|---|---|---|---|
| 2000 | +30.8% | -14.8% | +45.6% |
| 2001 | -3.8% | -22.4% | +18.6% |
| 2002 | +8.0% | +6.9% | +1.1% |
| 2003 | +30.3% | +14.9% | +15.4% |
| 2004 | +25.6% | +8.9% | +16.8% |
| 2005 | +30.1% | +8.0% | +22.1% |
| 2006 | +28.4% | +20.9% | +7.5% |
| 2007 | -9.0% | -15.2% | +6.2% |
| 2008 | -32.2% | -26.9% | -5.3% |
| 2009 | +17.1% | +16.0% | +1.1% |
| 2010 | +27.1% | +33.5% | -6.4% |
| 2011 | +5.2% | +4.2% | +1.0% |
| 2012 | +32.7% | +20.7% | +11.9% |
| 2013 | +30.2% | +24.7% | +5.5% |
| 2014 | +5.8% | +7.2% | -1.4% |
| 2015 | -2.2% | +2.7% | -4.9% |
| 2016 | +40.5% | +18.6% | +22.0% |
| 2017 | +6.4% | +14.3% | -8.0% |
| 2018 | -0.9% | +11.2% | -12.1% |
| 2019 | -36.0% | +7.4% | -43.4% |
| 2020 | +36.9% | +41.0% | -4.0% |
| 2021 | -23.6% | -10.7% | -12.9% |
| 2022 | +14.4% | +18.1% | -3.7% |
| 2023 | +14.9% | +25.4% | -10.5% |
| 2024 | +8.5% | +14.4% | -5.9% |
The early 2000s: OE Yield's golden era
| Year | OE Yield | S&P 500 | Excess |
|---|---|---|---|
| 2000 | +30.8% | -14.8% | +45.6% |
| 2001 | -3.8% | -22.4% | +18.6% |
| 2002 | +8.0% | +6.9% | +1.1% |
| Cumulative | +37.7% | -29.3% | +67.0% |
While the market cratered during the dot-com bust, OE Yield gained 38% over three years. The screen naturally avoids overvalued growth stocks. Companies trading at less than 20x owner earnings with 10%+ ROE and margins aren't dot-com highfliers. They're profitable, established businesses that happened to be cheap.
2003-2006 continued the run. The portfolio gained 30.3%, 25.6%, 30.1%, and 28.4% in four consecutive years. Value stocks dominated this era, and OE Yield was positioned perfectly.
The 2019 anomaly
The worst year was 2019: -36.0% while SPY gained 7.4%. That's a 43-point gap, the strategy's widest annual underperformance. This July 2019 to July 2020 period covers the start of the COVID crash. Small-cap value stocks were hit hard in late February and March 2020.
The bounce never fully came. The 2020 period (July 2020 to July 2021) returned +36.9%, the strategy's third-best year, but slightly below SPY's +41.0%. The stocks that were beaten down in the crash recovered, but not violently enough to close the gap. Over the two periods combined, OE Yield returned -12.4% vs SPY's +25.9%. The strategy gave up nearly four decades of accumulated outperformance over those two years.
Where OE Yield struggles: post-2017 growth dominance
From 2017 to 2024, OE Yield underperformed SPY in 7 of 8 years. Total return over those 8 years: OE Yield +9%, SPY +132%. The gap is growth-driven. Mega-cap tech companies with high P/E ratios and massive growth capex don't pass the OE Yield screen. NVIDIA, Microsoft, and Apple all fail multiple filters during their biggest runs.
This is the tradeoff. You get 1.37% annual alpha over 25 years, but you have to sit through extended periods of underperformance when growth leads the market. Most of the strategy's lifetime excess return was earned by 2016. Anyone joining in 2017 would have lagged the index.
Backtest Methodology
| Parameter | Choice |
|---|---|
| Universe | NYSE + NASDAQ + AMEX, Market Cap > $1B USD |
| Signal | OE Yield 5-50%, ROE > 10%, OPM > 10% |
| Portfolio | Top 30 by OE Yield, equal weight |
| Rebalancing | Annual (July) |
| Cash rule | Hold cash if < 10 qualify |
| Benchmark | S&P 500 Total Return (SPY) |
| Execution | Next-day close (market-on-close) |
| Period | 2000-2025 (25 annual periods) |
| Data | Point-in-time (45-day lag for FY filings) |
| Transaction costs | Size-tiered (0.1-0.5% one-way by market cap) |
| Data quality | Skip entries < $1 or single-period returns > 200% |
Full methodology details: backtests/METHODOLOGY.md
Limitations
Annual rebalancing only. We test July-to-July periods using the most recent FY filing. Quarterly or monthly rebalancing with TTM data might produce different results. We chose annual to match the data source (FY filings) and reduce turnover.
Maintenance capex is estimated. We use min(|Capex|, D&A) as a proxy. Companies with recently purchased assets have high depreciation but may need little maintenance. Companies that defer maintenance look artificially profitable. The proxy is standard in the literature but imperfect.
Recent underperformance. OE Yield trailed SPY from 2017-2024 in 7 of 8 years. Growth-dominated markets are the strategy's blind spot. Factor strategies are cyclical, and this one requires patience through multi-year stretches of relative weakness.
Most of the alpha was earned early. The cumulative excess return through 2016 was +85 percentage points. From 2017-2024 the strategy lost +63 points of that lead. The 1.37% lifetime CAGR alpha understates how concentrated the win was in the first half of the sample.
Survivorship bias. Exchange membership uses current company profiles. Delisted companies, M&A targets, and bankruptcies aren't fully captured in the historical universe.
Concentrated portfolio. 21 stocks on average. Higher concentration means more stock-specific risk than a broad index.
Benchmark currency mismatch. Returns and benchmark are both in USD for US exchanges. No adjustment needed. For regional blogs, currency differences apply.
Takeaway
OE Yield works on US stocks, but the edge is thinner than older runs of this backtest implied. 9.22% CAGR over 25 years, 1.37% alpha above the S&P 500, zero cash periods. Once tightened data-quality filters catch penny-stock and split-artifact noise, the strategy's lifetime excess return drops by about three percentage points relative to earlier estimates. It's still positive and consistent in the first half of the sample, but anyone investing only in the most recent eight years would have lagged the index by a wide margin.
The strategy's edge is asymmetric but less extreme than older numbers suggested. 101.2% up capture, 42.1% down capture. It keeps pace with rallies and absorbs less than half the losses. That asymmetry drives the long-term alpha.
The cost is clear: multi-year stretches of underperformance during growth-led markets. 2017-2024 was a brutal eight-year stretch. The next growth cycle will produce another dry spell. OE Yield rewards investors who can hold through those periods and entered before the alpha was already earned. The 25-year record shows the math works if you give it time, but the math is more modest than the screen's first run suggested.
Part of a Series
This analysis is part of our Owner Earnings Yield global exchange comparison. We tested the same screen on 14 exchanges worldwide: - OE Yield on Indian Stocks (NSE) - 15.5% CAGR, +3.4% vs Sensex - OE Yield on UK Stocks (LSE) - 8.7% CAGR, +7.5% vs FTSE 100 - OE Yield on Hong Kong Stocks (HKSE) - 5.2% CAGR, +3.6% vs Hang Seng - OE Yield on Swedish Stocks (STO) - 9.5% CAGR, +7.0% vs OMX Stockholm 30 - OE Yield on Chinese Stocks (SHZ + SHH) - 6.8% CAGR, +4.3% vs SSE Composite - OE Yield: 14-Exchange Global Comparison - full comparison table
References
- Buffett, W. (1986). "Berkshire Hathaway Annual Letter to Shareholders."
- Greenwald, B., Kahn, J., Sonkin, P. & van Biema, M. (2001). Value Investing: From Graham to Buffett and Beyond. John Wiley & Sons.
- Greenblatt, J. (2006). The Little Book That Beats the Market. John Wiley & Sons.
Run This Screen Yourself
Via web UI: Run the Owner Earnings Yield screen on Ceta Research. The query is pre-loaded. Hit "Run" and see what passes today.
Via Python:
import requests, time

API_KEY = "your_api_key"  # get one at cetaresearch.com
BASE = "https://tradingstudio.finance/api/v1"

resp = requests.post(f"{BASE}/data-explorer/execute", headers={
    "X-API-Key": API_KEY, "Content-Type": "application/json"
}, json={
    "query": """
        WITH income_latest AS (
            SELECT symbol, netIncome, depreciationAndAmortization,
                ROW_NUMBER() OVER (PARTITION BY symbol ORDER BY date DESC) AS rn
            FROM income_statement WHERE period = 'FY'
              AND netIncome IS NOT NULL AND depreciationAndAmortization IS NOT NULL
        ),
        cashflow_latest AS (
            SELECT symbol, capitalExpenditure,
                ROW_NUMBER() OVER (PARTITION BY symbol ORDER BY date DESC) AS rn
            FROM cash_flow_statement WHERE period = 'FY' AND capitalExpenditure IS NOT NULL
        ),
        calculated AS (
            SELECT i.symbol,
                i.netIncome + i.depreciationAndAmortization
                    - LEAST(ABS(c.capitalExpenditure), i.depreciationAndAmortization) AS owner_earnings
            FROM income_latest i JOIN cashflow_latest c ON i.symbol = c.symbol AND c.rn = 1
            WHERE i.rn = 1
        )
        SELECT calc.symbol, p.companyName,
            ROUND(calc.owner_earnings / k.marketCap * 100, 2) AS oe_yield_pct,
            ROUND(k.returnOnEquityTTM * 100, 1) AS roe_pct,
            ROUND(f.operatingProfitMarginTTM * 100, 1) AS op_margin_pct,
            ROUND(k.marketCap / 1e9, 1) AS market_cap_billions
        FROM calculated calc
        JOIN key_metrics_ttm k ON calc.symbol = k.symbol
        JOIN financial_ratios_ttm f ON calc.symbol = f.symbol
        JOIN profile p ON calc.symbol = p.symbol
        WHERE calc.owner_earnings > 0
          AND calc.owner_earnings / k.marketCap > 0.05
          AND calc.owner_earnings / k.marketCap < 0.50
          AND k.returnOnEquityTTM > 0.10
          AND f.operatingProfitMarginTTM > 0.10
          AND k.marketCap > 1e9
          AND p.exchange IN ('NYSE', 'NASDAQ', 'AMEX')
        ORDER BY calc.owner_earnings / k.marketCap DESC
        LIMIT 30
    """,
    "options": {"format": "json", "limit": 100}
})
task_id = resp.json()["taskId"]

while True:
    result = requests.get(f"{BASE}/tasks/data-query/{task_id}",
                          headers={"X-API-Key": API_KEY}).json()
    if result["status"] in ("completed", "failed"):
        break
    time.sleep(2)

for r in result["result"]["rows"][:10]:
    print(f"{r['symbol']:8s} OE Yield={r['oe_yield_pct']}% ROE={r['roe_pct']}% MCap=${r['market_cap_billions']}B")
Get your API key at cetaresearch.com. The full backtest code (Python + DuckDB) is on GitHub.
Data: Ceta Research, FMP financial data warehouse. Universe: NYSE + NASDAQ + AMEX. Annual rebalance (July), equal weight top 30, 2000-2025. Transaction costs included.
Past performance does not guarantee future results. This is educational content, not investment advice.


