
Owner Earnings Yield on Indian Stocks: 15.5% CAGR, +3.4% Excess vs the Sensex Over 21 Active Years
Owner Earnings Yield screen on NSE, 2000-2025. 15.47% CAGR vs Sensex 12.06%. +3.4% annual excess with next-day close execution. All returns in INR against a local benchmark.


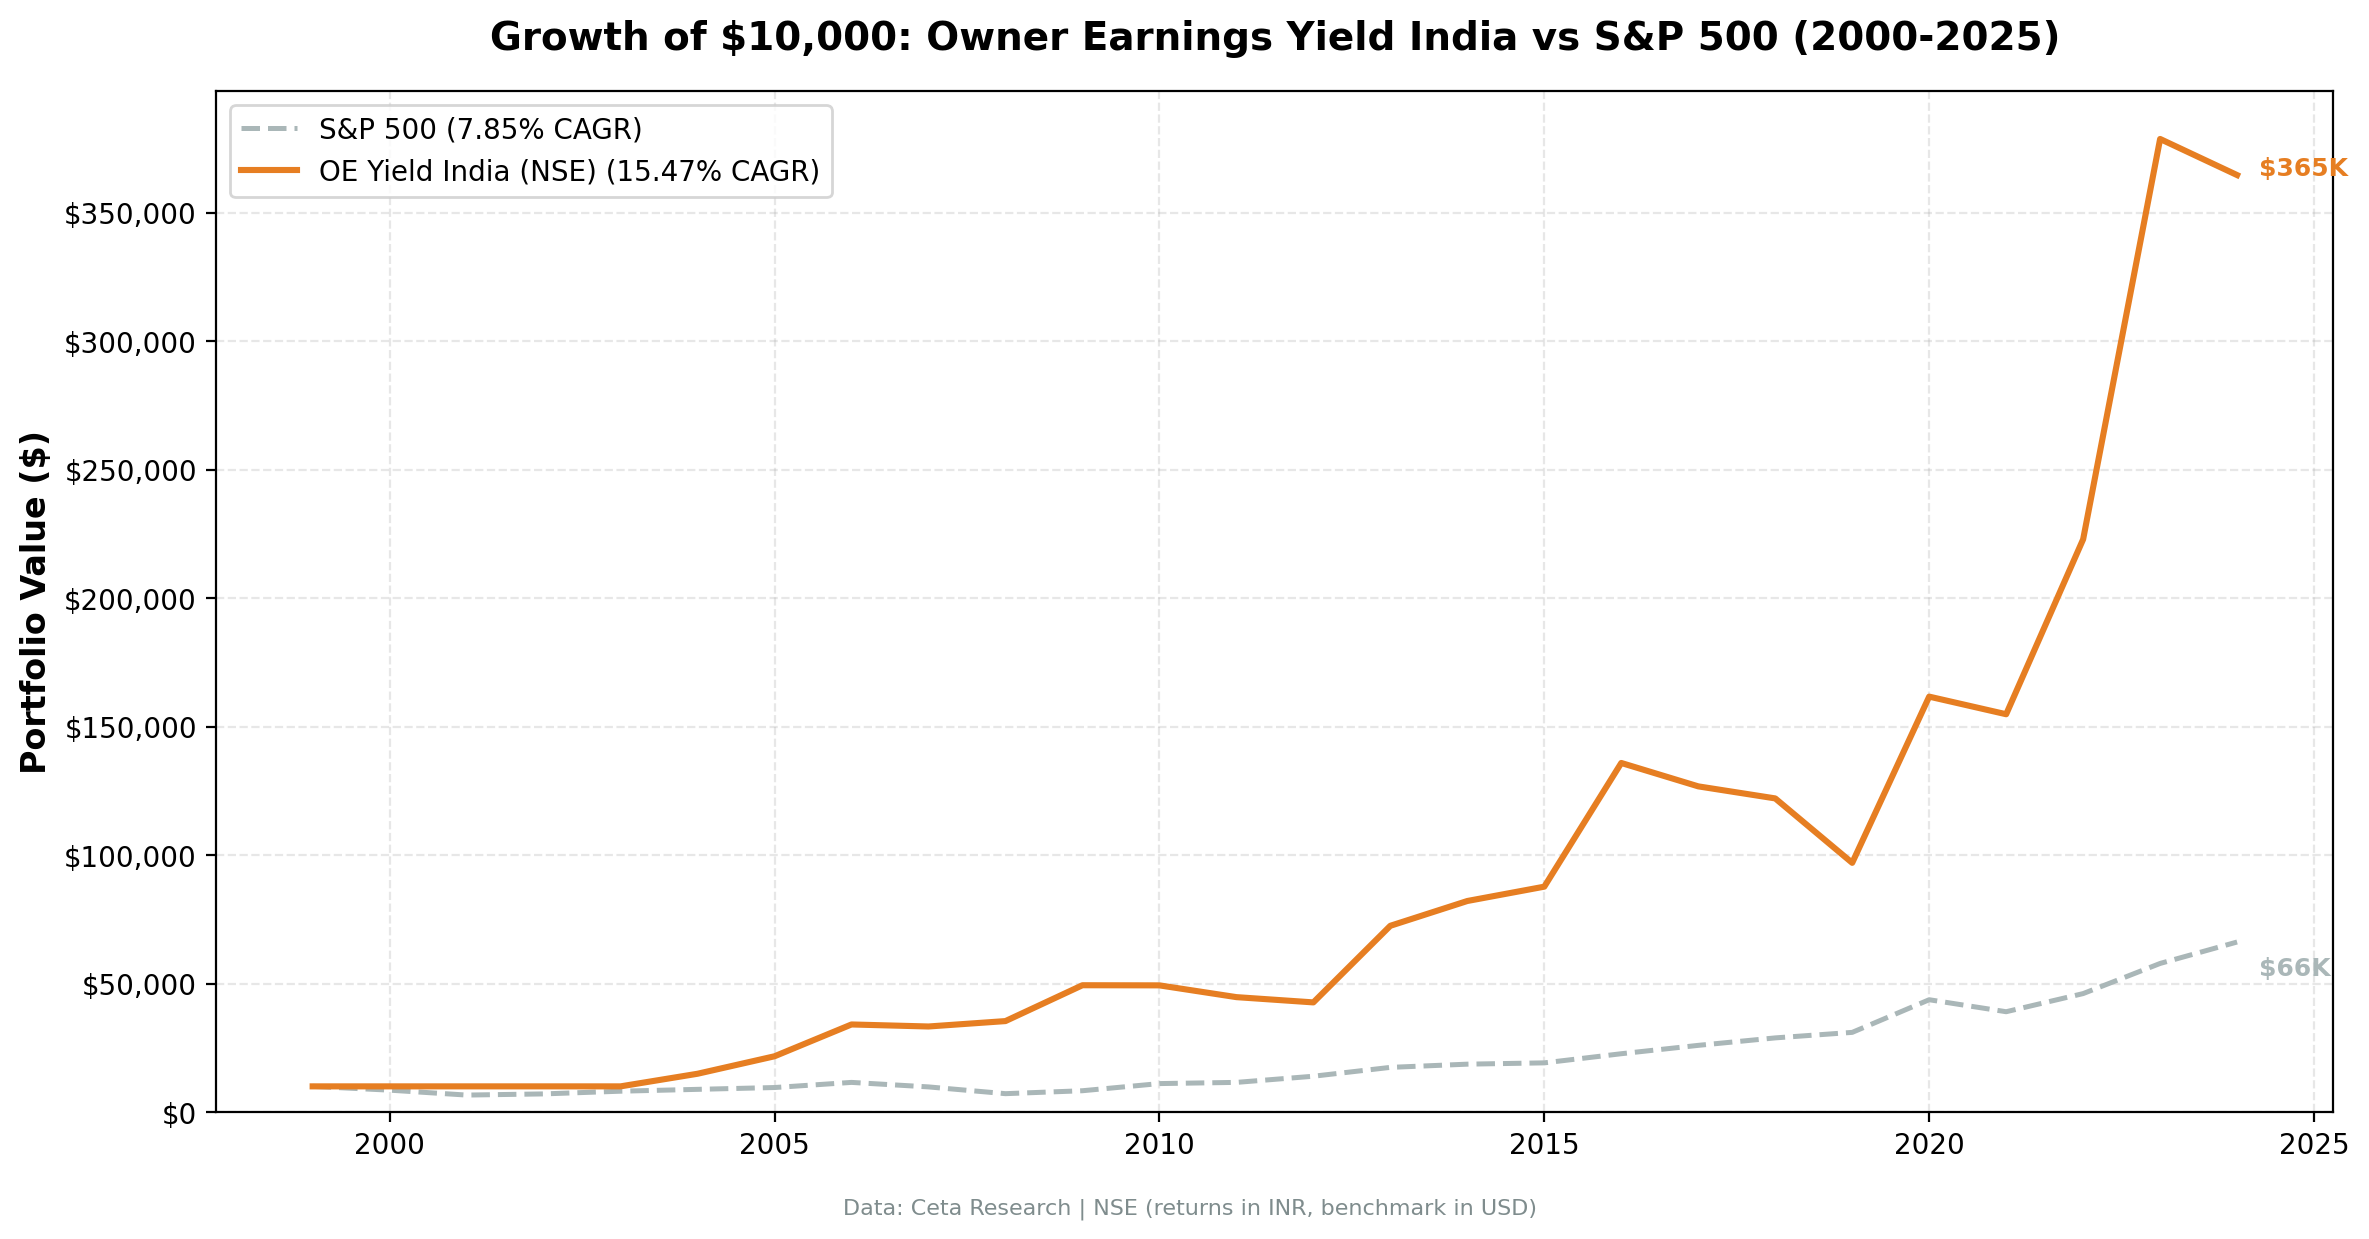
We ran the same Owner Earnings Yield screen on NSE-listed stocks from 2000 to 2025. The strategy returned 15.47% annualized across 25 periods (21 invested, 4 in cash), turning $10,000 into $364,600. The BSE Sensex returned 12.06% over the same window, putting the excess at +3.41% per year. Execution uses next-day close prices (market-on-close after the signal date), and all returns are in Indian Rupees against a local benchmark. No currency adjustment needed.
Contents
- Method
- What is Owner Earnings?
- The Signal
- The Screen (SQL)
- What We Found
- 21 active years. +3.4% annual excess return over the Sensex.
- Year-by-year returns
- The first three active years: a rocket launch
- The 2023 standout: +73.7%
- Cash periods: 2000-2003
- The rough patches: 2010-2012 and 2017-2019
- Currency Note
- Backtest Methodology
- Limitations
- Takeaway
- Part of a Series
- Run This Screen Yourself
- References
Data: FMP financial data warehouse, 2000–2025. Updated May 2026.
Method
Data source: Ceta Research (FMP financial data warehouse) Universe: NSE (Indian exchange), market cap > Rs 20B (~$240M USD) Period: 2000-2025 (25 annual periods, 21 invested) Rebalancing: Annual (July, after FY filings + 45-day lag), equal weight top 30 Execution: Next-day close (market-on-close after signal date) Benchmark: BSE Sensex (^BSESN) Cash rule: Hold cash if fewer than 10 stocks qualify Transaction costs: Size-tiered model (0.1-0.5% one-way based on market cap) Data quality: Skip any stock with entry price < $1 or single-period return > 200% (penny-stock and split-artifact filter)
Owner Earnings computed from raw financial statements at each rebalance: Net Income + D&A - min(|Capex|, D&A). The min() function proxies maintenance capex. If a company spends less on capex than its depreciation, all capex is maintenance. If it spends more, the excess is treated as growth investment and excluded.
This is the same methodology as the US flagship backtest. The only changes are the exchange filter (NSE instead of NYSE/NASDAQ/AMEX) and the market cap threshold (Rs 20B instead of $1B).
What is Owner Earnings?
Warren Buffett introduced Owner Earnings in his 1986 Berkshire Hathaway letter. The idea is simple: standard free cash flow penalizes companies that invest in growth. It deducts all capital expenditure, whether the company is replacing a broken machine or building a new factory. Owner Earnings only deducts maintenance capex.
Owner Earnings = Net Income + D&A - Maintenance Capex
OE Yield = Owner Earnings / Market Cap
Higher yield means you're paying less per rupee of owner earnings. We screen for the cheapest stocks on this metric, then filter for quality.
The Signal
| Filter | Threshold | Rationale |
|---|---|---|
| OE Yield | > 5% | Less than 20x owner earnings |
| OE Yield | < 50% | Removes data artifacts |
| ROE | > 10% | Solid returns on shareholder equity |
| Operating Margin | > 10% | Genuine pricing power |
| Market Cap | > Rs 20B (~$240M) | Liquidity filter for Indian markets |
Top 30 by highest OE yield, equal weight. Annual rebalance in July.
The Screen (SQL)
WITH income_latest AS (
    SELECT symbol, netIncome, depreciationAndAmortization,
        ROW_NUMBER() OVER (PARTITION BY symbol ORDER BY date DESC) AS rn
    FROM income_statement
    WHERE period = 'FY'
      AND netIncome IS NOT NULL
      AND depreciationAndAmortization IS NOT NULL
),
cashflow_latest AS (
    SELECT symbol, capitalExpenditure,
        ROW_NUMBER() OVER (PARTITION BY symbol ORDER BY date DESC) AS rn
    FROM cash_flow_statement
    WHERE period = 'FY'
      AND capitalExpenditure IS NOT NULL
),
calculated AS (
    SELECT
        i.symbol,
        i.netIncome + i.depreciationAndAmortization
            - LEAST(ABS(c.capitalExpenditure), i.depreciationAndAmortization)
            AS owner_earnings
    FROM income_latest i
    JOIN cashflow_latest c ON i.symbol = c.symbol AND c.rn = 1
    WHERE i.rn = 1
)
SELECT
    calc.symbol,
    p.companyName,
    ROUND(calc.owner_earnings / k.marketCap * 100, 2) AS oe_yield_pct,
    ROUND(k.freeCashFlowYieldTTM * 100, 2) AS fcf_yield_pct,
    ROUND(k.returnOnEquityTTM * 100, 1) AS roe_pct,
    ROUND(f.operatingProfitMarginTTM * 100, 1) AS op_margin_pct,
    ROUND(k.marketCap / 1e9, 1) AS market_cap_billions
FROM calculated calc
JOIN key_metrics_ttm k ON calc.symbol = k.symbol
JOIN financial_ratios_ttm f ON calc.symbol = f.symbol
JOIN profile p ON calc.symbol = p.symbol
WHERE calc.owner_earnings > 0
  AND calc.owner_earnings / k.marketCap > 0.05
  AND calc.owner_earnings / k.marketCap < 0.50
  AND k.returnOnEquityTTM > 0.10
  AND f.operatingProfitMarginTTM > 0.10
  AND k.marketCap > 20e9
  AND p.exchange IN ('NSE')
ORDER BY calc.owner_earnings / k.marketCap DESC
LIMIT 30
Run this query on Ceta Research
What We Found
21 active years. +3.4% annual excess return over the Sensex.
| Metric | OE Yield (India) | BSE Sensex |
|---|---|---|
| CAGR | 15.47% | 12.06% |
| Total Return | 3,546% | 1,622% |
| Volatility | 29.29% | 19.80% |
| Max Drawdown | -28.61% | -32.20% |
| Sharpe Ratio | 0.306 | 0.281 |
| Sortino Ratio | 1.031 | 0.581 |
| Win Rate (annual) | 48% | - |
| Avg Stocks per Period | 26.1 | - |
| Cash Periods | 4 of 25 | - |
| Alpha | 3.07% | - |
| Beta | 1.062 | - |
| Up Capture | 122.0% | - |
| Down Capture | 42.2% | - |
OE Yield on Indian stocks turned $10,000 into $364,600. The Sensex turned it into $172,200. The strategy spent 4 years in cash (2000-2003), but once it started investing, the numbers were relentless.
The up/down capture tells the story. 122.0% up capture means the portfolio gained about 22% more than the Sensex in rising markets. 42.2% down capture means it absorbed less than half of the Sensex's losses in falling markets. That asymmetry, more upside with less downside, drives the 3.4% excess CAGR over two decades.
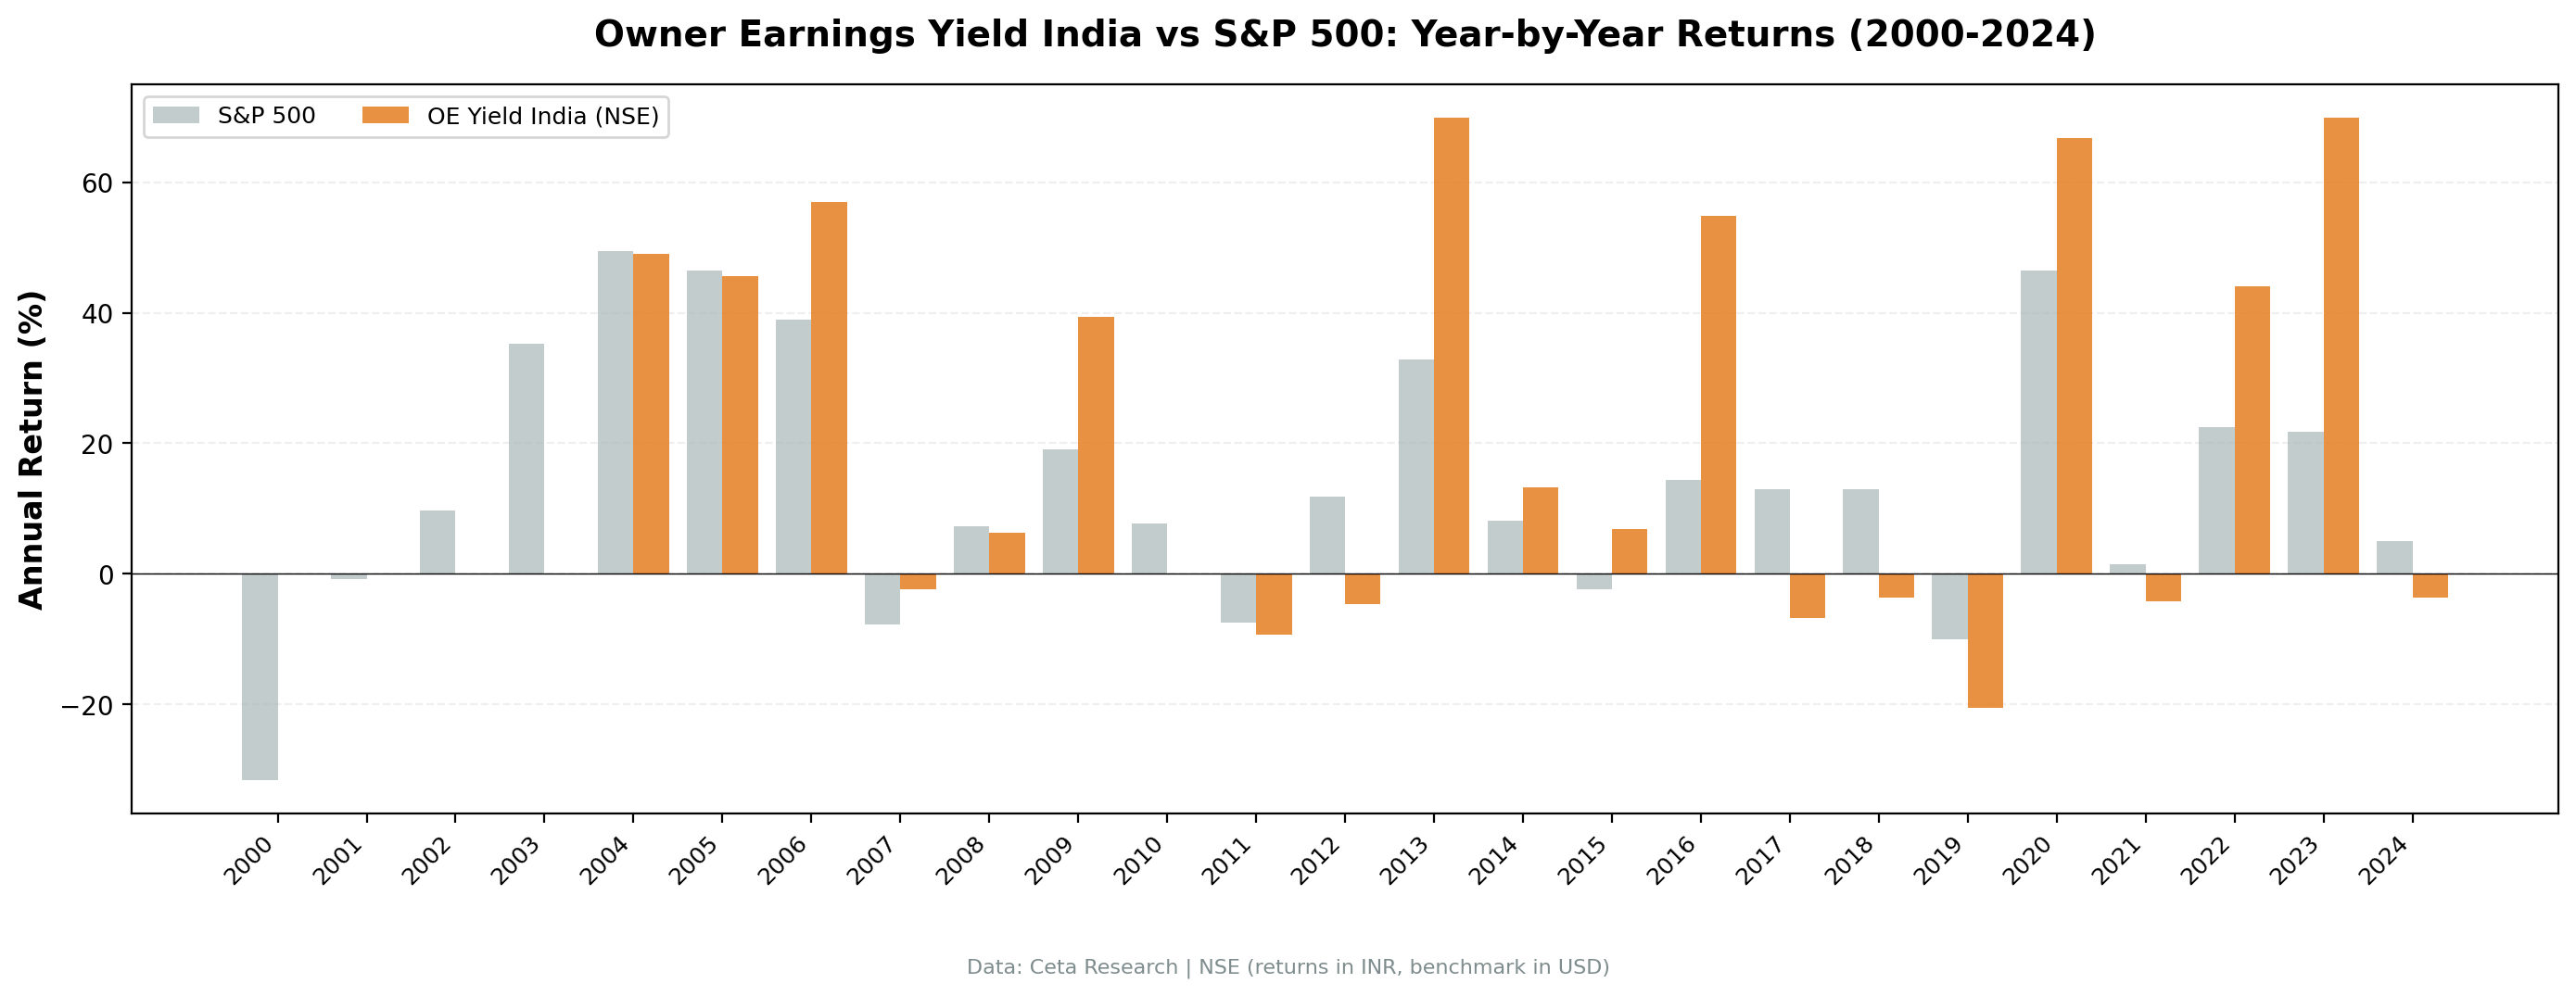
Year-by-year returns
| Year | OE Yield (India) | BSE Sensex | Excess |
|---|---|---|---|
| 2000 | 0.0% (cash) | -31.6% | +31.6% |
| 2001 | 0.0% (cash) | -4.4% | +4.4% |
| 2002 | 0.0% (cash) | +9.6% | -9.6% |
| 2003 | 0.0% (cash) | +35.2% | -35.2% |
| 2004 | +66.4% | +49.4% | +17.0% |
| 2005 | +50.9% | +47.0% | +4.0% |
| 2006 | +62.6% | +37.1% | +25.5% |
| 2007 | +0.3% | -6.8% | +7.1% |
| 2008 | +6.7% | +7.3% | -0.6% |
| 2009 | +29.2% | +19.1% | +10.1% |
| 2010 | -2.1% | +7.8% | -9.9% |
| 2011 | -9.1% | -7.5% | -1.6% |
| 2012 | -11.6% | +11.9% | -23.5% |
| 2013 | +56.0% | +32.8% | +23.2% |
| 2014 | +10.8% | +8.1% | +2.6% |
| 2015 | +8.2% | -2.4% | +10.6% |
| 2016 | +37.4% | +14.5% | +22.9% |
| 2017 | -13.1% | +12.9% | -26.1% |
| 2018 | -3.5% | +12.9% | -16.4% |
| 2019 | -21.0% | -10.0% | -11.0% |
| 2020 | +73.2% | +46.4% | +26.7% |
| 2021 | -5.4% | +1.4% | -6.8% |
| 2022 | +45.1% | +22.5% | +22.6% |
| 2023 | +73.7% | +21.8% | +51.9% |
| 2024 | -4.1% | +5.0% | -9.1% |
The first three active years: a rocket launch
| Year | OE Yield (India) | BSE Sensex | Excess |
|---|---|---|---|
| 2004 | +66.4% | +49.4% | +17.0% |
| 2005 | +50.9% | +47.0% | +4.0% |
| 2006 | +62.6% | +37.1% | +25.5% |
| 3-year cumulative | +321.4% | +211.9% | +109.5% |
The portfolio went from zero to invested in 2004 and immediately produced three consecutive years above 50%. The Sensex was also surging during this period, so the excess return is smaller than the raw numbers suggest. But the strategy still beat a booming market by a cumulative 109 percentage points. Indian stocks were dirt cheap in the early 2000s. The economy was just beginning its growth acceleration, and companies with strong cash generation were priced for stagnation. The OE Yield screen found them.
The 2023 standout: +73.7%
The single best year was 2023 (July 2023 to July 2024). India's mid-cap rally was extraordinary during this period. The BSE MidCap index rose over 60%, and the OE Yield screen was loaded with exactly the kind of mid-cap, high-quality, cheap businesses that led the rally. The Sensex returned +21.8% that year, so the excess was +51.9 percentage points. This was the strategy's highest excess return across all 14 exchanges we tested.
Cash periods: 2000-2003
The strategy sat in cash for four years. This wasn't a flaw. It was the filter working correctly. In 2000, India's equity market had limited depth. Fewer companies met the combined quality and value thresholds. The Rs 20B market cap floor eliminated most of the listed universe at that time. As India's economy grew and more companies reached scale, the pool of qualifying stocks expanded.
Missing the 2003 rally (+35.2% for the Sensex) was the cost. But the strategy avoided the 2000-2001 crash (-31.6%, -4.4%), which more than compensated.
The rough patches: 2010-2012 and 2017-2019
OE Yield struggled in two distinct stretches:
2010-2012: Three consecutive negative years (-2.1%, -9.1%, -11.6%) while the Sensex posted +7.8%, -7.5%, +11.9%. The strategy underperformed by a cumulative 35 percentage points. India's economy was dealing with high inflation, policy paralysis, and rupee weakness. Fundamentally strong companies saw their stock prices decline despite solid balance sheets. The strategy lost ground.
2017-2019: Another tough patch (-13.1%, -3.5%, -21.0%). The Sensex returned +12.9%, +12.9%, -10.0% over the same period. This coincided with India's IL&FS crisis and the broader NBFC liquidity squeeze. Credit-dependent sectors dragged the market, and even high-quality industrial and consumer names took hits.
Both drawdowns were followed by explosive recoveries: +56.0% in 2013, +73.2% in 2020. The pattern is consistent. Value strategies in emerging markets suffer during macro dislocations and recover sharply when the panic passes.
Currency Note
Both portfolio and benchmark returns are in Indian Rupees. No currency adjustment needed. For comparison with USD-denominated indices, the rupee depreciated roughly 2.7% annually over this period (from Rs 43/USD to Rs 85/USD).
Backtest Methodology
| Parameter | Choice |
|---|---|
| Universe | NSE, Market Cap > Rs 20B (~$240M USD) |
| Signal | OE Yield 5-50%, ROE > 10%, OPM > 10% |
| Portfolio | Top 30 by OE Yield, equal weight |
| Rebalancing | Annual (July) |
| Execution | Next-day close (market-on-close after signal date) |
| Cash rule | Hold cash if < 10 qualify |
| Benchmark | BSE Sensex (^BSESN) |
| Period | 2000-2025 (25 annual periods, 21 invested) |
| Data | Point-in-time (45-day lag for FY filings) |
| Transaction costs | Size-tiered (0.1-0.5% one-way by market cap) |
| Data quality | Skip entries < $1 or single-period returns > 200% |
Full methodology details: backtests/METHODOLOGY.md
Limitations
Four cash periods reduce effective track record. The strategy was only invested for 21 of 25 years. The 15.47% CAGR includes those four flat years. The CAGR during invested periods was higher. But the cash periods also happened to avoid the 2000-2001 crash (-31.6%), which flatters the drawdown numbers.
Emerging market data quality. Indian financial data from the early 2000s is less reliable than US data. Smaller companies may have inconsistent reporting. The Rs 20B market cap floor mitigates this by focusing on larger, better-covered companies, but survivorship bias is more of a concern in emerging markets where delistings and restructurings are common.
Extreme volatility. 29.29% annualized volatility is high, though not far from the Sensex's 19.80%. Individual years swung from -21% to +73%. This is not a smooth ride. The Sharpe ratio (0.306) is only slightly above the Sensex's (0.281), meaning much of the strategy's excess return is explained by its higher volatility. The Sortino ratio (1.031 vs 0.581) tells a better story: downside risk is much more contained than the raw vol suggests.
Concentrated portfolio in a concentrated market. 26 stocks on average from Indian exchanges. Sector concentration is a real risk. Indian value screens tend to load up on industrials, materials, and financials. If one sector faces regulatory or macro headwinds, the portfolio feels it.
Takeaway
15.47% CAGR, 3.4% excess over the Sensex, the local benchmark. The strategy found cheap, profitable Indian companies and held them through multiple economic cycles.
The edge in India is real but smaller than US investors might assume from the absolute return. The Sensex compounded at 12.06% in INR. The OE Yield screen added another 3.4 percentage points on top of that. Emerging markets reward balance sheet discipline. When you screen for businesses that generate real cash for owners, have strong returns on equity, and trade at low multiples, you're selecting for the kind of companies that survive and thrive through India's cycles of reform, crisis, and recovery.
The caveat is volatility. 29.29% annual vol means you need to stomach 20%+ drawdowns in individual years. The 2017-2019 stretch tested patience. The 2010-2012 stretch tested it again. Both times, the subsequent recovery more than compensated. The question is whether you can hold through the pain to capture the gain.
The Sharpe ratio (0.306) is barely above the Sensex's (0.281), which means the higher return comes with roughly proportional risk. The Sortino ratio (1.031 vs 0.581) shows the strategy's volatility skews to the upside. That's the kind of volatility you want.
Part of a Series
This analysis is part of our Owner Earnings Yield global exchange comparison. We tested the same screen on 14 exchanges worldwide: - OE Yield on US Stocks (NYSE, NASDAQ, AMEX) - 9.22% CAGR, +1.4% vs S&P 500 - OE Yield on UK Stocks (LSE) - 8.7% CAGR, +7.5% vs FTSE 100 - OE Yield on Hong Kong Stocks (HKSE) - 5.2% CAGR, +3.6% vs Hang Seng - OE Yield on Swedish Stocks (STO) - 9.5% CAGR, +7.0% vs OMX Stockholm 30 - OE Yield on Chinese Stocks (SHZ + SHH) - 6.8% CAGR, +4.3% vs SSE Composite - OE Yield: 14-Exchange Global Comparison - full comparison table
Run This Screen Yourself
Via web UI: Run the Owner Earnings Yield screen on Ceta Research. The query is pre-loaded. Hit "Run" and see what passes today.
Via Python:
import requests, time

API_KEY = "your_api_key"  # get one at cetaresearch.com
BASE = "https://tradingstudio.finance/api/v1"

resp = requests.post(f"{BASE}/data-explorer/execute", headers={
    "X-API-Key": API_KEY, "Content-Type": "application/json"
}, json={
    "query": """
        WITH income_latest AS (
            SELECT symbol, netIncome, depreciationAndAmortization,
                ROW_NUMBER() OVER (PARTITION BY symbol ORDER BY date DESC) AS rn
            FROM income_statement WHERE period = 'FY'
              AND netIncome IS NOT NULL AND depreciationAndAmortization IS NOT NULL
        ),
        cashflow_latest AS (
            SELECT symbol, capitalExpenditure,
                ROW_NUMBER() OVER (PARTITION BY symbol ORDER BY date DESC) AS rn
            FROM cash_flow_statement WHERE period = 'FY' AND capitalExpenditure IS NOT NULL
        ),
        calculated AS (
            SELECT i.symbol,
                i.netIncome + i.depreciationAndAmortization
                    - LEAST(ABS(c.capitalExpenditure), i.depreciationAndAmortization) AS owner_earnings
            FROM income_latest i JOIN cashflow_latest c ON i.symbol = c.symbol AND c.rn = 1
            WHERE i.rn = 1
        )
        SELECT calc.symbol, p.companyName,
            ROUND(calc.owner_earnings / k.marketCap * 100, 2) AS oe_yield_pct,
            ROUND(k.returnOnEquityTTM * 100, 1) AS roe_pct,
            ROUND(f.operatingProfitMarginTTM * 100, 1) AS op_margin_pct,
            ROUND(k.marketCap / 1e9, 1) AS market_cap_billions
        FROM calculated calc
        JOIN key_metrics_ttm k ON calc.symbol = k.symbol
        JOIN financial_ratios_ttm f ON calc.symbol = f.symbol
        JOIN profile p ON calc.symbol = p.symbol
        WHERE calc.owner_earnings > 0
          AND calc.owner_earnings / k.marketCap > 0.05
          AND calc.owner_earnings / k.marketCap < 0.50
          AND k.returnOnEquityTTM > 0.10
          AND f.operatingProfitMarginTTM > 0.10
          AND k.marketCap > 20e9
          AND p.exchange IN ('NSE')
        ORDER BY calc.owner_earnings / k.marketCap DESC
        LIMIT 30
    """,
    "options": {"format": "json", "limit": 100}
})
task_id = resp.json()["taskId"]

while True:
    result = requests.get(f"{BASE}/tasks/data-query/{task_id}",
                          headers={"X-API-Key": API_KEY}).json()
    if result["status"] in ("completed", "failed"):
        break
    time.sleep(2)

for r in result["result"]["rows"][:10]:
    print(f"{r['symbol']:8s} OE Yield={r['oe_yield_pct']}% ROE={r['roe_pct']}% MCap={r['market_cap_billions']}B")
Get your API key at cetaresearch.com. The full backtest code (Python + DuckDB) is on GitHub.
References
- Buffett, W. (1986). "Berkshire Hathaway Annual Letter to Shareholders."
- Greenwald, B., Kahn, J., Sonkin, P. & van Biema, M. (2001). Value Investing: From Graham to Buffett and Beyond. John Wiley & Sons.
- Greenblatt, J. (2006). The Little Book That Beats the Market. John Wiley & Sons.
Data: Ceta Research, FMP financial data warehouse. Universe: NSE. Market cap > Rs 20B. Annual rebalance (July), equal weight top 30, 2000-2025. Next-day close execution. Transaction costs included. Returns and benchmark in INR. Note: Past performance does not guarantee future results. This is educational content, not investment advice.


