
Owner Earnings Yield on Swedish Stocks: 9.5% CAGR, +7.0% Over OMX Stockholm 30
We screened for stocks with high Owner Earnings yield on Sweden's Stockholm exchange from 2000 to 2025. The strategy returned 9.51% annually vs 2.55% for the OMX Stockholm 30. 76% win rate, 36% down capture, 0.389 Sharpe.

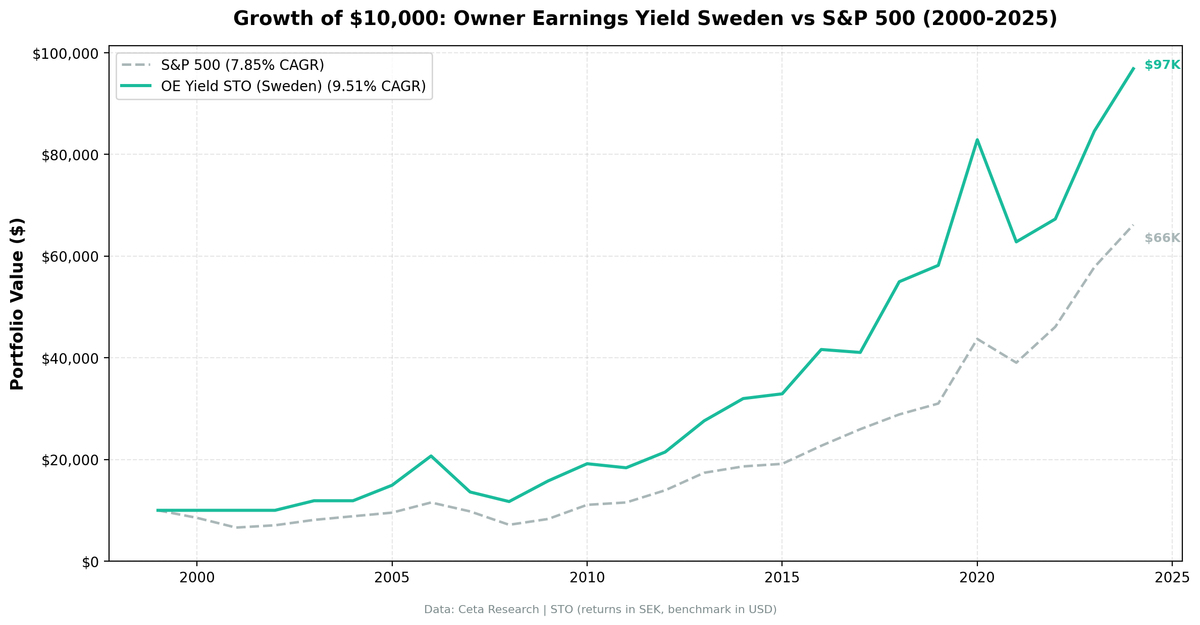
We ran the same Owner Earnings Yield screen on Sweden's Stockholm exchange (STO) from 2000 to 2025. The strategy returned 9.51% annually vs 2.55% for the OMX Stockholm 30. That's +6.95% annual excess over the local benchmark. The win rate is 76%. Sweden's deep industrial base produces exactly the kind of stocks this screen loves: capital-intensive businesses with high depreciation, moderate maintenance capex, and strong margins. The OMX30's max drawdown was -60.54%, significantly worse than the strategy's -43.34%.
Contents
- Method
- The Screen (SQL)
- What We Found
- 9.51% CAGR. 76% win rate. +7.0% annual excess over OMX30.
- Year-by-year returns
- The early years: cash was the right call
- 2007-2008 was rough. 2009 recovered.
- 2018: the standout year
- 2020: both sides won
- Why Sweden fits this screen
- Backtest Methodology
- Limitations
- Takeaway
- Part of a Series
- References
- Run This Screen Yourself
For methodology and a full explanation of Owner Earnings, see the US flagship post.
Data: FMP financial data warehouse, 2000–2025. Updated May 2026.
Method
| Parameter | Value |
|---|---|
| Universe | Stockholm (STO), market cap > 5B SEK (~$460M USD) |
| Signal | OE Yield 5-50%, ROE > 10%, OPM > 10% |
| Portfolio | Top 30 by OE Yield, equal weight |
| Rebalancing | Annual (July) |
| Execution | Next-day close (market-on-close after signal date) |
| Cash rule | Hold cash if fewer than 10 qualify |
| Benchmark | OMX Stockholm 30 (^OMXS30) |
| Period | 2000-2025 (25 annual periods) |
| Data | Point-in-time (45-day lag for FY filings) |
| Transaction costs | Size-tiered (0.1-0.5% one-way by market cap) |
| Data quality | Skip entries < $1 or single-period returns > 200% |
| Returns | SEK (local currency, matching benchmark) |
The Screen (SQL)
WITH income_latest AS (
    SELECT symbol, netIncome, depreciationAndAmortization,
        ROW_NUMBER() OVER (PARTITION BY symbol ORDER BY date DESC) AS rn
    FROM income_statement
    WHERE period = 'FY'
      AND netIncome IS NOT NULL
      AND depreciationAndAmortization IS NOT NULL
),
cashflow_latest AS (
    SELECT symbol, capitalExpenditure,
        ROW_NUMBER() OVER (PARTITION BY symbol ORDER BY date DESC) AS rn
    FROM cash_flow_statement
    WHERE period = 'FY'
      AND capitalExpenditure IS NOT NULL
),
calculated AS (
    SELECT
        i.symbol,
        i.netIncome + i.depreciationAndAmortization
            - LEAST(ABS(c.capitalExpenditure), i.depreciationAndAmortization)
            AS owner_earnings
    FROM income_latest i
    JOIN cashflow_latest c ON i.symbol = c.symbol AND c.rn = 1
    WHERE i.rn = 1
)
SELECT
    calc.symbol,
    p.companyName,
    ROUND(calc.owner_earnings / k.marketCap * 100, 2) AS oe_yield_pct,
    ROUND(k.freeCashFlowYieldTTM * 100, 2) AS fcf_yield_pct,
    ROUND(k.returnOnEquityTTM * 100, 1) AS roe_pct,
    ROUND(f.operatingProfitMarginTTM * 100, 1) AS op_margin_pct,
    ROUND(k.marketCap / 1e9, 1) AS market_cap_billions
FROM calculated calc
JOIN key_metrics_ttm k ON calc.symbol = k.symbol
JOIN financial_ratios_ttm f ON calc.symbol = f.symbol
JOIN profile p ON calc.symbol = p.symbol
WHERE calc.owner_earnings > 0
  AND calc.owner_earnings / k.marketCap > 0.05
  AND calc.owner_earnings / k.marketCap < 0.50
  AND k.returnOnEquityTTM > 0.10
  AND f.operatingProfitMarginTTM > 0.10
  AND k.marketCap > 5e9
  AND p.exchange IN ('STO')
ORDER BY calc.owner_earnings / k.marketCap DESC
LIMIT 30
Run this query on Ceta Research
What We Found

9.51% CAGR. 76% win rate. +7.0% annual excess over OMX30.
| Metric | OE Yield (STO) | OMX Stockholm 30 |
|---|---|---|
| CAGR | 9.51% | 2.55% |
| Total Return | 869% | 88% |
| Max Drawdown | -43.34% | -60.54% |
| Sharpe Ratio | 0.389 | 0.027 |
| Sortino Ratio | 0.780 | 0.040 |
| Win Rate (annual) | 76% | - |
| Alpha | 7.10% | - |
| Beta | 0.737 | - |
| Up Capture | 120.9% | - |
| Down Capture | 36.4% | - |
| Cash Periods | 4 of 25 | - |
| Avg Stocks per Period | 23.1 | - |
The OMX30 returned just 2.55% annually over 25 years, with a brutal -60.54% max drawdown. OE Yield's 0.389 Sharpe dwarfs the index's 0.027. The Sortino ratio of 0.780 confirms the strategy generates returns without proportionally increasing downside risk.
The capture ratios tell the rest of the story. Up capture of 121% means the portfolio rides $1.21 for every dollar the benchmark gains. Down capture of 36% means it absorbs roughly a third of the losses. That asymmetry compounds over 25 years. The 76% win rate is among the highest of any exchange we tested.
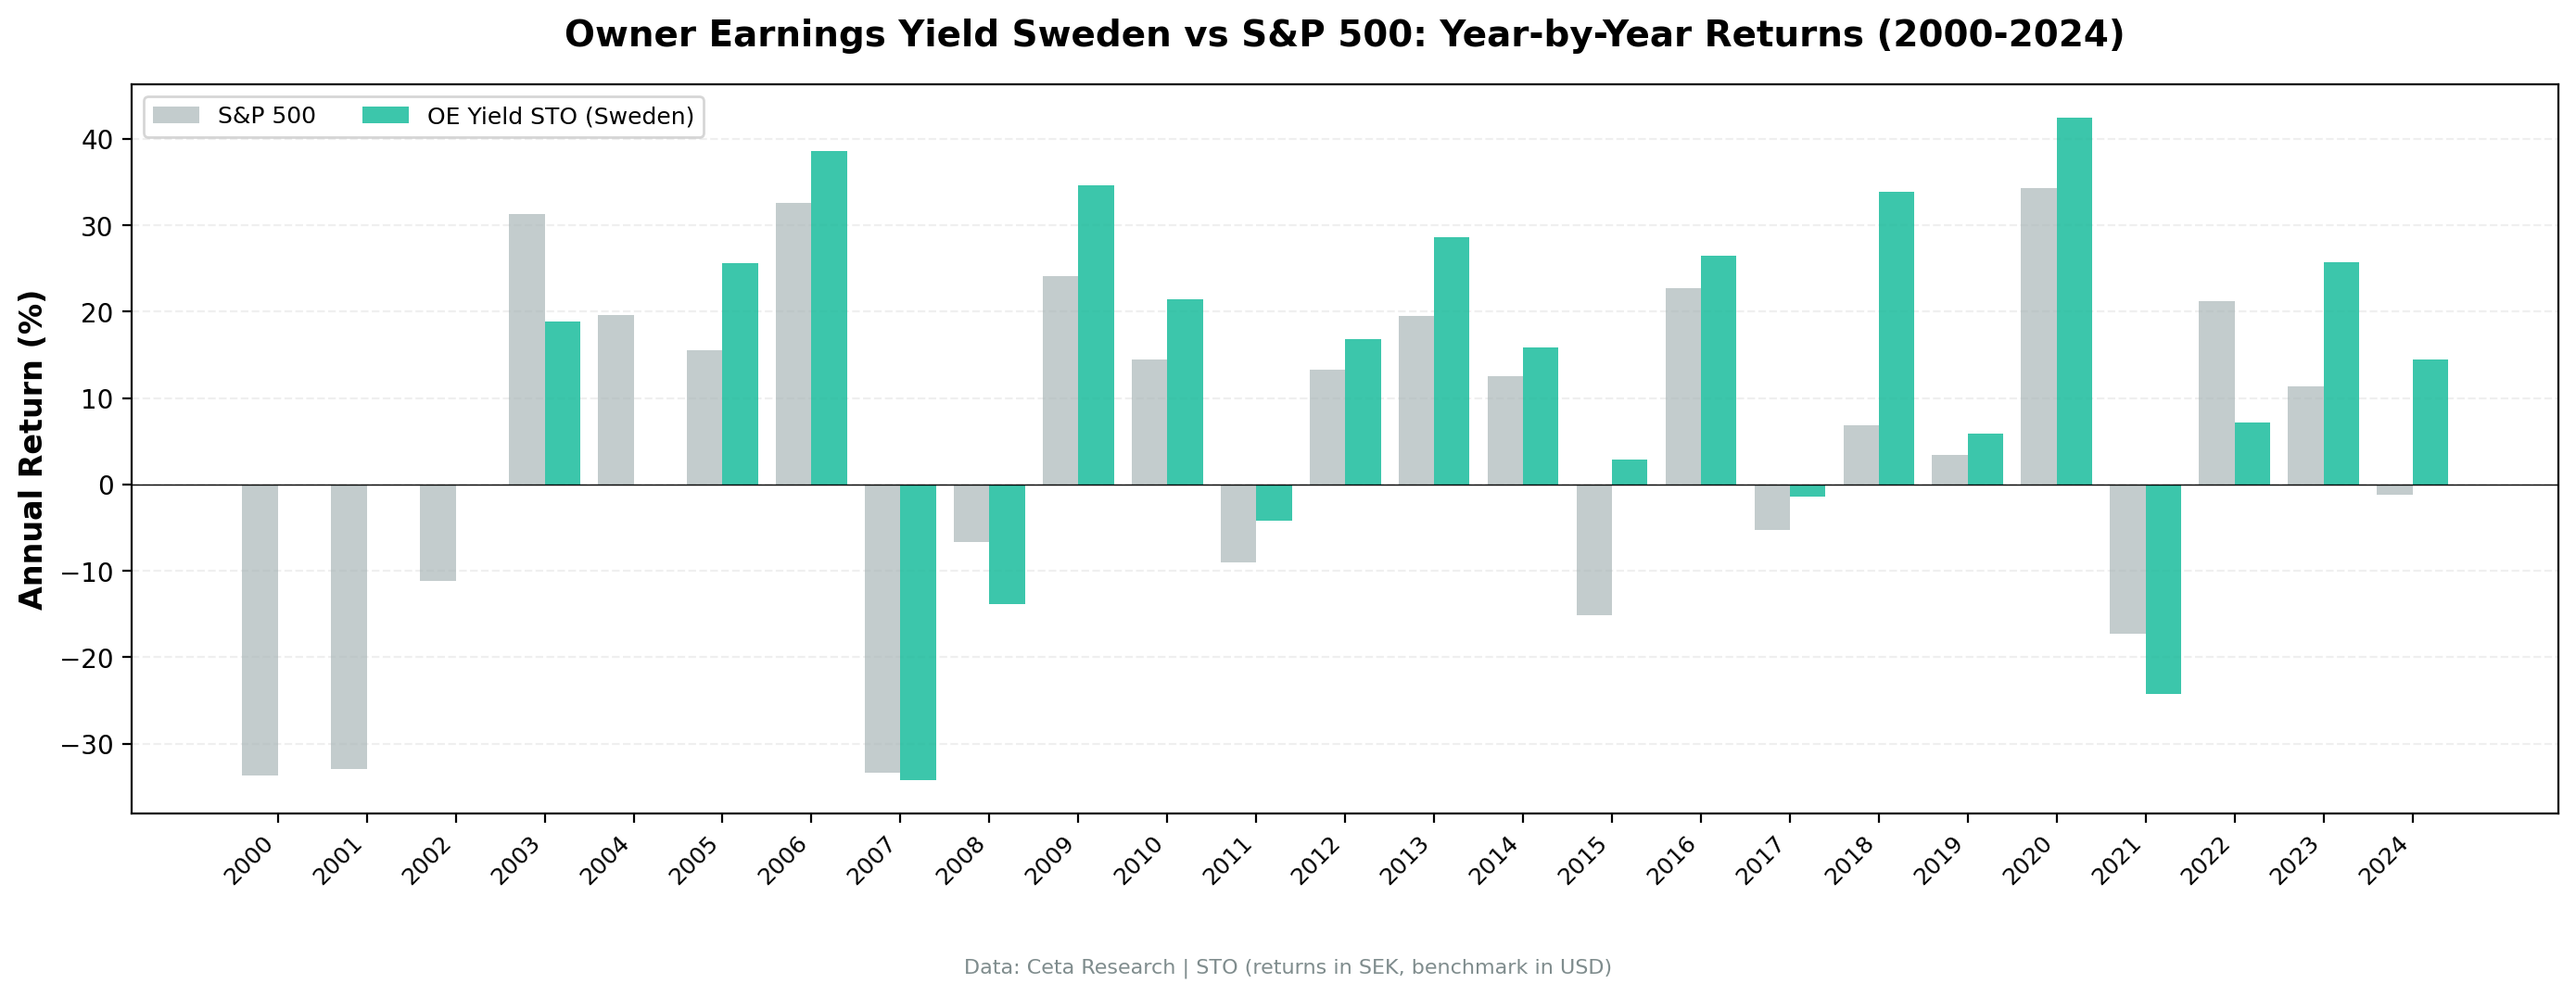
Year-by-year returns
| Year | OE Yield (STO) | OMX30 | Excess |
|---|---|---|---|
| 2000 | 0.0% (cash) | -33.7% | +33.7% |
| 2001 | 0.0% (cash) | -33.0% | +33.0% |
| 2002 | 0.0% (cash) | -11.2% | +11.2% |
| 2003 | +18.9% | +31.3% | -12.5% |
| 2004 | 0.0% (cash) | +19.6% | -19.6% |
| 2005 | +25.7% | +15.5% | +10.2% |
| 2006 | +38.5% | +32.6% | +6.0% |
| 2007 | -34.2% | -33.4% | -0.9% |
| 2008 | -13.8% | -6.7% | -7.1% |
| 2009 | +34.6% | +24.1% | +10.5% |
| 2010 | +21.4% | +14.5% | +6.9% |
| 2011 | -4.2% | -9.0% | +4.8% |
| 2012 | +16.9% | +13.3% | +3.5% |
| 2013 | +28.6% | +19.5% | +9.1% |
| 2014 | +15.9% | +12.5% | +3.3% |
| 2015 | +2.9% | -15.1% | +18.1% |
| 2016 | +26.5% | +22.8% | +3.7% |
| 2017 | -1.4% | -5.3% | +3.9% |
| 2018 | +33.9% | +6.9% | +27.0% |
| 2019 | +5.9% | +3.5% | +2.4% |
| 2020 | +42.5% | +34.3% | +8.1% |
| 2021 | -24.2% | -17.3% | -7.0% |
| 2022 | +7.2% | +21.2% | -14.0% |
| 2023 | +25.7% | +11.3% | +14.4% |
| 2024 | +14.5% | -1.2% | +15.8% |
The early years: cash was the right call
The strategy sat in cash from 2000 through 2002, and again in 2004. Sweden's mid-cap universe was smaller back then. Fewer than 10 stocks passed all the filters. That matters, because 2000-2002 were devastating for the OMX30: -33.7%, -33.0%, and -11.2% in consecutive years. Sitting in cash while the index lost more than half its value gave the portfolio a head start that it never gave back.
By 2003 the universe had expanded enough to fill the portfolio. The strategy entered the market just in time for the bull run: +18.9% in 2003, +25.7% in 2005, +38.5% in 2006.
2007-2008 was rough. 2009 recovered.
The worst single year was 2007: -34.2%, roughly matching the OMX30's -33.4%. Swedish industrial stocks got hit hard during the early stages of the global financial crisis. Many of Sweden's mid-cap industrials have global revenue exposure, and the market repriced them along with everything else.
2008 also stung. The OE Yield portfolio lost 13.8% while the OMX30 lost only 6.7%. The screen didn't protect in this particular downturn. But recovery from 2009 onward was stronger for OE Yield: +34.6% vs the OMX30's +24.1%.
2018: the standout year
The portfolio returned +33.9% while the OMX30 gained just 6.9%. That's +27.0% excess in a single year. This July 2018 to July 2019 period was strong for Swedish industrials and consumer companies with pricing power. While the broader market wobbled through the Q4 2018 sell-off, mid-caps with high owner earnings yields held up and then rallied into mid-2019. The OE Yield screen naturally concentrates in these types of businesses.
2020: both sides won
+42.5% for OE Yield vs +34.3% for OMX30. The strategy outperformed by 8.1 points in a year where everything rallied. Swedish mid-caps with strong fundamentals captured the post-COVID recovery fully, outpacing the large-cap dominated OMX30.
Why Sweden fits this screen
Sweden punches above its weight in capital-intensive industries. Companies like Volvo, Atlas Copco, Sandvik, SKF, and Alfa Laval have high depreciation charges from extensive manufacturing operations, but their maintenance capex is often well below total D&A. That gap between depreciation and maintenance capex is exactly what Owner Earnings captures. These businesses spend on growth, and the OE Yield screen doesn't penalize them for it.
The 5B SEK market cap threshold (~$460M USD) filters out micro-caps while still accessing Sweden's deep bench of industrial mid-caps. The average of 23.1 stocks per period confirms that the Swedish universe is large enough to populate the portfolio consistently once you get past the early 2000s data gap.
Backtest Methodology
| Parameter | Choice |
|---|---|
| Universe | STO exchange, Market Cap > 5B SEK (~$460M USD) |
| Signal | OE Yield 5-50%, ROE > 10%, OPM > 10% |
| Portfolio | Top 30 by OE Yield, equal weight |
| Rebalancing | Annual (July) |
| Execution | Next-day close (market-on-close after signal date) |
| Cash rule | Hold cash if < 10 qualify |
| Benchmark | OMX Stockholm 30 (^OMXS30) |
| Period | 2000-2025 (25 annual periods) |
| Data | Point-in-time (45-day lag for FY filings) |
| Transaction costs | Size-tiered (0.1-0.5% one-way by market cap) |
| Data quality | Skip entries < $1 or single-period returns > 200% |
Full methodology details: backtests/METHODOLOGY.md
Limitations
Four cash periods. The portfolio was empty from 2000 to 2002 and in 2004. Those years are effectively a zero-return placeholder, not a test of the strategy's stock-picking ability. The effective invested period starts in 2003 (with a gap in 2004). The cash years happened to coincide with the OMX30's worst stretch (-33.7%, -33.0%, -11.2%), which flatters the relative performance.
Concentrated portfolio. 23.1 stocks on average. A single bad pick carries meaningful weight in an equal-weight portfolio of this size.
2007-2008 drawdown. -34.2% is the worst single year and -43.34% is the max drawdown. Swedish industrials have global cyclical exposure. In a global recession, this portfolio won't protect you.
Survivorship bias. Current exchange listings are used to define the universe. Delisted companies and M&A targets aren't fully captured in the historical universe.
Small-market depth. The STO universe is smaller than NYSE or NSE. In the early 2000s, it was too small for the strategy to invest at all. If Swedish market listings shrink in the future, the cash rule could activate more often.
Takeaway
OE Yield on Swedish stocks delivers 9.51% CAGR with +6.95% annual excess over the OMX Stockholm 30. The 76% win rate is among the highest of any exchange we tested. Down capture of 36% means the portfolio absorbs roughly a third of the benchmark's losses.
Sweden's industrial structure is a natural fit for this screen. High depreciation, moderate maintenance capex, and strong margins are the hallmarks of Swedish manufacturing. The OE Yield formula rewards exactly those characteristics.
The honest caveat: the 2000-2002 cash periods flatter the track record because the OMX30 was collapsing during those years. But even excluding the cash periods, the strategy beat the index in 15 of 21 invested years. A 0.389 Sharpe vs the OMX30's 0.027 isn't close. If you want OE Yield exposure in the Nordics, Sweden is where the data points.
Part of a Series
This analysis is part of our Owner Earnings Yield global exchange comparison. We tested the same screen on 14 exchanges worldwide: - OE Yield on US Stocks (NYSE + NASDAQ + AMEX) - 9.22% CAGR, +1.4% vs S&P 500 - OE Yield on Indian Stocks (NSE) - 15.5% CAGR, +3.4% vs Sensex - OE Yield on UK Stocks (LSE) - 8.7% CAGR, +7.5% vs FTSE 100 - OE Yield on Hong Kong Stocks (HKSE) - 5.2% CAGR, +3.6% vs Hang Seng - OE Yield on Chinese Stocks (SHZ + SHH) - 6.8% CAGR, +4.3% vs SSE Composite - OE Yield: 14-Exchange Global Comparison - full comparison table
References
- Buffett, W. (1986). "Berkshire Hathaway Annual Letter to Shareholders."
- Greenwald, B., Kahn, J., Sonkin, P. & van Biema, M. (2001). Value Investing: From Graham to Buffett and Beyond. John Wiley & Sons.
- Greenblatt, J. (2006). The Little Book That Beats the Market. John Wiley & Sons.
Run This Screen Yourself
Via web UI: Run the Owner Earnings Yield screen on Ceta Research. The query is pre-loaded with the STO exchange filter. Hit "Run" and see what passes today.
Via Python:
import requests, time

API_KEY = "your_api_key"  # get one at cetaresearch.com
BASE = "https://tradingstudio.finance/api/v1"

resp = requests.post(f"{BASE}/data-explorer/execute", headers={
    "X-API-Key": API_KEY, "Content-Type": "application/json"
}, json={
    "query": """
        WITH income_latest AS (
            SELECT symbol, netIncome, depreciationAndAmortization,
                ROW_NUMBER() OVER (PARTITION BY symbol ORDER BY date DESC) AS rn
            FROM income_statement WHERE period = 'FY'
              AND netIncome IS NOT NULL AND depreciationAndAmortization IS NOT NULL
        ),
        cashflow_latest AS (
            SELECT symbol, capitalExpenditure,
                ROW_NUMBER() OVER (PARTITION BY symbol ORDER BY date DESC) AS rn
            FROM cash_flow_statement WHERE period = 'FY' AND capitalExpenditure IS NOT NULL
        ),
        calculated AS (
            SELECT i.symbol,
                i.netIncome + i.depreciationAndAmortization
                    - LEAST(ABS(c.capitalExpenditure), i.depreciationAndAmortization) AS owner_earnings
            FROM income_latest i JOIN cashflow_latest c ON i.symbol = c.symbol AND c.rn = 1
            WHERE i.rn = 1
        )
        SELECT calc.symbol, p.companyName,
            ROUND(calc.owner_earnings / k.marketCap * 100, 2) AS oe_yield_pct,
            ROUND(k.returnOnEquityTTM * 100, 1) AS roe_pct,
            ROUND(f.operatingProfitMarginTTM * 100, 1) AS op_margin_pct,
            ROUND(k.marketCap / 1e9, 1) AS market_cap_billions
        FROM calculated calc
        JOIN key_metrics_ttm k ON calc.symbol = k.symbol
        JOIN financial_ratios_ttm f ON calc.symbol = f.symbol
        JOIN profile p ON calc.symbol = p.symbol
        WHERE calc.owner_earnings > 0
          AND calc.owner_earnings / k.marketCap > 0.05
          AND calc.owner_earnings / k.marketCap < 0.50
          AND k.returnOnEquityTTM > 0.10
          AND f.operatingProfitMarginTTM > 0.10
          AND k.marketCap > 5e9
          AND p.exchange IN ('STO')
        ORDER BY calc.owner_earnings / k.marketCap DESC
        LIMIT 30
    """,
    "options": {"format": "json", "limit": 100}
})
task_id = resp.json()["taskId"]

while True:
    result = requests.get(f"{BASE}/tasks/data-query/{task_id}",
                          headers={"X-API-Key": API_KEY}).json()
    if result["status"] in ("completed", "failed"):
        break
    time.sleep(2)

for r in result["result"]["rows"][:10]:
    print(f"{r['symbol']:8s} OE Yield={r['oe_yield_pct']}% ROE={r['roe_pct']}% MCap={r['market_cap_billions']}B SEK")
Get your API key at cetaresearch.com. The full backtest code (Python + DuckDB) is on GitHub.
Data: Ceta Research, FMP financial data warehouse. Universe: STO exchange, market cap > 5B SEK. Benchmark: OMX Stockholm 30. Annual rebalance (July), equal weight top 30, 2000-2025. Next-day close execution. Returns in SEK. Transaction costs included.
Past performance does not guarantee future results. This is educational content, not investment advice.


