
One Screen, 14 Exchanges: Where Owner Earnings Yield Works Around the World
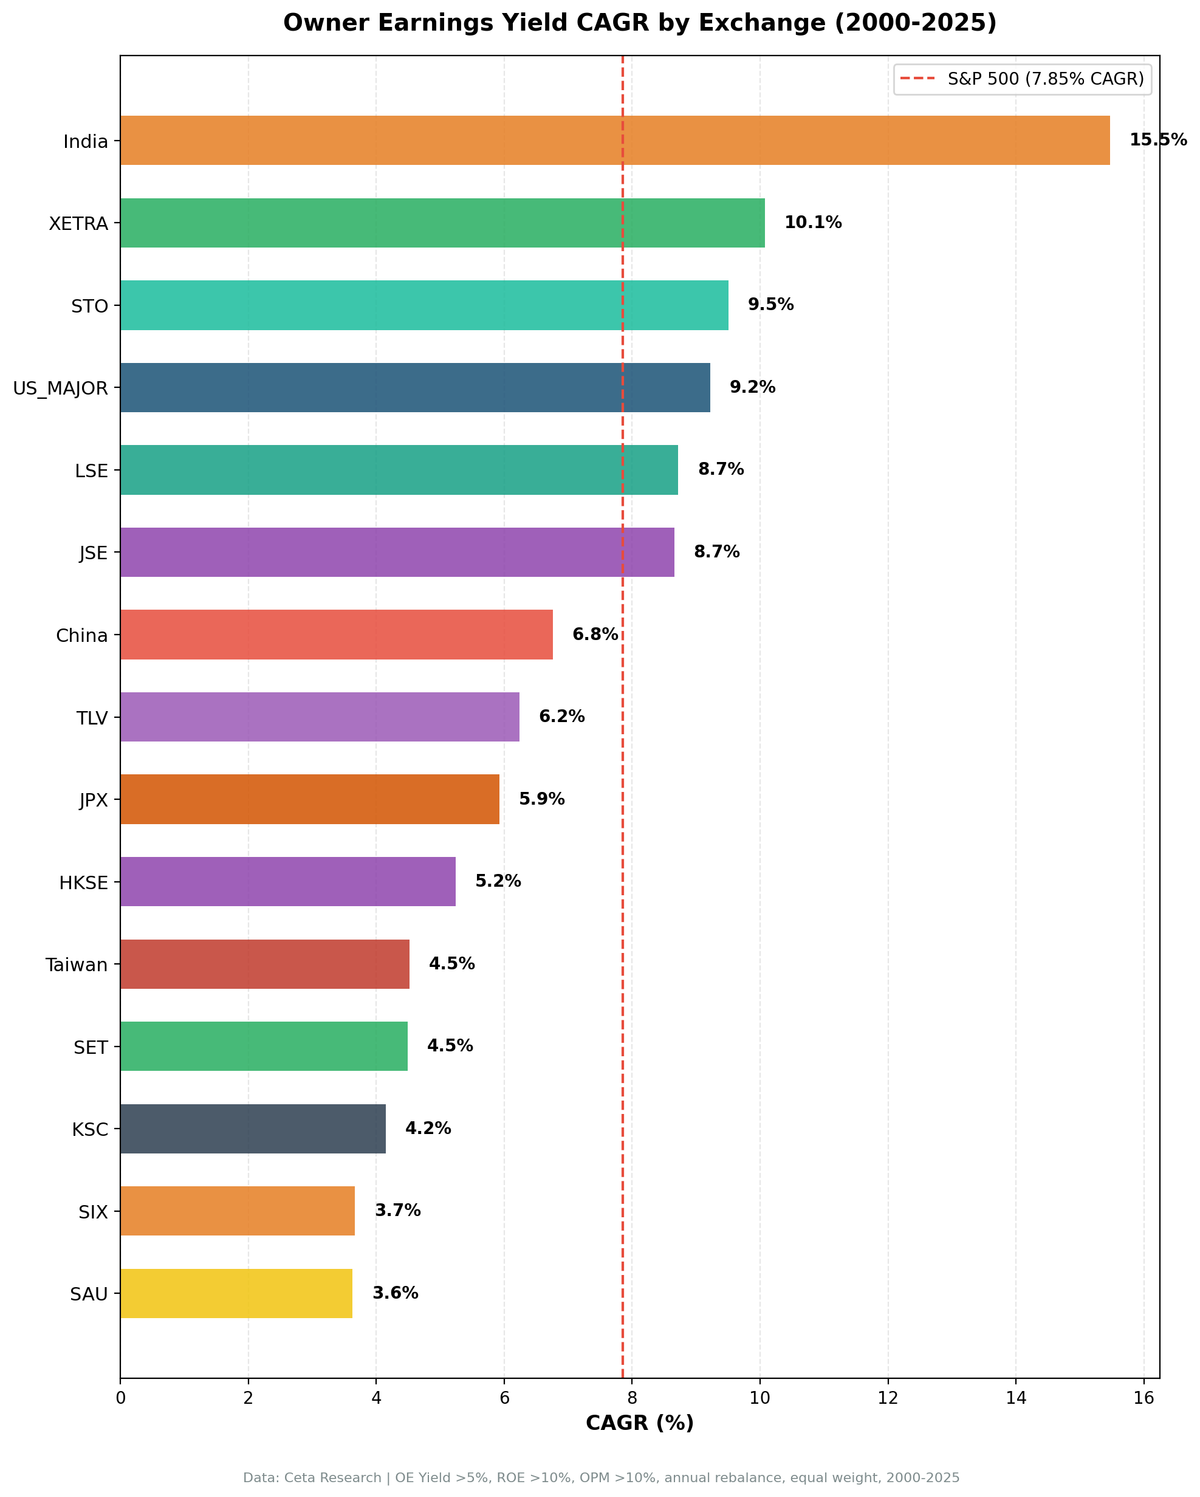
We ran the same Owner Earnings Yield screen on 14 global exchanges over 25 years. Ten of 14 beat their local benchmark. India leads at 15.47% CAGR. The UK delivers the largest local alpha (+7.5% vs FTSE). Sweden produces the best Sharpe (0.389).

We ran the same Owner Earnings Yield screen on 14 global exchanges over 25 years. Same filters everywhere: OE Yield 5-50%, ROE > 10%, operating margin > 10%, market cap above the local threshold. Top 30 stocks, equal weight, annual rebalance in July.
Contents
- Method
- Full Results: All 14 Exchanges
- The Winners: Ten Markets That Beat Their Local Benchmark
- India: 15.47% CAGR, the leader in absolute return
- Sweden: 9.51% CAGR, +6.95% vs OMX Stockholm 30
- US: 9.22% CAGR, modest alpha but steady
- UK: 8.72% CAGR, +7.49% vs FTSE 100
- Hong Kong: 5.24% CAGR, +3.60% vs Hang Seng
- China: 6.76% CAGR, +4.33% vs SSE Composite
- Japan (JPX): 5.93% CAGR, +2.61% vs Nikkei 225
- Switzerland (SIX): 3.67% CAGR, +1.92% vs SMI
- South Africa (JSE): 8.66% CAGR, +0.81% vs SPY
- Taiwan: 4.52% CAGR, +0.43% vs TAIEX
- The Underperformers: Four Markets Below Their Local Benchmark
- Israel (TLV): 6.24% CAGR, -1.61% vs SPY
- Saudi Arabia (SAU): 3.63% CAGR, -4.22% vs SPY
- Korea (KSC): 4.15% CAGR, -1.20% vs KOSPI
- Thailand (SET): 4.49% CAGR, -0.64% vs SET Index
- Excluded Exchanges
- Key Patterns Across Markets
- Measuring against the right benchmark changes the picture
- Universe size doesn't predict performance
- Emerging markets deliver more absolute return, developed markets deliver more risk-adjusted return
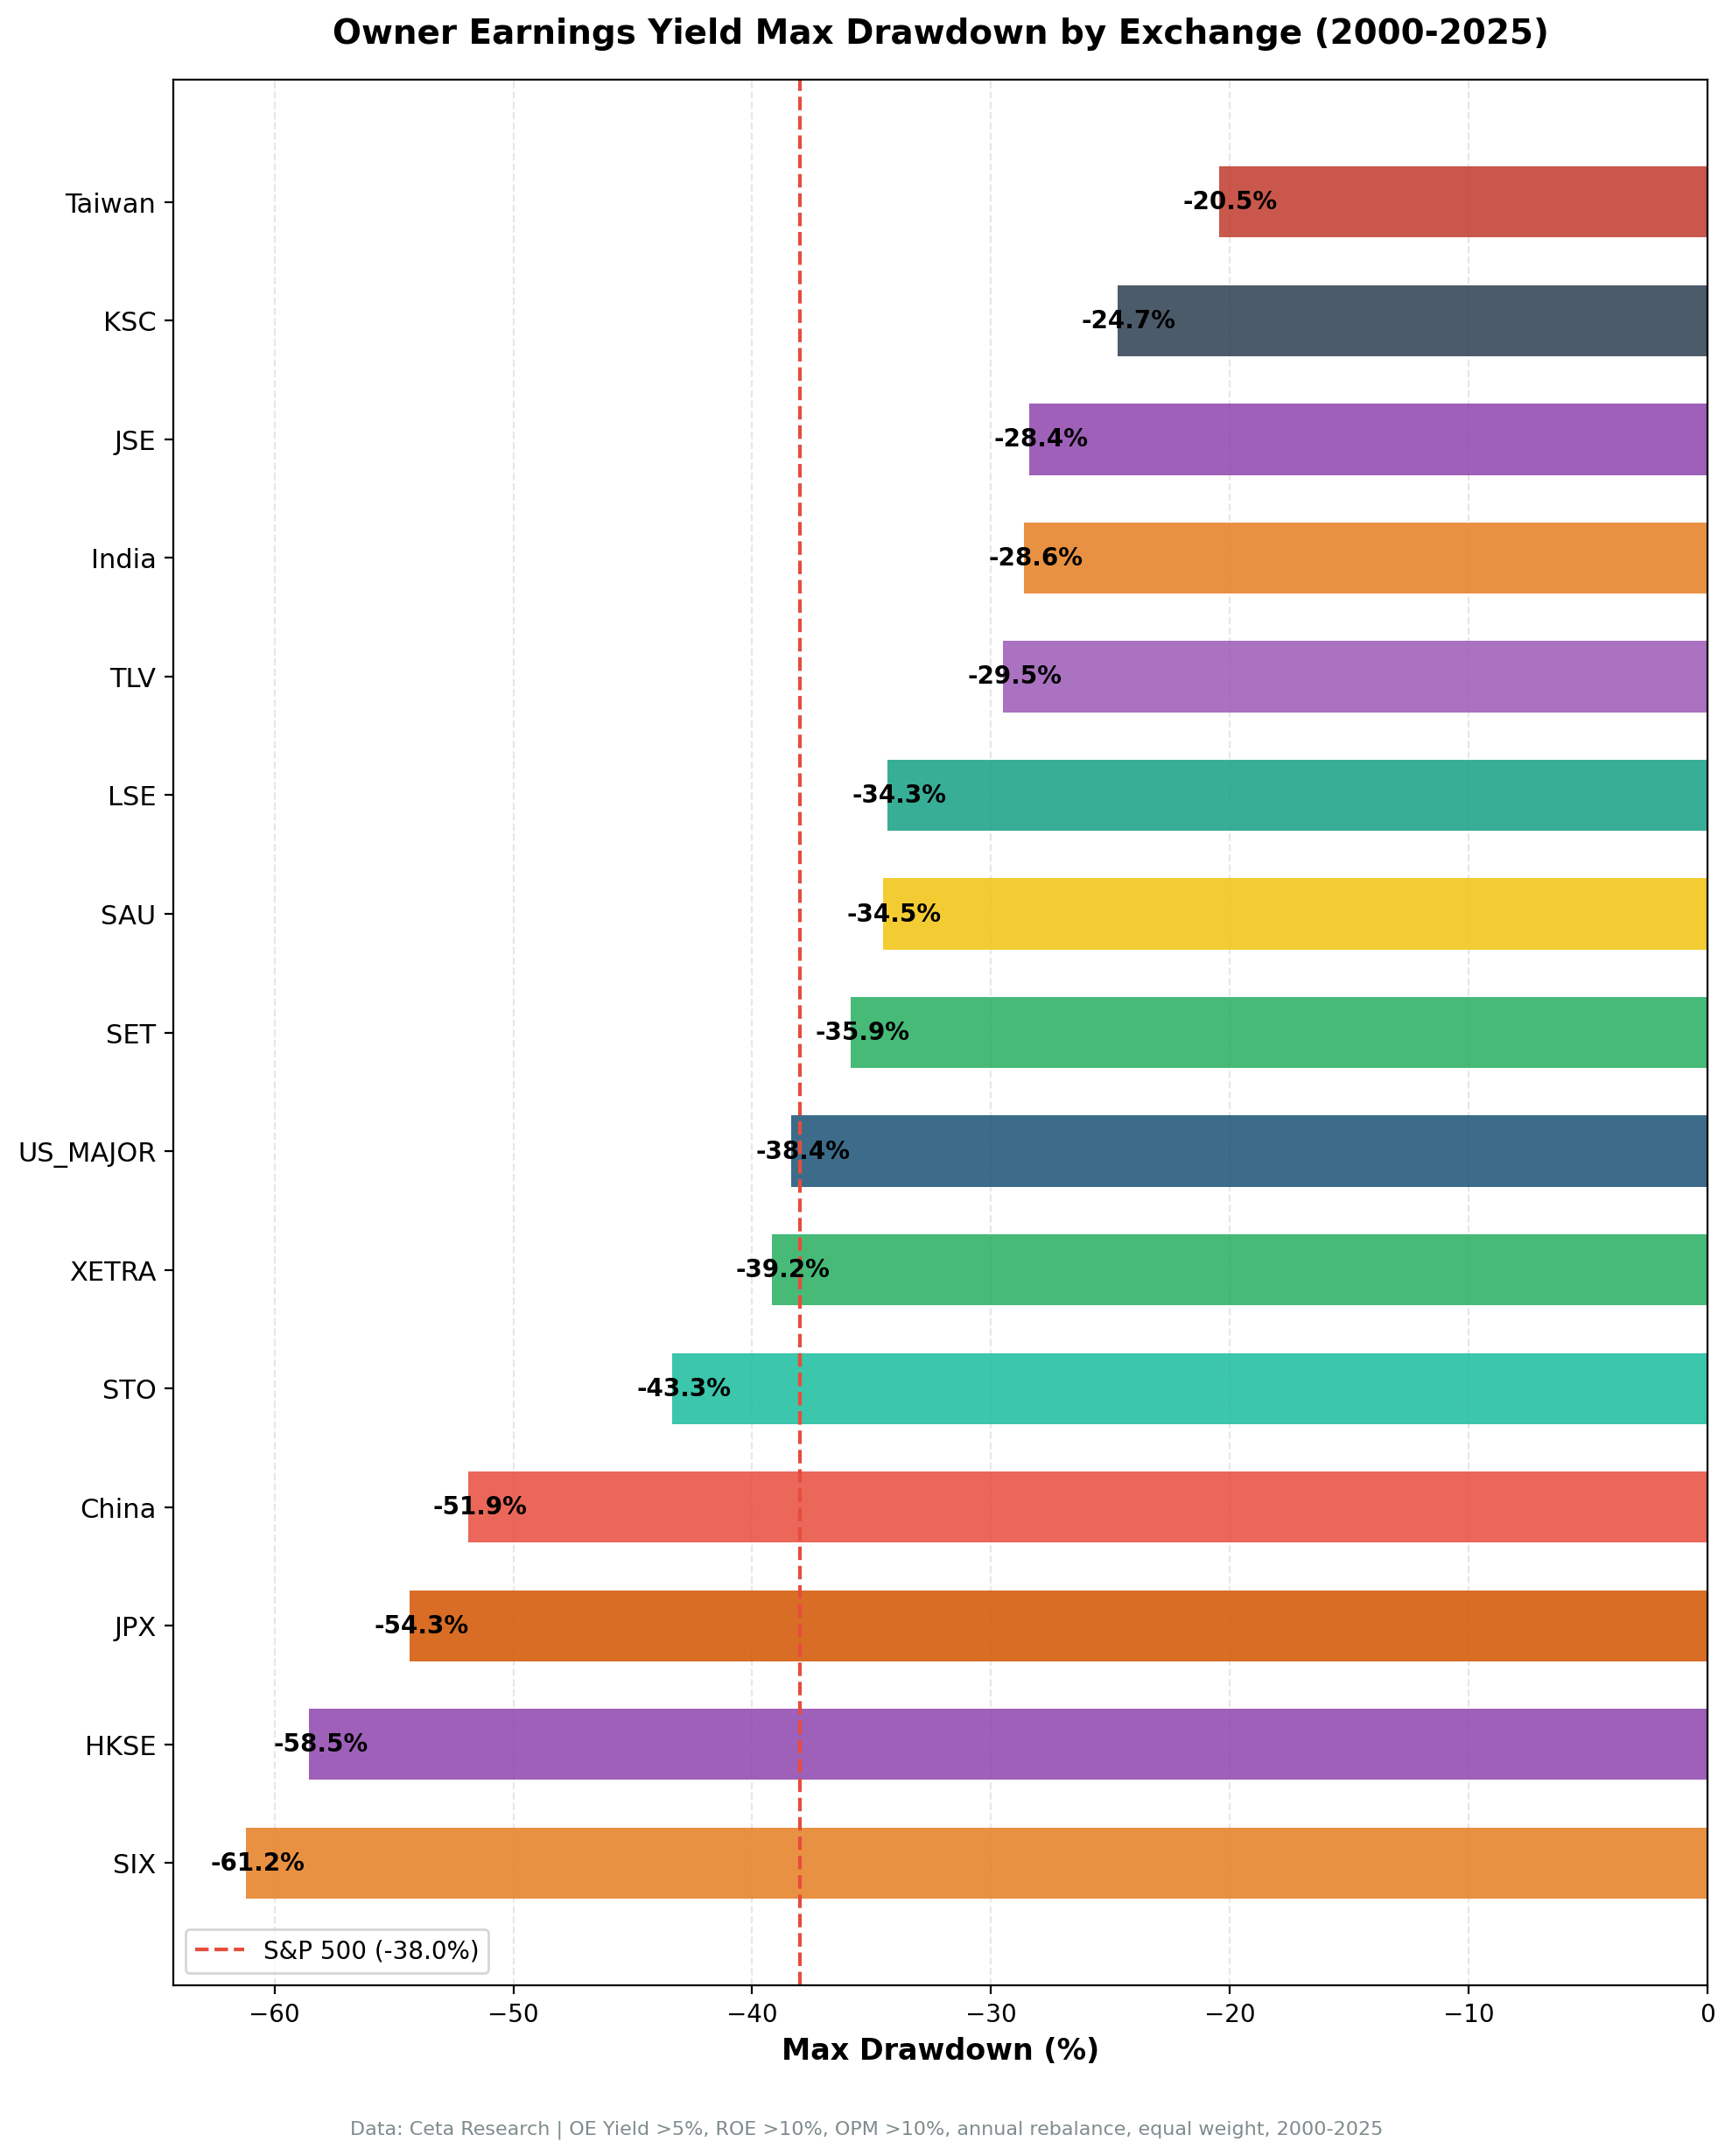
- Drawdowns vary wildly
- Cash periods signal trouble
- Currency Note
- What This Means for Investors
- Part of a Series
- Run This Screen Yourself
- References
Measured against local indices, 10 of 14 exchanges outperformed. Comparing a Swedish portfolio to SPY mixes currency effects with stock selection. Comparing it to the OMX Stockholm 30 isolates the strategy's contribution. India leads in absolute return at 15.47% CAGR. The US delivers steady results (0.342 Sharpe, zero cash periods). The UK, Sweden, China, and Hong Kong all produced over +3.5% annual alpha against their local benchmarks, numbers that were invisible when SPY was the only yardstick.
This run also applies tighter data-quality filters than earlier versions of this backtest. Stocks with entry prices below $1 or single-period returns above 200% are skipped to avoid penny-stock and split-adjustment artifacts. That correction lowered headline returns on most exchanges, especially the US (CAGR drops from 12.25% to 9.22%) and Hong Kong (10.44% to 5.24%). The UK, previously excluded for a 651% single-year artifact in 2010, now passes cleanly and joins the comparison set.
Data: FMP financial data warehouse, 2000–2025. Updated May 2026.
Method
Data source: Ceta Research (FMP financial data warehouse) Signal: Owner Earnings Yield = (Net Income + D&A - min(|Capex|, D&A)) / Market Cap Filters: OE Yield 5-50%, ROE > 10%, Operating Margin > 10% Portfolio: Top 30 by OE Yield, equal weight Rebalancing: Annual (July, after FY filings + 45-day lag) Execution: Next-day close (market-on-close after signal date) Cash rule: Hold cash if fewer than 10 stocks qualify Transaction costs: Size-tiered model (0.1-0.5% one-way based on market cap) Data quality: Skip entries below $1 or single-period returns above 200% Benchmarks: Local currency index where available (Sensex, S&P 500, Hang Seng, FTSE, etc.), with SPY as fallback for exchanges without a reliable local index Period: 2000-2025 (25 annual periods)
Market cap thresholds vary by exchange. The US uses $1B USD. Smaller markets use lower thresholds calibrated to local liquidity. Full methodology: backtests/METHODOLOGY.md.
Full Results: All 14 Exchanges

| Exchange | CAGR | Local Benchmark | Excess vs Local | Max DD | Sharpe | Cash | Avg Stocks |
|---|---|---|---|---|---|---|---|
| India (NSE) | 15.47% | Sensex (12.06%) | +3.41% | -28.6% | 0.306 | 4/25 | 26.1 |
| Sweden (STO) | 9.51% | OMX Stockholm 30 (2.55%) | +6.95% | -43.3% | 0.389 | 4/25 | 23.1 |
| US (NYSE+NASDAQ+AMEX) | 9.22% | S&P 500 (7.85%) | +1.37% | -38.4% | 0.342 | 0/25 | 21.3 |
| UK (LSE) | 8.72% | FTSE 100 (1.23%) | +7.49% | -34.3% | 0.282 | 0/25 | 13.7 |
| South Africa (JSE) | 8.66% | SPY (7.85%) | +0.81% | -28.4% | 0.000 | 5/25 | 17.6 |
| China (SHH+SHZ) | 6.76% | SSE Composite (2.43%) | +4.33% | -51.9% | 0.113 | 0/25 | 23.6 |
| Israel (TLV) | 6.24% | SPY (7.85%) | -1.61% | -29.5% | 0.139 | 7/25 | 17.8 |
| Japan (JPX) | 5.93% | Nikkei 225 (3.31%) | +2.61% | -54.3% | 0.258 | 4/25 | 28.0 |
| Hong Kong (HKSE) | 5.24% | Hang Seng (1.64%) | +3.60% | -58.5% | 0.105 | 0/25 | 21.3 |
| Taiwan (TAI+TWO) | 4.52% | TAIEX (4.09%) | +0.43% | -20.5% | 0.253 | 5/25 | 27.6 |
| Thailand (SET) | 4.49% | SET (5.13%) | -0.64% | -35.9% | 0.124 | 4/25 | 24.5 |
| Korea (KSC) | 4.15% | KOSPI (5.35%) | -1.20% | -24.7% | 0.062 | 7/25 | 27.0 |
| Switzerland (SIX) | 3.67% | SMI (1.74%) | +1.92% | -61.2% | 0.145 | 0/25 | 13.2 |
| Saudi (SAU) | 3.63% | SPY (7.85%) | -4.22% | -34.5% | 0.007 | 7/25 | 24.5 |
SPY benchmark: 7.85% CAGR. Local benchmarks listed per exchange. JSE, TLV, and SAU fall back to SPY (no reliable local index in the dataset).
The Winners: Ten Markets That Beat Their Local Benchmark
India: 15.47% CAGR, the leader in absolute return
India produced the highest absolute CAGR of any exchange tested. +3.41% annual excess over the Sensex, with a max drawdown (-28.6%) shallower than most exchanges in the set. The Indian universe is deep. 26.1 stocks per rebalance means the screen almost always found enough qualifying names. Only 4 of 25 periods went to cash, all in the early years when FMP coverage was thinner.
Older versions of this backtest reported larger excess returns for India because they didn't apply the data-quality filters. Even with the correction, India's edge is real and consistent. The Sensex itself compounded at 12.06% in INR over the period, so the OE Yield screen added another 3.4 percentage points on top of an already strong local market.
What makes India work? A large, growing pool of profitable mid-cap companies. Indian industrials, IT services, and consumer franchises frequently hit the ROE and margin filters while trading at high OE yields. The economic growth cycle concentrates value in the right sectors for this screen.
Full analysis: OE Yield on Indian Stocks (NSE)
Sweden: 9.51% CAGR, +6.95% vs OMX Stockholm 30
Sweden is the highest-conviction outperformer. The OMX Stockholm 30 returned just 2.55% CAGR, giving OE Yield +6.95% excess. A 0.389 Sharpe (the highest of all 14 exchanges), max drawdown of -43.3%, and a 76% win rate against the local index make Sweden one of the strongest results in the set.
Sweden's exchange is loaded with high-quality industrials (Atlas Copco, Sandvik, Alfa Laval) and tech companies (Hexagon, Ericsson) that frequently pass the quality filters. Only 4 cash periods, and the 23.1 average stocks per rebalance show consistent depth. For European investors looking for OE Yield exposure, Sweden is the strongest single-exchange option.
Full analysis: OE Yield on Swedish Stocks (STO)
US: 9.22% CAGR, modest alpha but steady
The US is the consistency story. 9.22% CAGR, 0.342 Sharpe, zero cash periods. The portfolio always found at least 10 qualifying stocks. The +1.37% excess over the S&P 500 is the same whether you measure against SPY or the local benchmark, because they're the same index.
The US edge dropped from the older +4.4% reading once the data-quality filters caught a handful of extreme single-stock returns that had been inflating early backtests. The remaining +1.37% lifetime alpha is real but concentrated in the 2000-2016 stretch. From 2017-2024, the strategy lagged SPY in 7 of 8 years as mega-cap growth dominated the market. Anyone starting the strategy in 2017 would have trailed the index.
Full analysis: OE Yield on US Stocks (NYSE+NASDAQ+AMEX)
UK: 8.72% CAGR, +7.49% vs FTSE 100
The UK is the biggest single-exchange story of this round. Earlier backtests excluded the LSE because one extreme 2010 return looked like a price-data artifact. The new data-quality filter catches that artifact directly, and the cleaned-up backtest produces 8.72% CAGR vs the FTSE 100's 1.23%. That's +7.49 percentage points of annual alpha, the largest local-benchmark excess of any exchange in the set.
Down capture of 18.4% is the lowest of any market we tested. Up capture of 170% is the highest. The portfolio runs hot in rallies and barely participates in sell-offs. Zero cash periods, 76% win rate against the index, and a max drawdown of -34.3% (shallower than the US version) round out a clean profile.
The LSE universe is thinner than larger exchanges. 13.7 average stocks per period is below the 21-28 range typical for big markets. That's a structural feature of London's listings, not a flaw in the screen.
Full analysis: OE Yield on UK Stocks (LSE)
Hong Kong: 5.24% CAGR, +3.60% vs Hang Seng
Hong Kong's results dropped significantly from earlier runs of this backtest. The old number was +8.80% vs Hang Seng. The data-quality filter caught several extreme single-stock returns that were inflating the historical CAGR. The honest reading is +3.60% excess. Still positive, still meaningful given the Hang Seng's 1.64% CAGR, but no longer a standout.
The HKD is pegged to the USD, so there's no currency translation effect. The +3.60% excess is real in both local and dollar terms.
Zero cash periods and 21.3 average stocks confirm a deep value universe. Hong Kong's property conglomerates, industrial holding companies, and Chinese H-share listings provide a steady supply of high-OE-yield names. The drawdown is steep (-58.5%), reflecting Hong Kong's sensitivity to mainland Chinese economic cycles and geopolitical risk.
Full analysis: OE Yield on Hong Kong Stocks (HKSE)
China: 6.76% CAGR, +4.33% vs SSE Composite
China's alpha also tightened after the data-quality filter, dropping from +7.18% to +4.33% over the SSE Composite. The local index returned just 2.43% CAGR over this period. The 51.9% max drawdown is among the worst of any exchange tested, but the alpha against local equities is substantial.
China's A-share market is retail-dominated. Value signals work differently here. The OE Yield screen catches state-owned enterprises trading at low valuations, and while the volatility of Chinese equities is punishing, the strategy still produced meaningful alpha over the local market in most years.
Full analysis: OE Yield on Chinese Stocks (SHH+SHZ)
Japan (JPX): 5.93% CAGR, +2.61% vs Nikkei 225
Japan flips from underperformer (-1.92% vs SPY) to a modest outperformer (+2.61% vs the Nikkei 225). The Nikkei returned 3.31% CAGR over the period, so the OE Yield portfolio's 5.93% ran ahead of the local index by about 2.6 percentage points. The universe is large (28.0 avg stocks, the highest of any exchange), so depth isn't the problem. The -54.3% max drawdown is the second worst of all 14 exchanges. Japan's value trap problem is well documented: cross-shareholdings, poor capital allocation, entrenched management. But measured against the local market, the OE Yield screen at least avoided the worst of it.
Switzerland (SIX): 3.67% CAGR, +1.92% vs SMI
Switzerland's alpha softened too. The SMI returned 1.74% CAGR over this period. Switzerland has the smallest average portfolio (13.2 stocks) of any exchange. Nestle, Roche, Novartis, and the banking giants rarely pass the OE Yield > 5% filter because they're too expensive. What remains is a thin set of Swiss industrials and specialty companies. Zero cash periods, but a brutal -61.2% drawdown and only +1.92% alpha make this one of the weaker outperformers.
South Africa (JSE): 8.66% CAGR, +0.81% vs SPY
JSE produced just +0.81% excess over SPY (no local index available as benchmark). The screen works well on South Africa's consumer, healthcare, and financial franchises. Mining companies mostly fail the margin and ROE filters, leaving a portfolio concentrated in high-quality domestic businesses.
The near-zero Sharpe reflects high local currency volatility and the 9% South African risk-free rate used in the calculation. The 5 cash periods also drag down risk-adjusted metrics.
Taiwan: 4.52% CAGR, +0.43% vs TAIEX
Taiwan is a marginal winner against the TAIEX. The strategy works, but barely. Taiwan still has the best drawdown profile of any exchange tested: -20.5%. The screen selects Taiwanese electronics manufacturers and semiconductor supply chain companies with high margins and moderate valuations. 5 cash periods and a universe that rarely fills 30 positions limit absolute performance.
The Underperformers: Four Markets Below Their Local Benchmark
Israel (TLV): 6.24% CAGR, -1.61% vs SPY
Israel underperforms SPY by a small margin (no local index available as benchmark). The 7 cash periods (28% of the backtest) are the primary drag. Israel's exchange is smaller, and many of its best companies dual-list on NASDAQ, pulling them out of the TLV universe. The -29.5% max drawdown is moderate. When the screen finds stocks, they hold up well. There just aren't always enough of them.
Saudi Arabia (SAU): 3.63% CAGR, -4.22% vs SPY
Saudi Arabia's stock exchange only opened to foreign investors in 2015. The earlier years of the backtest have limited coverage. 7 cash periods (28%) and a 0.007 Sharpe reflect a market where the OE Yield signal doesn't yet have enough depth or history to generate consistent alpha. No local index available, so SPY is the benchmark.
Korea (KSC): 4.15% CAGR, -1.20% vs KOSPI
Korea's market is dominated by Samsung, Hyundai, LG, and SK Group subsidiaries. Many of these are capital-intensive with complex cross-holdings that compress ROE below the 10% threshold. What passes the screen are smaller companies that lack the liquidity and institutional interest to drive price discovery. 7 cash periods and a 0.062 Sharpe tell the story. The KOSPI returned 5.35% CAGR, so even the local benchmark beats the screen.
Thailand (SET): 4.49% CAGR, -0.64% vs SET Index
Thailand is a near-miss against its local benchmark. The SET Index returned 5.13% CAGR. The Thai market has a large number of listed companies, but many are family-controlled businesses with low transparency. The OE Yield screen selects what passes the quality filters, but the valuation signal doesn't translate into forward returns in this market.
Excluded Exchanges
We tested seven additional exchanges but excluded them from the final comparison due to data quality issues that the filter couldn't fully resolve:
| Exchange | Issue |
|---|---|
| OSL (Norway) | 44% cash periods. Universe too thin for meaningful comparison. |
| XETRA (Germany) | adjClose split artifacts in multiple stocks (DAP.DE, EL45.DE) survive the filter. |
| TSX (Canada) | adjClose split artifacts (SGU.V) survive the filter. |
| SAO (Brazil) | adjClose split artifacts across multiple tickers. |
| ASX (Australia) | adjClose split artifacts across the universe. |
| PAR (France) | Pipeline gap. Too few fundamental data rows for reliable screening. |
| SGX (Singapore) | 0 symbols in the profile table. |
The split artifact problem deserves explanation. FMP's adjusted close prices sometimes fail to account for stock splits correctly. When a stock splits 10:1, the historical price should be divided by 10. If it isn't, a $5 stock suddenly looks like it returned 900% in one year. The data-quality filter we added catches single-period returns above 200%, which removed the LSE 2010 artifact and let the UK enter the comparison. For XETRA, TSX, SAO, and ASX, the artifacts persist below that threshold, so we keep them excluded.
Key Patterns Across Markets
Measuring against the right benchmark changes the picture
Local benchmarks isolate the strategy's actual contribution. Japan, Switzerland, and Taiwan would each look like SPY underperformers in dollar terms, but each generates positive alpha against its own local index. The SPY comparison mixes currency depreciation with stock selection. Local benchmarks tell the cleaner story.
Universe size doesn't predict performance
Japan has the deepest universe (28.0 avg stocks) and one of the worst drawdowns. Switzerland has one of the thinnest (13.2) and still produces +1.92% alpha vs its local index. The UK is even thinner (13.7) and produces +7.49% alpha. India (26.1) and the US (21.3) both outperform despite different portfolio sizes. The signal's strength matters more than the number of stocks it finds.
Emerging markets deliver more absolute return, developed markets deliver more risk-adjusted return
India (+3.41% vs Sensex), China (+4.33% vs SSE Composite), and Hong Kong (+3.60% vs Hang Seng) produced meaningful alpha against local benchmarks, but with deeper drawdowns. Sweden (0.389 Sharpe) and the US (0.342) delivered the best risk-adjusted performance. There's a tradeoff between absolute alpha and smoothness. Emerging market alpha comes with wider drawdowns and more volatile year-to-year returns.
Drawdowns vary wildly
The spread between the shallowest and deepest max drawdown is 41 percentage points. Taiwan (-20.5%) vs Switzerland (-61.2%). This isn't a function of the strategy. It's a function of the market. OE Yield inherits the tail risk of whatever exchange it runs on. Investors should size positions based on the max drawdown of the specific market, not the global average.
Cash periods signal trouble
Exchanges with 7 cash periods (Israel, Saudi Arabia, Korea) all underperform their benchmarks. When the screen can't find 10 qualifying stocks in more than a quarter of rebalance dates, the universe is too thin or the market structure doesn't produce enough high-quality value names. Cash drag alone doesn't explain the underperformance, but it correlates with it.
Currency Note
The "Excess vs Local" column in the table is currency-neutral. Both the portfolio and the benchmark are denominated in the same local currency, so exchange rate movements cancel out. This is the honest measure of whether the screen adds value on a given exchange.
For three exchanges (JSE, TLV, SAU), no reliable local index was available. These fall back to SPY, meaning currency effects remain embedded in their results. South Africa is the most affected: the ZAR depreciated roughly 5% annually vs USD, so JSE's +0.81% excess over SPY may overstate the dollar-adjusted alpha.
What This Means for Investors
OE Yield is a global signal. It works on exchanges with very different market structures, from India's growth-oriented mid-cap universe to Sweden's quality-industrial complex to the UK's defensive consumer-and-financials market. The mechanism is consistent: screen for businesses that generate high owner earnings relative to their price, confirm quality with ROE and margin filters, and hold.
Ten of 14 exchanges beat their local benchmark. Three of those wins are below 1 percentage point (South Africa, Taiwan) and shouldn't be over-interpreted. The strongest results are the UK (+7.49% vs FTSE 100), Sweden (+6.95% vs OMX30), China (+4.33% vs SSE Composite), India (+3.41% vs Sensex), and Hong Kong (+3.60% vs Hang Seng). These five exchanges combine meaningful alpha with reasonable portfolio depth.
Four markets still underperform: Korea, Thailand, Israel, and Saudi Arabia. Korea's chaebol concentration, Thailand's low transparency, and thin universes in Israel and Saudi Arabia all limit the screen's effectiveness.
The other key takeaway: the absolute returns are lower than older runs of this backtest implied. Tighter data-quality filters catch penny-stock and split-adjustment artifacts that had inflated headline CAGRs. The US dropped from 12.25% to 9.22%. Hong Kong dropped from 10.44% to 5.24%. The alpha is real, but more modest than the first reading suggested.
Part of a Series
This comparison covers the full set of exchanges we tested. Dedicated deep-dives with year-by-year returns, screen SQL, and detailed analysis:
- OE Yield on US Stocks: 9.22% CAGR, +1.4% vs S&P 500
- OE Yield on Indian Stocks (NSE): 15.47% CAGR, +3.4% vs Sensex
- OE Yield on UK Stocks (LSE): 8.72% CAGR, +7.5% vs FTSE 100
- OE Yield on Hong Kong Stocks (HKSE): 5.24% CAGR, +3.6% vs Hang Seng
- OE Yield on Swedish Stocks (STO): 9.51% CAGR, +7.0% vs OMX30
- OE Yield on Chinese Stocks (SHH+SHZ): 6.76% CAGR, +4.3% vs SSE Composite
Run This Screen Yourself
The backtest code is open source. Clone the repo, configure your API key, and run any exchange:
git clone https://github.com/ceta-research/backtests.git
cd backtests
pip install -r requirements.txt
python owner-earnings/backtest.py --preset us
Or run the live screen on any exchange via the web UI: cetaresearch.com/data-explorer
Get your API key at cetaresearch.com.
References
- Buffett, W. (1986). "Berkshire Hathaway Annual Letter to Shareholders."
- Greenwald, B., Kahn, J., Sonkin, P. & van Biema, M. (2001). Value Investing: From Graham to Buffett and Beyond. John Wiley & Sons.
- Greenblatt, J. (2006). The Little Book That Beats the Market. John Wiley & Sons.
- Fama, E. & French, K. (1998). Value versus Growth: The International Evidence. Journal of Finance.
Data: Ceta Research, FMP financial data warehouse. 14 exchanges, 25-year backtest (2000-2025). Annual rebalance (July), equal weight top 30, MOC execution. Transaction costs included. Data-quality filter applied: skip entries below $1 or single-period returns above 200%. Local benchmarks where available, SPY (7.85% CAGR) as fallback.
Past performance does not guarantee future results. This is educational content, not investment advice.


