quantitative-research
Revenue Market Share Gainers in India: Good Returns, Not Alpha
India is the only market where gaining sector-relative revenue share consistently outperforms. 11.8% CAGR, +4% excess over SPY, 60% win rate across 25 years.
quantitative-research
India is the only market where gaining sector-relative revenue share consistently outperforms. 11.8% CAGR, +4% excess over SPY, 60% win rate across 25 years.
quantitative-research
Canadian market-share gainers returned 6.7% annually with the shallowest drawdown of any exchange tested (-26.6%). The signal underperforms the benchmark but offers unusually good downside protection.
quantitative-research
UK market-share gainers returned 5.6% annually, beating SPY in 13 of 25 years. The strategy stays fully invested but underperforms by 2.2% annually — similar to Germany but with a meaningfully higher win rate.
quantitative-research
German market-share gainers returned 3.5% annually across 25 years, staying fully invested every period but underperforming by 4.3% annually. The signal finds stocks — it just doesn't find outperformers.
quantitative-research
Swiss market-share gainers have the highest Sharpe ratio of any exchange (0.337), lower volatility than the benchmark, and still return 1.4% annually less than the S&P 500. Low-volatility markets produce cleaner factor signals but smaller absolute gains.
quantitative-research
We backtested sector-relative revenue growth as a stock screen across 15 exchanges from 2000 to 2024. India outperformed by 4% annually. Every other market underperformed. Here's what explains the difference.
global stocks
We reran the R&D efficiency screen across 10 exchanges with local benchmarks. UK beats FTSE 100 (price return) by +7.22% annually — the strongest result globally. India, previously the standout vs SPY, now underperforms the Sensex by 4.65pp. Local benchmarks change everything. Pharma-heavy...
india stocks
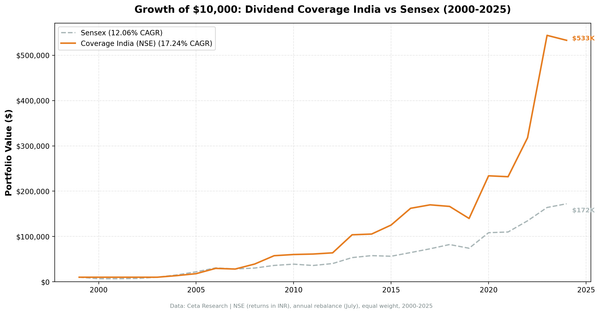
The R&D efficiency screen on NSE-only sits in cash for 56% of years. When invested (2014-2024), it produced volatile results with two spectacular years (2014 +58% vs Sensex, 2023 +91% vs Sensex). But the 25-year CAGR of 7.41% trails the Sensex''s 12.06%. The screen finds India''s best pharma and...
uk stocks
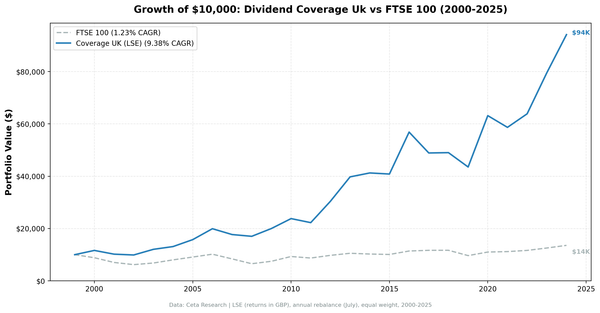
The UK R&D efficiency screen returned 8.45% CAGR over 25 years. The FTSE 100 price index returned 1.23%. That is +7.22% annual excess, the strongest result across 10 global markets. Max drawdown was -17.26%. Returns in GBP. Benchmark caveat: FTSE 100 is price-return only.
r&d
From 2000 to 2012, buying stocks with the highest gross profit per R&D dollar beat the S&P 500 consistently. Then mega-cap tech took over, and the strategy spent the next twelve years giving money back. 25-year backtest, full data, SQL included.
small cap
Canadian small-cap growth stocks returned 8.28% CAGR over 25 years, +0.43%/yr vs SPY but +4.33%/yr vs TSX Composite. The strategy turned $10,000 into $72,733 with a 64% win rate against the local benchmark.
small cap
Chinese small-cap growth stocks generated +7.76%/yr excess over the SSE Composite, turning $10K into $129,070. The alpha is real, but so is the -72% max drawdown and two A-share bubble years that drove most of the outperformance.