backtests
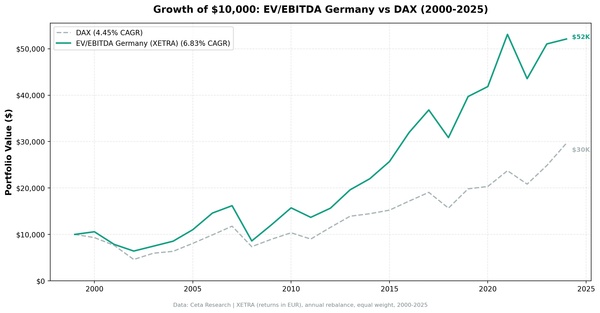
EV/EBITDA Value Backtest: Germany (XETRA), 2000-2024
EV/EBITDA screening on XETRA: 6.83% CAGR vs 4.45% for the DAX. A 2.38% annual edge against the local index with a 68% win rate.

backtests
EV/EBITDA screening on XETRA: 6.83% CAGR vs 4.45% for the DAX. A 2.38% annual edge against the local index with a 68% win rate.
backtests
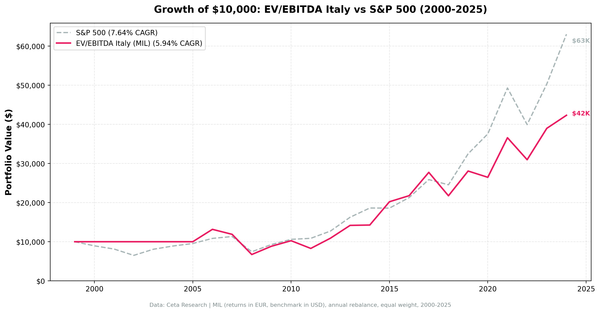
EV/EBITDA screen on Borsa Italiana returned 5.94% CAGR over 25 years, trailing SPY's 7.64%. Thin universe and six cash years. The strategy doesn't justify the complexity over a simple index fund.
value-investing
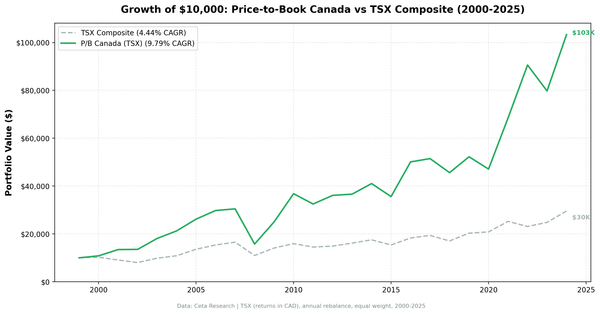
Canada's TSX returned 9.79% CAGR on a low P/B screen over 25 years, +5.36% annual excess vs the TSX Composite. In 2022, the portfolio gained +32% while the TSX fell -8%, the largest annual spread across all 17 exchanges we tested.
dividend investing
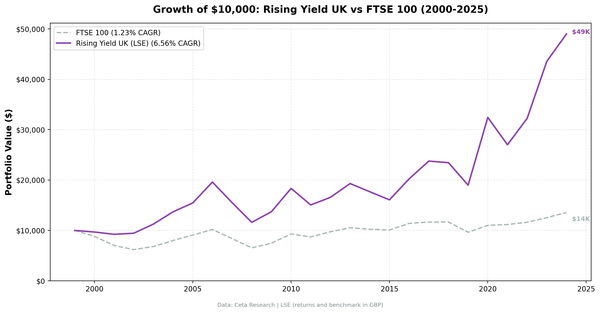
Rising dividend yield on LSE: 6.56% CAGR, +5.34% annual alpha vs FTSE 100. The strategy works as a UK stock selector. Sharpe of 0.139 and -40.80% max drawdown are the honest costs.
dividend investing
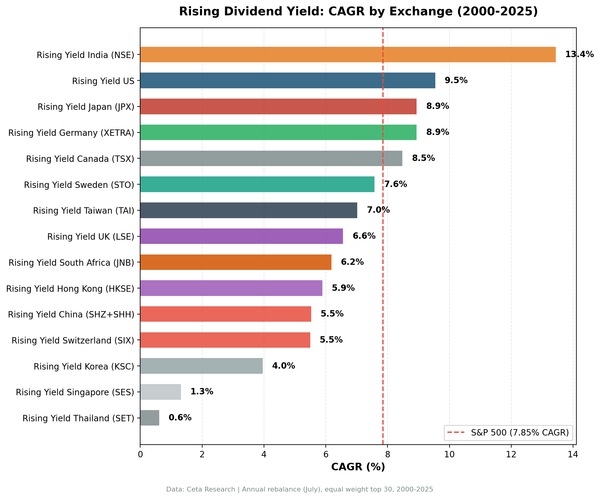
We ran the same rising dividend yield screen on 15 global exchanges from 2000 to 2025. India produced 13.44% CAGR with the lowest drawdown. Five exchanges beat SPY. The signal works where dividend growth is a deliberate management decision.
dividend investing
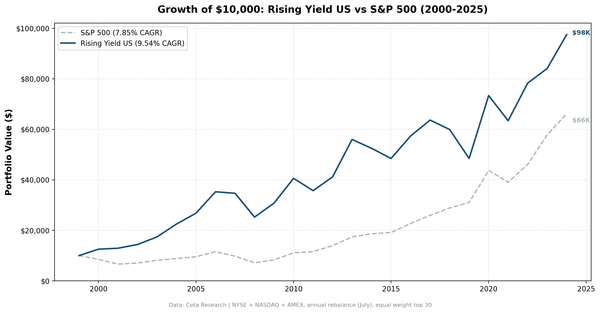
We screened for stocks with 3 consecutive years of rising dividend yield driven by dividend growth, then backtested on all US exchanges from 2000 to 2025. 9.54% CAGR, +1.69% alpha, zero cash periods.
dividend investing
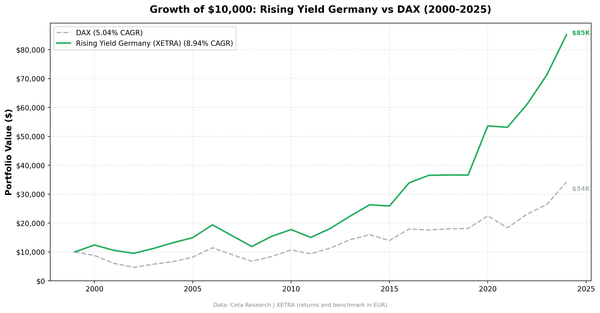
Rising dividend yield on XETRA returned 8.94% annually from 2000 to 2025 with zero cash periods, +3.90% annual alpha vs the DAX. Germany's industrial economy consistently produced dividend growers across all 25 years.
dividend investing
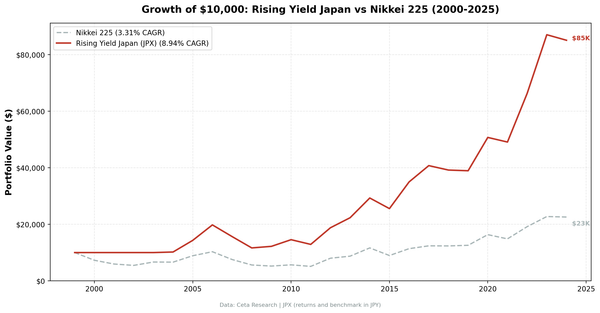
Japan produced the highest Sharpe (0.43) and Sortino (1.168) of any market we tested the rising yield strategy on. 8.94% CAGR, +5.63% annual alpha vs Nikkei 225, a 72% win rate, with explosive individual years and early cash periods.
dividend investing
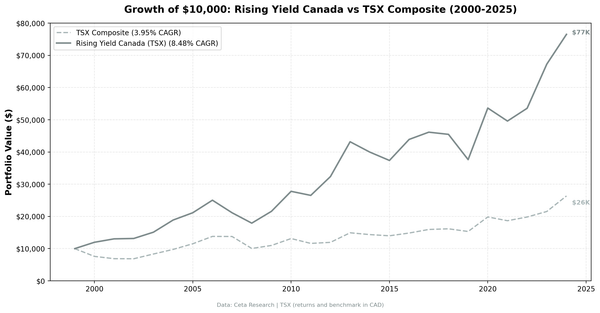
We applied the rising dividend yield screen to 25 years of TSX data. 8.48% CAGR, +4.53% annual alpha vs TSX Composite, zero cash periods, and lower volatility than the US version. Canada's resource and financial sectors are natural dividend growers.
dividend investing
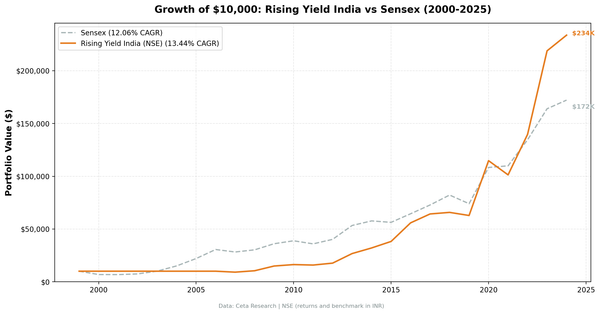
Rising dividend yield on NSE returned 13.44% annually from 2000 to 2025 with a -11.71% max drawdown, +1.38% excess vs Sensex. The best risk-adjusted returns of any market we tested. Returns in INR.
analyst ratings
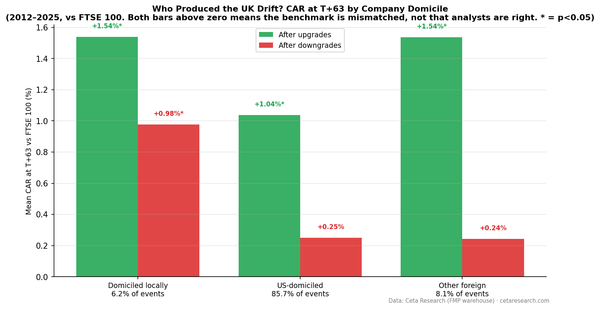
We reported +1.09% upgrade drift against the FTSE 100 on LSE stocks. Then we checked the universe: 85.7% of the events are US-domiciled companies and only 6.2% are British. For UK companies the one-month drift is 0.008%, which is zero. This is the correction.
analyst ratings
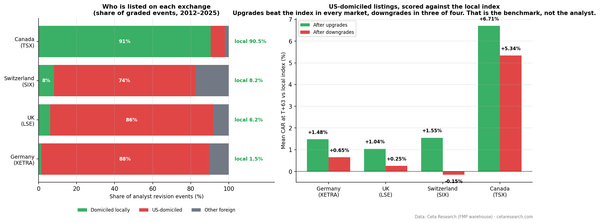
We measured 180,658 analyst revisions across five markets and found European upgrade drift that looked strong. It was foreign secondary listings scored against a local index: XETRA is 88% US-domiciled, the LSE 86%. The tell was that downgraded stocks also beat the index.