
Rising Dividend Yield on Indian Stocks: 13.44% CAGR With a -11.71% Max Drawdown
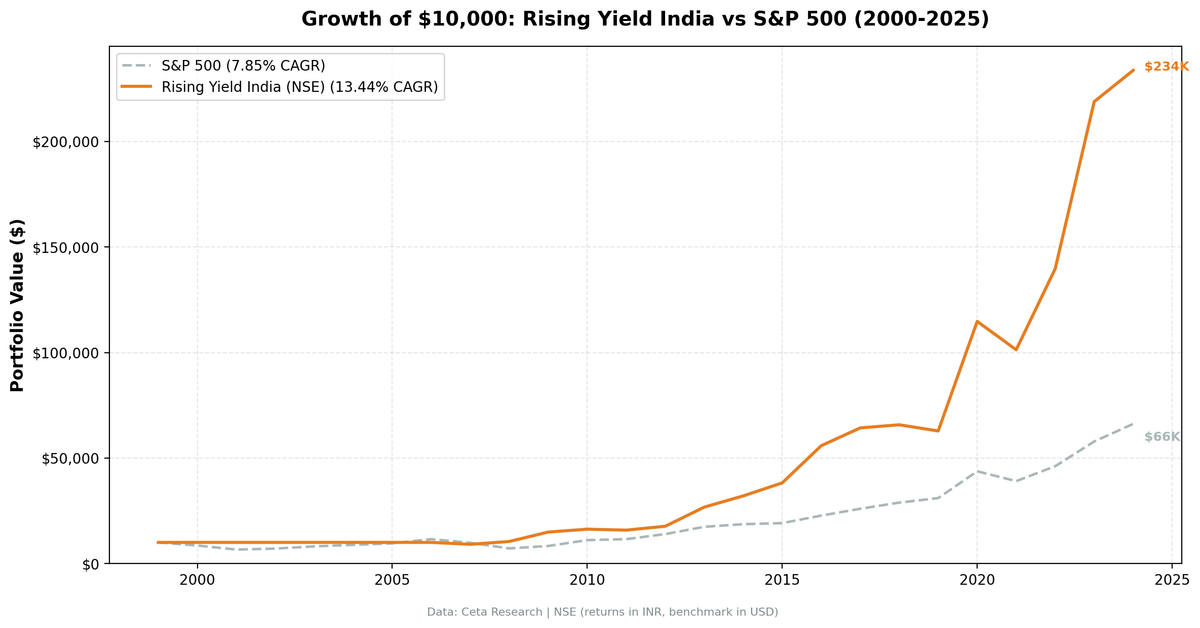
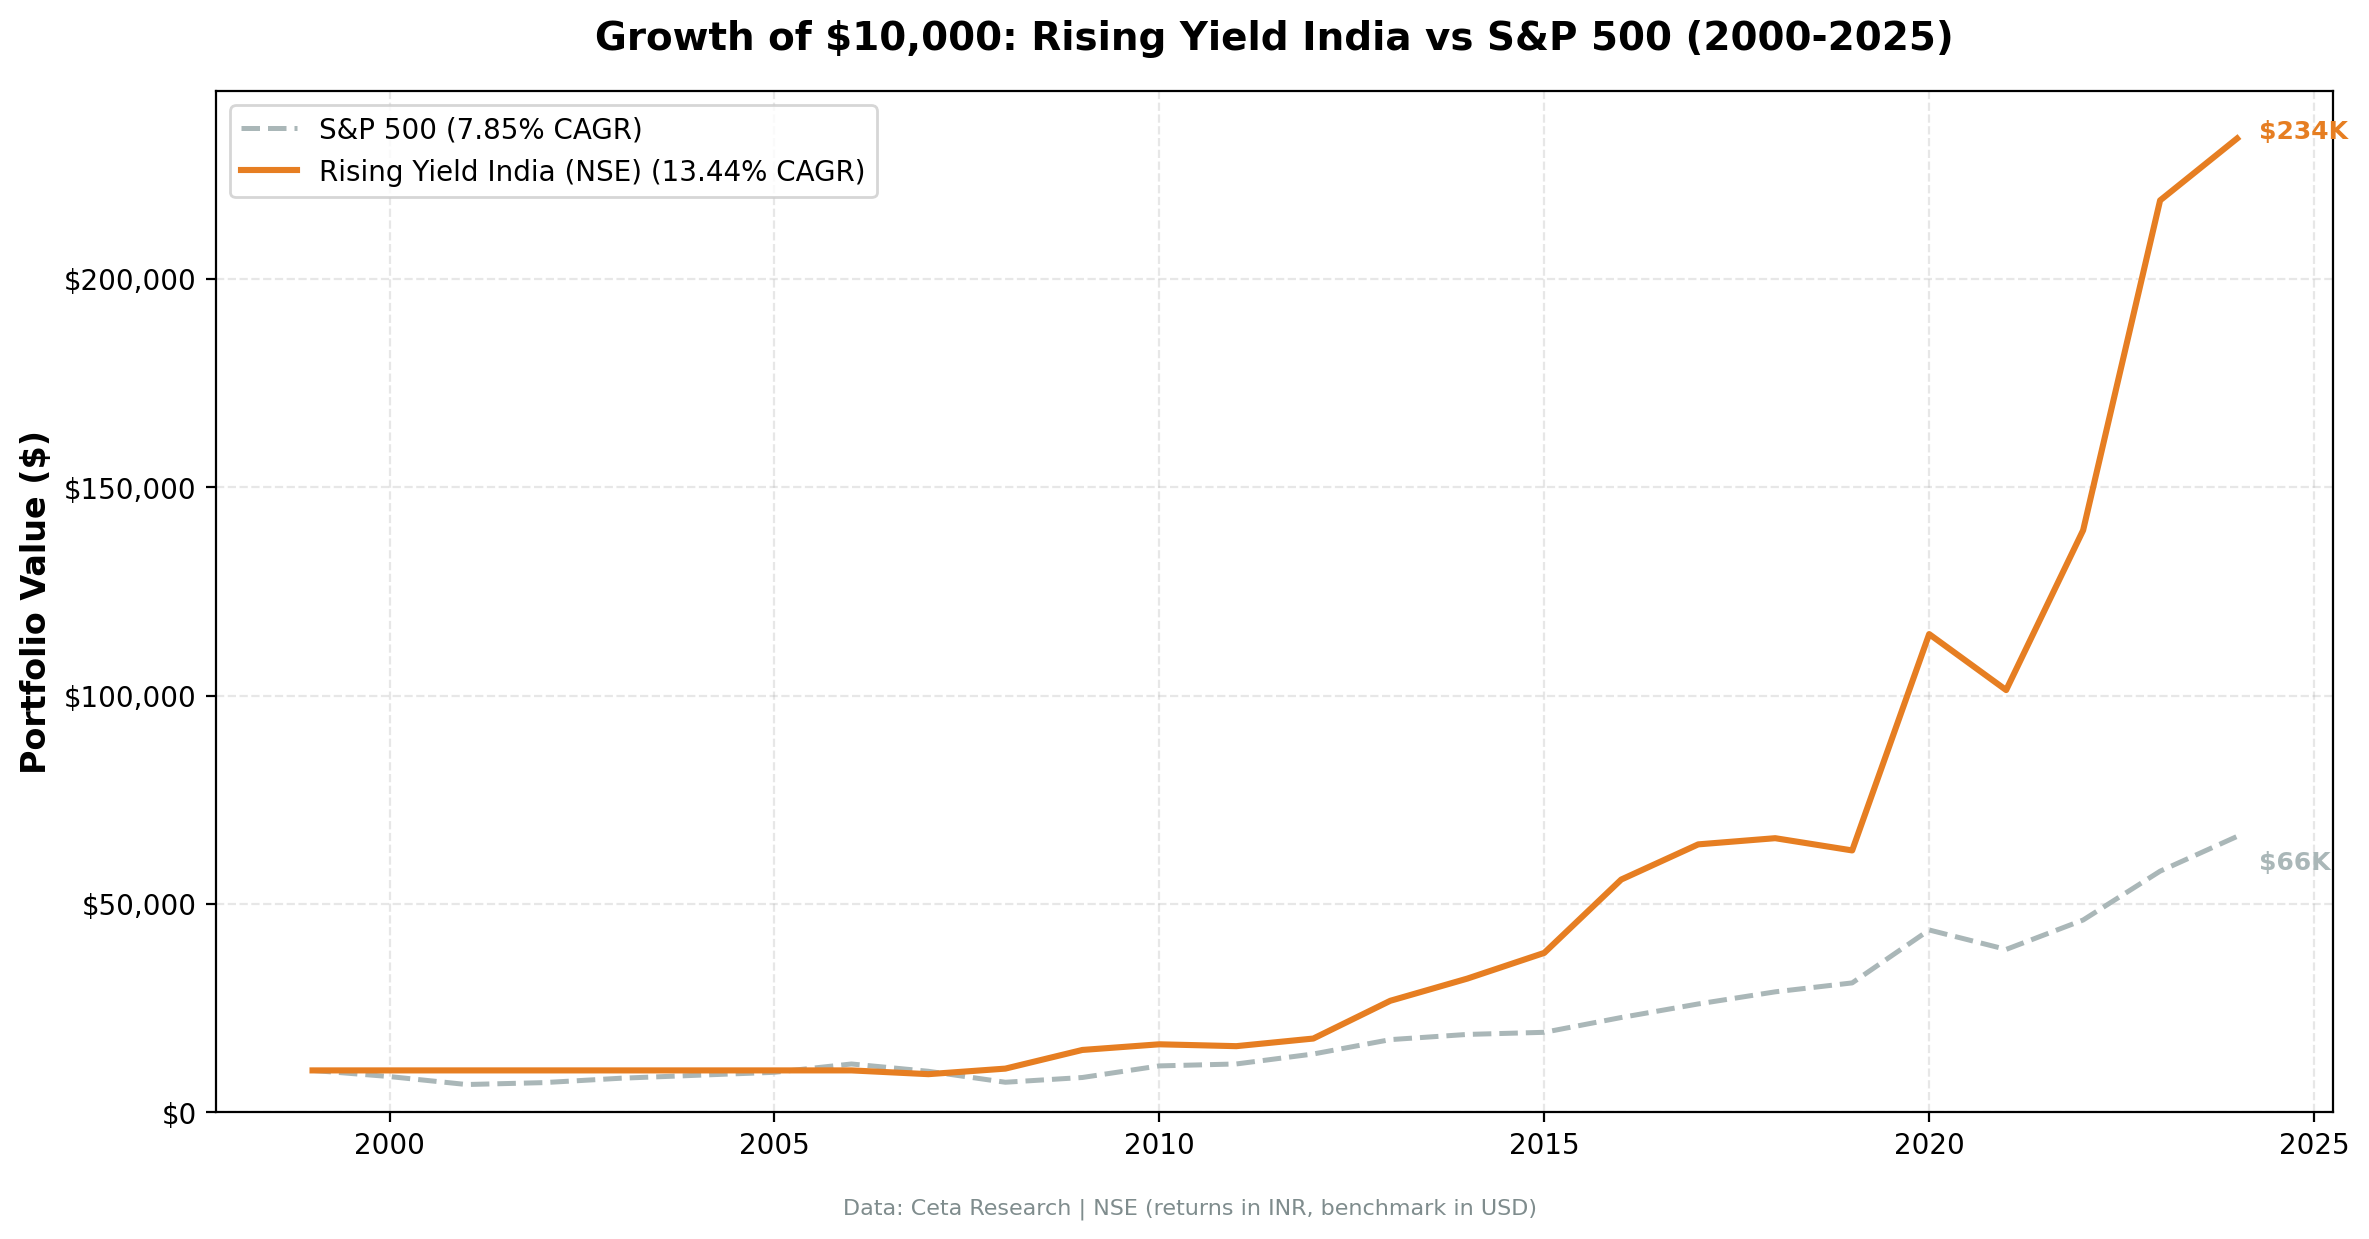
Rising dividend yield on NSE returned 13.44% annually from 2000 to 2025 with a -11.71% max drawdown, +1.38% excess vs Sensex. The best risk-adjusted returns of any market we tested. Returns in INR.

We ran the rising dividend yield screen on NSE stocks from 2000 to 2025. The portfolio returned 13.44% annually vs 12.06% for the Sensex, with a max drawdown of just -11.71%. That drawdown number is the real headline. In a market known for violent swings, a strategy built on steady dividend growers produced the shallowest peak-to-trough decline of any exchange we tested. India is the standout market for this signal.
Contents
- Method
- The Screen (SQL)
- What We Found
- 25 years of data. +1.38% annual alpha over the Sensex.
- Year-by-year returns
- Key Observations
- 2000-2006: Seven years of cash
- 2008: Crisis resilience
- 2009: The recovery compounded
- The explosive years: 2013, 2016, 2020, 2023
- The worst invested year: 2021
- Currency and Benchmark Notes
- Why India Stands Out
- Limitations
- Takeaway
- Part of a Series
- References
- Run This Screen Yourself
Data: FMP financial data warehouse, 2000–2025. Updated March 2026.
Method
Data source: Ceta Research (FMP financial data warehouse) Universe: NSE, market cap > ₹20B (~$240M USD) Period: 2000-2025 (25 years, 25 annual periods) Signal: 3 consecutive FY years of rising dividendYield, driven by DPS growth (not price decline) Quality filters: ROE > 10%, Payout < 75% Portfolio: Top 30 by 2-year yield expansion, equal weight Rebalancing: Annual (July) Cash rule: Hold cash if fewer than 10 stocks qualify Benchmark: Sensex (INR, local benchmark) Transaction costs: Size-tiered (0.1-0.5% one-way)
For the full methodology and signal construction, see the main US Rising Yield post.
The Screen (SQL)
WITH yearly_yield AS (
    SELECT r.symbol, r.date, r.fiscalYear AS yr,
        r.dividendYield, r.dividendPerShare, r.dividendPayoutRatio,
        LAG(r.dividendYield, 1) OVER (PARTITION BY r.symbol ORDER BY r.fiscalYear) AS yield_1yr,
        LAG(r.dividendYield, 2) OVER (PARTITION BY r.symbol ORDER BY r.fiscalYear) AS yield_2yr,
        LAG(r.dividendPerShare, 1) OVER (PARTITION BY r.symbol ORDER BY r.fiscalYear) AS dps_1yr,
        LAG(r.dividendPerShare, 2) OVER (PARTITION BY r.symbol ORDER BY r.fiscalYear) AS dps_2yr
    FROM financial_ratios r
    WHERE r.period = 'FY' AND r.dividendYield > 0
),
screened AS (
    SELECT y.symbol, y.date, y.yr,
        y.dividendYield, y.dividendPerShare, y.dividendPayoutRatio,
        (y.dividendYield - y.yield_2yr) AS yield_change_2yr,
        CASE
            WHEN y.dividendPerShare > y.dps_1yr AND y.dps_1yr > y.dps_2yr THEN 'Consecutive DPS Growth'
            WHEN y.dividendPerShare > y.dps_1yr THEN 'Partial DPS Growth'
            ELSE 'Price Decline Driver'
        END AS yield_driver
    FROM yearly_yield y
    WHERE y.yield_2yr IS NOT NULL
      AND y.dividendYield > y.yield_1yr AND y.yield_1yr > y.yield_2yr
      AND y.dividendPerShare > y.dps_1yr
      AND y.dividendPayoutRatio > 0 AND y.dividendPayoutRatio < 0.75
      AND y.dividendYield < 0.25  -- drop data-artifact yields (funds, mis-annualized specials)
    QUALIFY ROW_NUMBER() OVER (PARTITION BY y.symbol ORDER BY y.date DESC) = 1
)
SELECT s.symbol, p.companyName,
    ROUND(s.dividendYield * 100, 2) AS yield_pct,
    ROUND(s.yield_change_2yr * 100, 2) AS yield_expansion_2yr_pct,
    s.yield_driver,
    ROUND(s.dividendPayoutRatio * 100, 1) AS payout_pct,
    ROUND(k.returnOnEquityTTM * 100, 1) AS roe_pct,
    ROUND(k.marketCap / 1e9, 1) AS market_cap_b
FROM screened s
JOIN key_metrics_ttm k ON s.symbol = k.symbol
JOIN profile p ON s.symbol = p.symbol
WHERE k.returnOnEquityTTM > 0.10
  AND k.marketCap > 20e9  -- ₹20B (~$240M USD)
  AND p.exchange = 'NSE'
  AND p.isFund = false AND p.isEtf = false AND p.isActivelyTrading = true
ORDER BY s.yield_change_2yr DESC
LIMIT 30
Run this query on Ceta Research
What We Found
25 years of data. +1.38% annual alpha over the Sensex.
| Metric | Rising Yield (INR) | Sensex (INR) |
|---|---|---|
| CAGR | 13.44% | 12.06% |
| Total Return | 2,237% | 1,622% |
| Volatility | 23.97% | 19.80% |
| Max Drawdown | -11.71% | -32.20% |
| Sharpe Ratio | 0.289 | 0.281 |
| Sortino Ratio | 1.049 | 0.581 |
| Calmar Ratio | 1.147 | 0.375 |
| Beta | 0.485 | - |
| Alpha | 1.38% | - |
| Win Rate (annual) | 64% | - |
| Avg Stocks per Period | 26.7 | - |
| Cash Periods | 7 of 25 | - |
| Invested Periods | 18 of 25 | - |
The strategy turned ₹10,000 into roughly ₹234,000, vs ₹172,000 for the Sensex. The 13.44% CAGR includes seven cash years at 0% return. Active-period returns are higher.
The max drawdown is the standout: -11.71%. The Sensex's worst drawdown was -32.20%. Indian dividend growers avoided the deep crashes that characterize emerging markets. The Calmar ratio (1.147) is the best of any exchange we tested, meaning the strategy delivered the most return per unit of drawdown risk.
The beta of 0.485 confirms the portfolio isn't just riding the market. It captures upside while protecting downside. The Sensex benchmark returned 12.06% over this period, reflecting India's strong equity market growth. The +1.38% excess shows the dividend growth signal adds value on top of that.
Year-by-year returns
| Year | Rising Yield (INR) | Sensex (INR) | Excess |
|---|---|---|---|
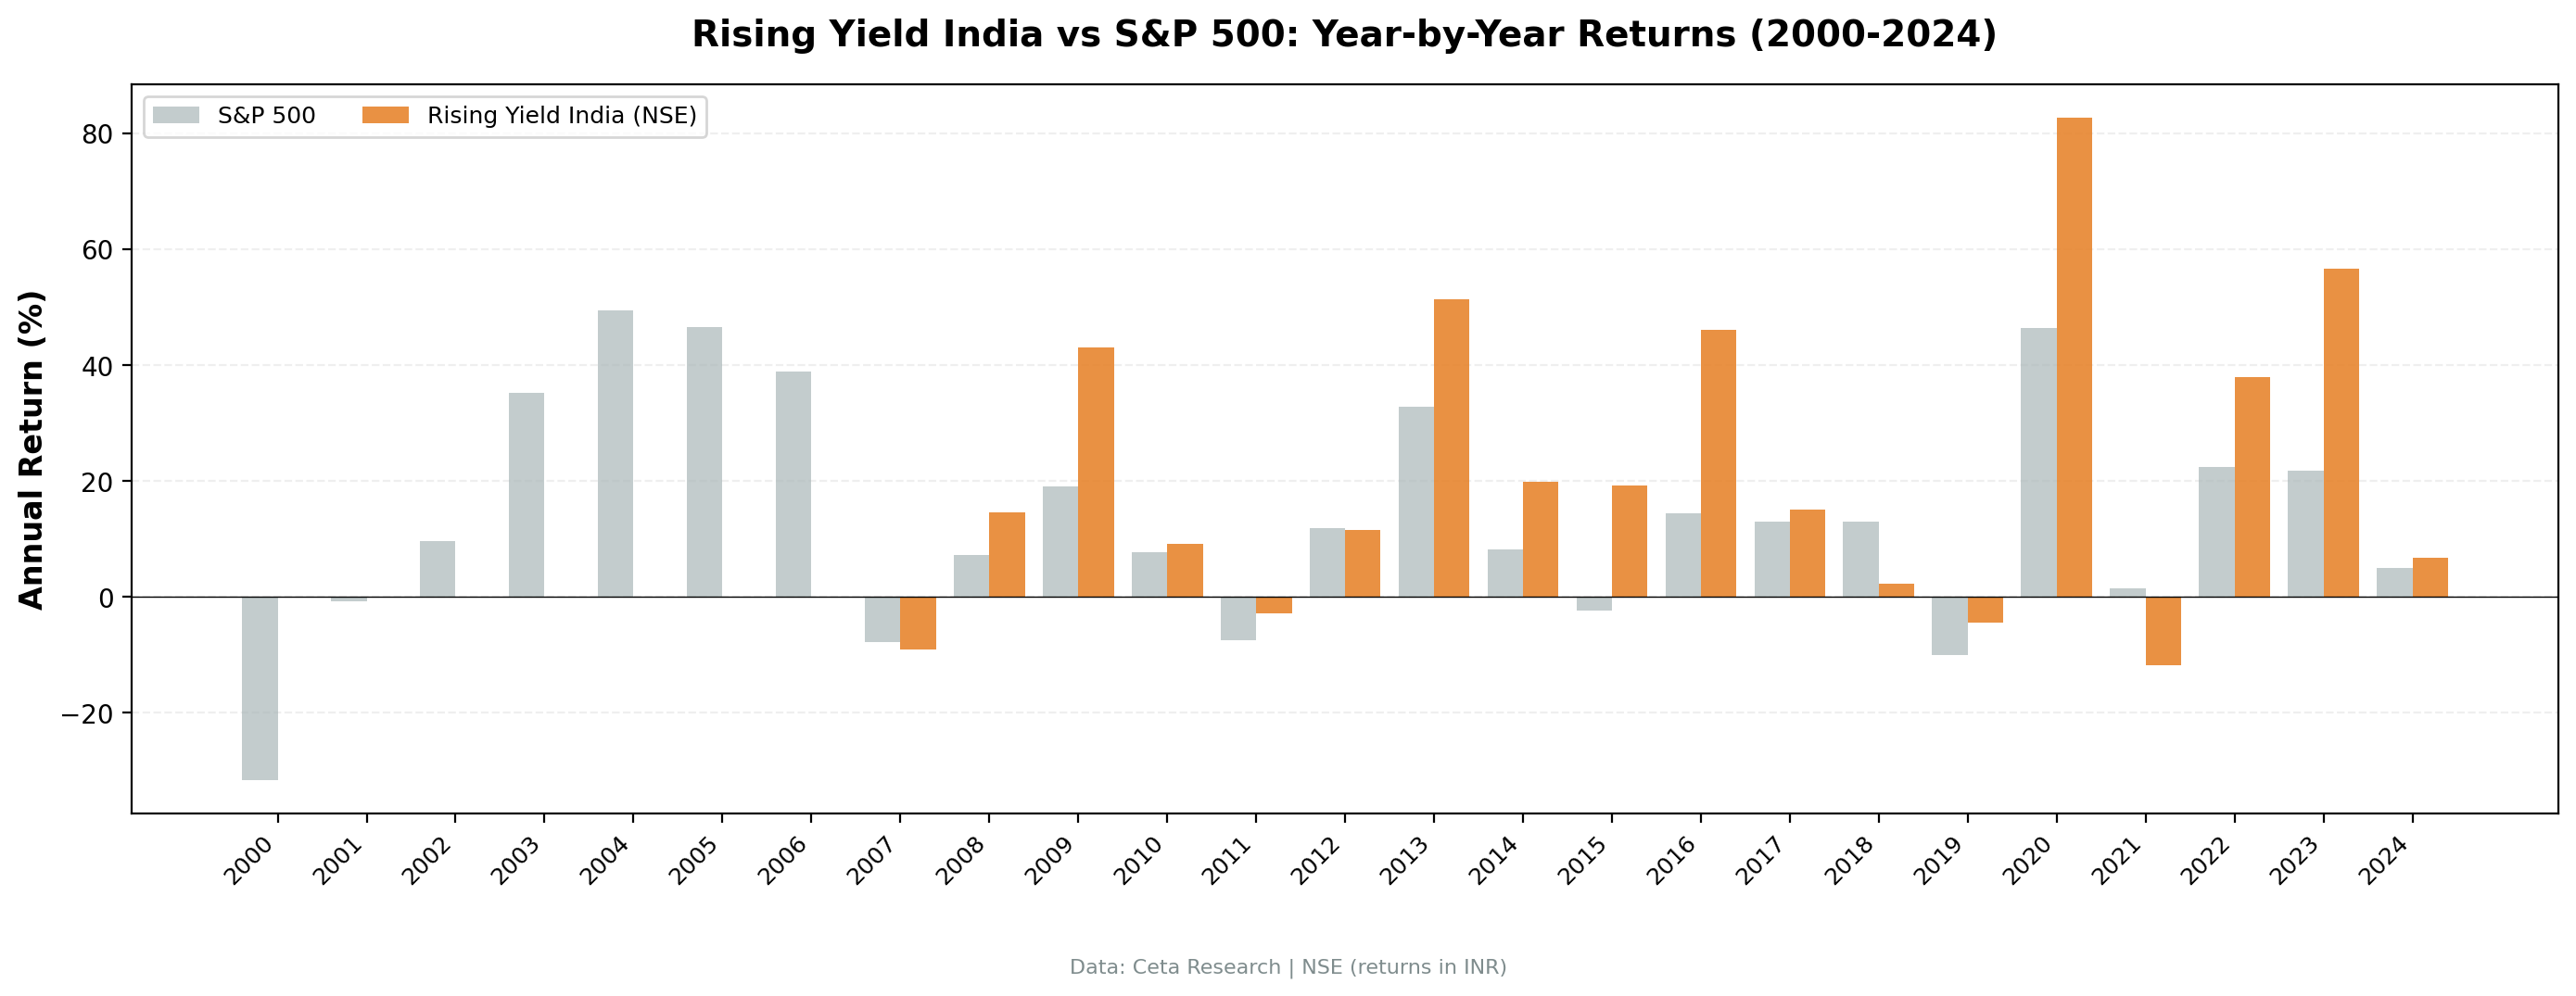
| 2000 | 0.0% (cash) | -31.6% | +31.6% |
| 2001 | 0.0% (cash) | -0.8% | +0.8% |
| 2002 | 0.0% (cash) | +9.6% | -9.6% |
| 2003 | 0.0% (cash) | +35.2% | -35.2% |
| 2004 | 0.0% (cash) | +49.4% | -49.4% |
| 2005 | 0.0% (cash) | +46.5% | -46.5% |
| 2006 | 0.0% (cash) | +38.9% | -38.9% |
| 2007 | -9.0% | -7.7% | -1.3% |
| 2008 | +14.7% | +7.3% | +7.4% |
| 2009 | +43.0% | +19.1% | +23.8% |
| 2010 | +9.1% | +7.8% | +1.4% |
| 2011 | -2.8% | -7.5% | +4.8% |
| 2012 | +11.6% | +11.9% | -0.3% |
| 2013 | +51.4% | +32.8% | +18.6% |
| 2014 | +19.9% | +8.1% | +11.8% |
| 2015 | +19.3% | -2.4% | +21.7% |
| 2016 | +46.1% | +14.4% | +31.6% |
| 2017 | +15.1% | +12.9% | +2.2% |
| 2018 | +2.3% | +12.9% | -10.6% |
| 2019 | -4.5% | -10.0% | +5.5% |
| 2020 | +82.7% | +46.4% | +36.3% |
| 2021 | -11.7% | +1.4% | -13.1% |
| 2022 | +37.9% | +22.5% | +15.4% |
| 2023 | +56.7% | +21.8% | +34.9% |
| 2024 | +6.8% | +5.0% | +1.8% |
Key Observations
2000-2006: Seven years of cash
The strategy couldn't find enough qualifying stocks on NSE for the first seven years. India's dividend culture was still developing. Most large-caps either didn't pay dividends or didn't meet the quality filters. This is honest accounting: the 13.44% CAGR spans all 25 years, including seven years of dead weight. During these cash years, the Sensex surged (2003-2006 saw four consecutive years of +35% to +49% gains), meaning the strategy missed India's early bull market entirely.
2008: Crisis resilience
The portfolio gained 14.7% while the Sensex gained 7.3%. Indian dividend growers outperformed the local market during the GFC. The stocks passing the screen in mid-2007 (the July rebalance) were companies that had grown their dividends for three straight years through 2005-2007. These were cash-generative businesses that held value better than the broader market.
2009: The recovery compounded
+43.0% the year after the GFC, vs +19.1% for the Sensex. The portfolio that outperformed during the crash then captured the recovery. Two years combined: +64% (portfolio) vs +28% (Sensex). That's the quality filter working in both directions.
The explosive years: 2013, 2016, 2020, 2023
Four years returned over 44%. This pattern doesn't exist in US or European markets. India's dividend growers compound aggressively when conditions are right. 2013 (+51.4%) coincided with foreign institutional investor flows into quality Indian names. 2016 (+46.1%) followed demonetization, which favored formalized, well-governed companies. 2020 (+82.7%) was the strongest single year. The pandemic sell-off created a buying opportunity, and Indian dividend growers rebounded with force. 2023 (+56.7%) reflected India's manufacturing push and domestic consumption growth.
The worst invested year: 2021
-11.7% in 2021, while the Sensex gained +1.4%. This was the only year the strategy gave back double digits, and it's the single move behind the -11.71% max drawdown. The screen had loaded up in mid-2020 on dividend growers that then lagged the broader 2021 rally. Even so, an -11.7% worst case over 25 years is exceptional for an emerging market equity strategy, and the portfolio never posted two losing years in a row.
Currency and Benchmark Notes
Returns are in Indian Rupees. The benchmark is also in Rupees (Sensex). The INR/USD rate moved from roughly 46 in 2000 to roughly 84 in 2024, a ~45% decline or about 2.4% annual drag for foreign investors.
For currency-adjusted comparison to US markets:
| Metric | Rising Yield (INR) | Est. USD equiv | S&P 500 (USD) |
|---|---|---|---|
| CAGR | 13.44% | ~11.0% | 7.85% |
| vs Sensex | +1.38% | - | - |
| vs SPY (cross-currency) | ~+5.6% | ~+3.2% | - |
Against the Sensex, the strategy delivered +1.38% annual excess. Against SPY (cross-currency, not adjusted), the portfolio's 13.44% INR return vs SPY's 7.85% USD return appears as +5.6% excess, but this mixes currency effects with stock selection alpha. The honest comparison is vs Sensex: +1.38% annual alpha from the dividend growth signal.
For INR-based investors, the 13.44% CAGR is the realized return. For foreign investors without a currency hedge, subtract ~2.4% annually for rupee depreciation.
Why India Stands Out
India produced the best results of any market we tested for this signal. Three factors drive this.
Dividend culture. Indian companies, particularly those from industrial families, have a strong tradition of growing dividends. The rising yield screen captures this cultural bias directly. Companies that increase payouts for three consecutive years in India tend to keep doing it.
Structural growth. India's nominal GDP grew roughly 10% annually over this period. Companies growing dividends faster than their stock prices were doing it against a backdrop of expanding revenues and profits. The quality filters (ROE > 10%, payout < 75%) ensured we were capturing genuine compounders, not companies distributing capital they couldn't invest.
Lower volatility than the index. The beta of 0.485 vs Sensex shows the portfolio moves less than the market. The -11.71% max drawdown vs Sensex's -32.20% demonstrates downside protection. The 2008 result (+14.7% vs +7.3% for Sensex) and 2009 recovery (+43.0% vs +19.1%) show the strategy selecting companies that compound through stress.
Limitations
Cash drag and missed bull market. 7 of 25 periods were in cash (2000-2006). During these years, the Sensex gained massively (2003-2006 saw annual returns of +35% to +49%). The strategy sat out India's early bull market entirely. Investors with shorter time horizons would have abandoned it before the active returns started.
Currency risk for foreign investors. Returns are in INR. The rupee depreciated ~2.4% annually vs USD. Foreign investors need to account for currency exposure.
Survivorship bias. Exchange membership uses current company profiles, not historical. BSE and NSE compositions were different in the early 2000s. Delisted companies aren't captured.
Market cap filter in INR. The ₹20B threshold (~$240M USD at 2025 rates) is in Indian Rupees. In USD terms, this is lower than the $1B used for US exchanges, reflecting India's different market structure. Some qualifying stocks may have thinner liquidity than their US counterparts.
No taxes modeled. India's Securities Transaction Tax (STT), Dividend Distribution Tax (abolished 2020, replaced with income tax on dividends), and short-term capital gains tax aren't included. These reduce realized returns.
Transaction costs are estimated. We use size-tiered costs (0.1-0.5% one-way), but actual slippage on mid-cap Indian stocks can exceed these estimates, particularly for less liquid mid-cap names.
Takeaway
Rising dividend yield on Indian stocks produced the strongest results of any market we tested. 13.44% CAGR, +1.38% excess vs Sensex, and a max drawdown of just -11.71%. The Calmar ratio (1.147) and Sortino ratio (1.049) confirm the returns weren't bought with excessive risk.
The max drawdown tells the story: -11.71% for the strategy vs -32.20% for the Sensex. Indian dividend growers provided genuine downside protection. Four individual years exceeded +44% returns. The worst invested year was -11.7%. This asymmetry, big upside with contained downside, is what makes India the top market for this signal.
The costs are real. Seven years of cash during India's early bull market (2003-2006 Sensex gains of +35% to +49% were completely missed). Currency depreciation eats 2-3% annually for foreign investors. The strategy requires patience.
For investors with a long time horizon and an allocation to Indian equities, the rising dividend yield screen remains the strongest signal we've found. The +1.38% alpha vs Sensex is modest, but the -11.71% max drawdown is exceptional.
Part of a Series
This analysis is part of our rising dividend yield global exchange comparison: - Rising Yield on US Stocks (NYSE + NASDAQ + AMEX) - 9.54% CAGR, the baseline - Rising Yield on German Stocks (XETRA) - 8.94% CAGR, +3.90% vs DAX - Rising Yield on Canadian Stocks (TSX) - 8.48% CAGR, +4.53% vs TSX - Rising Yield on Japanese Stocks (JPX) - 8.94% CAGR, +5.63% vs Nikkei - Rising Yield on UK Stocks (LSE) - 6.56% CAGR, +5.34% vs FTSE 100 - Rising Yield: 15-Exchange Global Comparison - full comparison table
References
- Campbell, John Y., and Robert J. Shiller. "The Dividend-Price Ratio and Expectations of Future Dividends and Discount Factors." Review of Financial Studies 1, no. 3 (1988): 195-228.
- Cochrane, John H. "The Dog That Did Not Bark: A Defense of Return Predictability." Review of Financial Studies 21, no. 4 (2008): 1533-1575.
Run This Screen Yourself
All metrics used in this analysis (dividendYield, dividendPerShare, ROE, payout ratios) are queryable via SQL on Ceta Research. Filter by exchange (BSE or NSE) and see what passes today.
The full backtest code (Python + DuckDB) is available in our GitHub repository.
Data: Ceta Research, FMP financial data warehouse. Universe: NSE. Annual rebalance (July), equal weight top 30, 2000-2025. Returns in INR. Benchmark: Sensex (local).
Past performance does not guarantee future results. This is educational content, not investment advice.


