
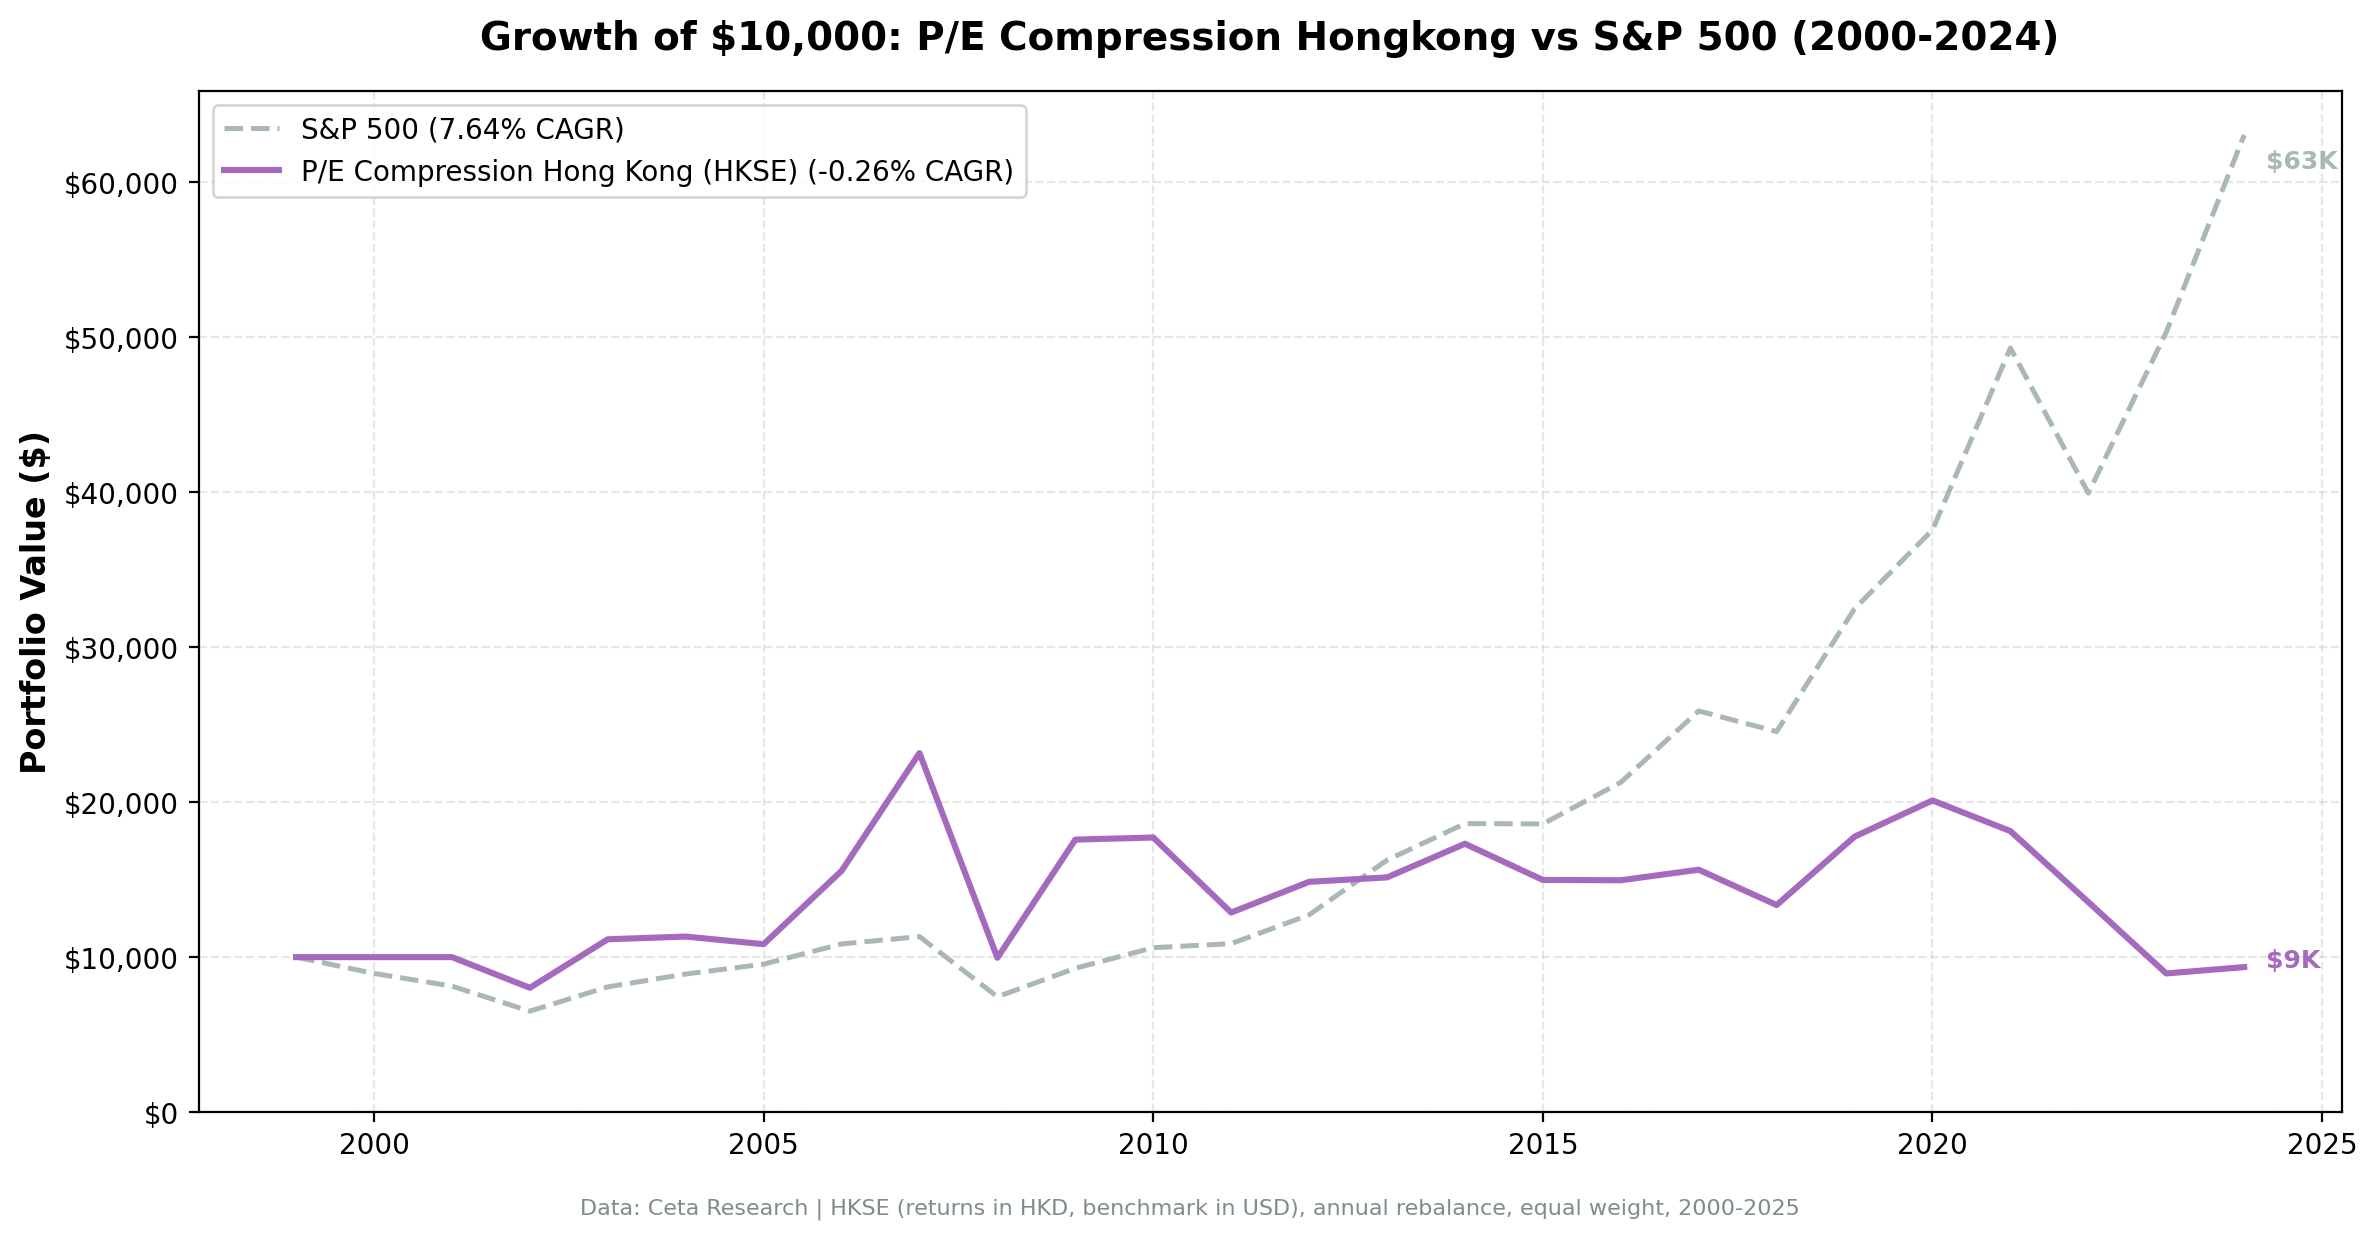
Hong Kong P/E Compression: 133% Down-Capture Amplifies Losses


P/E compression on Hong Kong stocks returns -0.26% CAGR vs 7.64% for SPY, underperforming by 7.91% annually. The worst metric: 133% down-capture. When SPY lost 10%, this portfolio lost 13.3%. The strategy doesn't just fail to protect downside; it actively amplifies losses. This is a clear failure case for P/E compression.
Contents
Method
- Universe: HKSE, market cap > HK$5B
- Period: 2000-2025 (25 years)
- Benchmark: S&P 500 Total Return (SPY, USD)
Returns in HKD. Benchmark in USD.
What We Found
| Metric | Hong Kong | S&P 500 |
|---|---|---|
| CAGR | -0.26% | 7.64% |
| Excess | -7.91% | - |
| Sharpe | -0.114 | 0.322 |
| MaxDD | -61.39% | -34.90% |
| Down-Cap | 132.62% | 100% |
| Avg Stocks | 20.3 | - |
| Cash | 2/25 (8%) | - |
Negative absolute CAGR. Negative Sharpe. Max drawdown nearly double SPY's. 133% down-capture is the worst among all 21 tested markets. This strategy actively increased risk without any return.
Why Hong Kong Is the Worst Performer
China exposure. Hong Kong stocks are heavily exposed to China's economy and policy. Political and regulatory risks create massive volatility that P/E compression can't navigate.
Structural headwinds. Hong Kong experienced property market bubbles, political instability, and capital outflows. Compressed P/E ratios often reflected permanent valuation resets, not temporary dislocations.
Value traps. Many Hong Kong financials and property developers traded at compressed multiples for years because their business models deteriorated. These weren't mean reversion opportunities.
Methodology
- Screen: P/E compression ratio below 0.85 (current P/E at least 15% below 5-year average)
- Quality filters: ROE above 10%, debt-to-equity below 2.0
- Rebalancing: Annual, equal-weight top 30 qualifying stocks
- Period: 25 years of out-of-sample data (2000-2025)
The 133% down-capture ratio is the worst across all 21 tested exchanges. During SPY's -34.9% max drawdown, the Hong Kong portfolio fell -61.4%. The strategy selected value traps that collapsed harder than the broad market.
Run It Yourself
Screen Hong Kong stocks with P/E compression filters on Ceta Research. Market cap threshold: HKD 5B, P/E compression ratio below 0.85, ROE above 10%, D/E below 2.0.
Part of a Series: US +2.32% | UK +1.38% | China -8.32% | India -3.50%
Conclusion
Hong Kong's P/E compression strategy is a clear failure: -0.26% CAGR, -7.91% underperformance, 133% down-capture. The strategy amplifies losses instead of protecting downside. This is what happens when compressed multiples reflect structural problems, not temporary sentiment. Don't force this strategy into unstable markets.
Run It Yourself
Explore the data behind this analysis on Ceta Research. Query our financial data warehouse with SQL, build custom screens, and run your own backtests across 70,000+ stocks on 20 exchanges.
Data: Ceta Research. Returns in HKD. github.com/ceta-research/backtests


