
PEG Ratio in Canada: 9.7% CAGR, +4.6%/yr vs TSX, Zero Cash Periods
Canada's TSX PEG strategy delivered 9.67% CAGR with zero cash periods across 25 years, +4.59%/yr vs the TSX Composite. Next-day close execution, full backtest results and methodology.

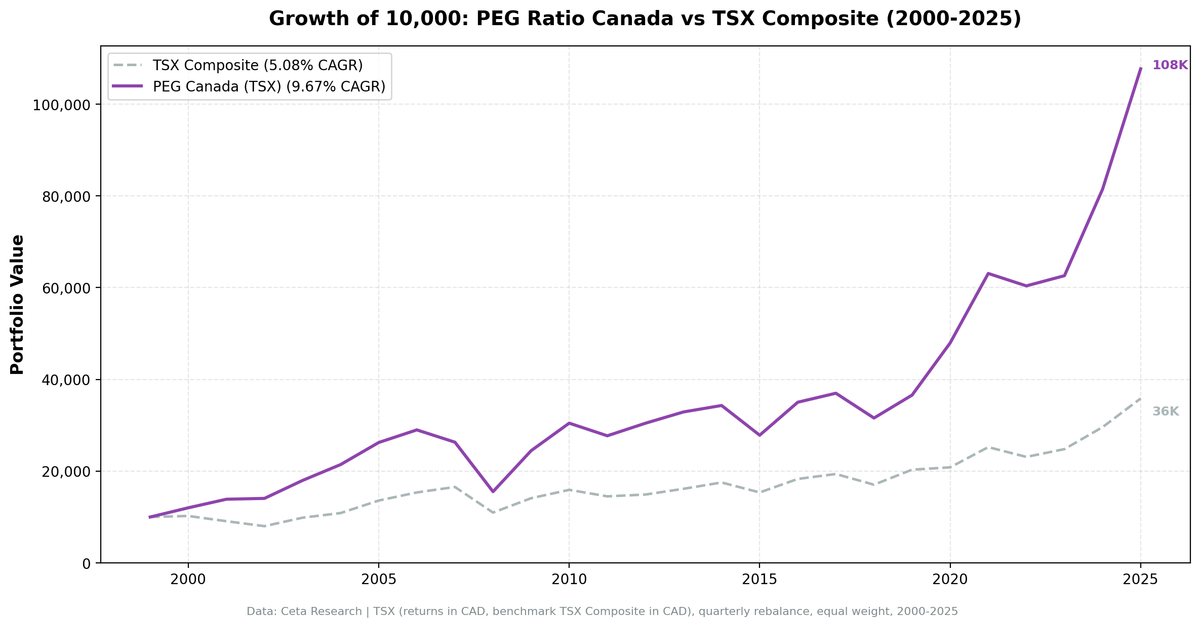
Canada is the most consistently investable PEG ratio market we tested. Zero cash periods across 103 quarters. The portfolio always had 24+ qualifying stocks. 9.67% CAGR vs the TSX Composite's 5.08%, a +4.59%/yr advantage over 25 years.
Contents
- Why Canada Works for GARP
- Methodology
- The Numbers
- The Early Years Were Strong
- Consistent Alpha Over 25 Years
- Zero Cash Periods
- Run It Yourself
- Limitations
- Part of a Series
The Canadian market doesn't get as much attention as India or Sweden in GARP discussions. The data suggests it should.
Data: FMP financial data warehouse, 2000-2025. Updated May 2026.
Why Canada Works for GARP
Canada's stock market structure suits PEG screening. The TSX has a high concentration of financials, energy, and materials companies, sectors with strong earnings visibility and reasonable valuation discipline. Canadian banks (Royal Bank, TD, Scotiabank, BMO, CIBC, National Bank) consistently have real earnings growth and modest PEG ratios. Energy and mining companies, when in a growth phase, show low PEG relative to cyclical earnings.
The MCap > C$500M filter is easy to pass in Canada. The TSX is a mid-to-large-cap exchange by nature. Zero cash periods across 25 years means the quality growth filter found investable companies in every quarter, including through 2008 and 2020.
Methodology
Universe: TSX (Toronto Stock Exchange) + TSXV Period: 2000-2025 (25.8 years, 103 quarterly periods) Portfolio: Top 30 by PEG ASC, equal weight Execution: Next-day close (MOC) Benchmark: TSX Composite (^GSPTSE) Cash periods: 0 of 103 (0%) Average stocks when invested: ~25 Costs: Size-tiered transaction costs applied Point-in-time: 45-day lag on financial data Market cap filter: C$500M+ (local currency, ≈ $362M USD) Data: Ceta Research (FMP financial data warehouse)
Important: Returns are in CAD (Canadian Dollar). The CAD tracked the USD closely over this period (ranging from ~0.62 to ~0.91 USD/CAD), so the currency drag is less severe than for currencies that depreciated significantly. Still, USD-based investors would see slightly different returns.
The Numbers
Summary metrics:
| Metric | PEG Canada | TSX Composite |
|---|---|---|
| CAGR | 9.67% | 5.08% |
| Excess CAGR | +4.59% | -- |
| Sharpe Ratio | 0.367 | 0.166 |
| Sortino Ratio | 0.607 | -- |
| Max Drawdown | -58.50% | -41.58% |
| Annualized Volatility | 19.56% | 15.55% |
| Total Return | 977% | 258% |
| Beta vs TSX | 1.001 | 1.0 |
| Up Capture | 128.3% | -- |
| Down Capture | 94.5% | -- |
Annual returns:
| Year | PEG Canada | TSX Composite | Excess |
|---|---|---|---|
| 2000 | +20.1% | +2.4% | +17.7% |
| 2001 | +15.6% | -11.2% | +26.8% |
| 2002 | +1.3% | -11.9% | +13.2% |
| 2003 | +27.8% | +23.1% | +4.8% |
| 2004 | +19.3% | +10.2% | +9.0% |
| 2005 | +22.4% | +25.1% | -2.7% |
| 2006 | +10.5% | +13.0% | -2.5% |
| 2007 | -9.3% | +7.8% | -17.0% |
| 2008 | -41.0% | -33.7% | -7.3% |
| 2009 | +57.5% | +28.5% | +29.0% |
| 2010 | +24.5% | +12.9% | +11.6% |
| 2011 | -9.0% | -8.9% | -0.1% |
| 2012 | +9.9% | +2.7% | +7.1% |
| 2013 | +8.1% | +8.4% | -0.3% |
| 2014 | +4.3% | +8.5% | -4.3% |
| 2015 | -18.9% | -12.4% | -6.5% |
| 2016 | +25.8% | +19.2% | +6.7% |
| 2017 | +5.6% | +5.9% | -0.3% |
| 2018 | -14.6% | -12.0% | -2.6% |
| 2019 | +15.8% | +19.2% | -3.4% |
| 2020 | +31.1% | +2.5% | +28.6% |
| 2021 | +31.6% | +21.2% | +10.4% |
| 2022 | -4.3% | -8.4% | +4.2% |
| 2023 | +3.7% | +7.4% | -3.7% |
| 2024 | +30.1% | +19.3% | +10.8% |
| 2025 | +32.2% | +21.1% | +11.1% |
The Early Years Were Strong
Canada's PEG strategy started strong. In 2000, the portfolio returned +20.1% while the TSX gained just +2.4%. Canadian quality-growth stocks outperformed the broad index by 17 points. The portfolio's quality filters (ROE > 12%, D/E < 1.5) selected companies with real earnings growth at reasonable valuations.
2001 (+15.6% vs TSX -11.2%) and 2002 (+1.3% vs TSX -11.9%) continued the outperformance pattern. The quality screen kept the portfolio away from the most leveraged companies in the downturn.
Consistent Alpha Over 25 Years
The real story isn't any single year. It's the persistence. Against the TSX Composite (the proper local benchmark), the PEG strategy delivered +4.59%/yr of excess return over 25 years. That's measured in the same currency, against the right benchmark.
The strategy beat the TSX in 14 of 26 calendar years (55% win rate). It captured massive upside in recoveries (2009: +57.5% vs TSX +28.5%, 2020: +31.1% vs TSX +2.5%) while keeping pace in downturns. In 2022, the portfolio fell -4.3% vs the TSX's -8.4%, an excess of +4.2%. The alpha doesn't come from bear market protection alone. It comes from the quality-growth filter consistently selecting better companies than the broad index.
Zero Cash Periods
This matters for practical deployment. Every quarter from 2000 to 2025, the TSX PEG screen found at least 10 qualifying companies. You're never sitting on cash waiting for conditions to improve. The portfolio stays invested.
For India, the strategy sat in cash for 21 periods early on. For South Africa, 23 cash periods. For Norway, the local benchmark only starts in 2013 so coverage is shorter. For Canada, none.
Run It Yourself
# Live screen (current Canada stocks)
python3 peg-ratio/screen.py --preset canada
# Historical backtest (Canada only)
python3 peg-ratio/backtest.py --preset canada --output results/canada.json --verbose
Limitations
High down capture. 94.5% down capture vs the TSX means the portfolio falls almost as hard as the index in bear markets. The -58.50% max drawdown in 2008-2009 was steep. The alpha comes from stock selection in recoveries and bull markets, not from downside protection.
Energy concentration risk. The TSX is heavily weighted toward energy and materials. When oil prices fall (2015, 2018), the Canada PEG portfolio suffers. The -18.9% in 2015 and -14.6% in 2018 reflect energy sector weakness, though both years also saw the TSX decline (-12.4% and -12.0%).
Beta of 1. At 1.001, the portfolio tracks the TSX closely in terms of market sensitivity. The +4.59%/yr excess return comes from better stock selection, not from risk factor tilts.
Currency: CAD/USD fluctuations are modest over long periods but can materially affect single-year returns for USD-based investors.
Part of a Series
- PEG Ratio in the US → (flagship, full methodology)
- PEG Ratio in India → (+0.99%/yr vs Sensex, best absolute return outside Norway)
- PEG Ratio in Japan → (+3.07%/yr vs Nikkei 225)
- PEG Ratio in South Africa → (low beta, downside protection)
- PEG Ratio in Sweden → (best Sharpe vs local index, 0.437)
- 19-Exchange Comparison →
Data: Ceta Research (FMP financial data warehouse), TSX, 2000-2025. Returns in CAD. Benchmark: TSX Composite. Execution: next-day close (MOC). Full methodology: METHODOLOGY.md


