
PEG Ratio in Japan: 6.5% CAGR, +3.1%/yr vs Nikkei 225
Japan delivered 6.47% CAGR over 25 years, +3.07%/yr vs the Nikkei 225. Sharpe 0.284 vs benchmark 0.066. Up capture 99.7%, down capture 76.1%. The strategy beat the index in 16 of 26 years.

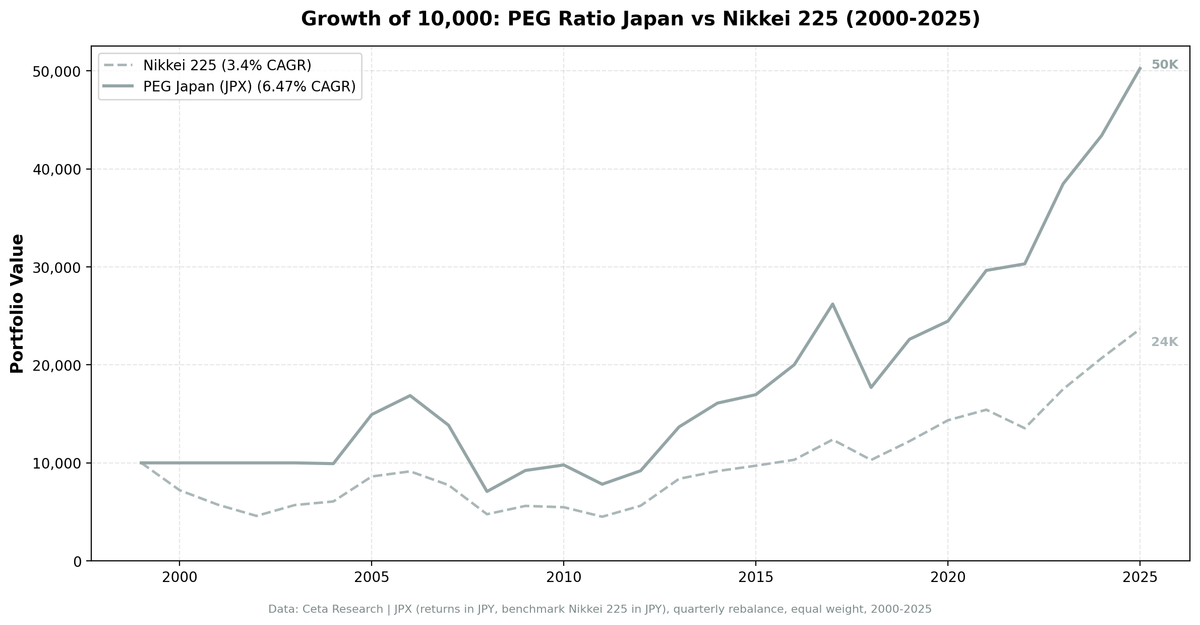
Japan delivered 6.47% CAGR for a PEG ratio strategy on the JPX over 25 years. The Nikkei 225 returned 3.40% over the same period. That's a 3.07% annual advantage in JPY, with a Sharpe ratio more than double the index's.
Contents
- The Japanese Market in Context
- Methodology
- The Numbers
- The Defining Years
- What's Driving the Alpha
- The Cash Period Question
- Run It Yourself
- Limitations
- Part of a Series
This is one of the strongest local-benchmark results in the series. The strategy beat the Nikkei in 16 of 26 calendar years (60% win rate) with measurably lower downside volatility.
Data: FMP financial data warehouse, 2000-2025. Updated May 2026.
The Japanese Market in Context
Japan was excluded from earlier versions of this study because of inconsistent fundamental data coverage. With improved data quality, the JPX now produces clean results across the full 25-year window.
The Tokyo Stock Exchange is dominated by industrial conglomerates, automakers, electronics manufacturers, and financials. Companies like Toyota, Sony, Mitsubishi, Hitachi, and the major banks form the core of the index. Japan's structurally low interest rate regime over most of this period created an environment where modest earnings growth could compound at attractive valuations. PEG < 1 in Japan often picked up companies with real earnings durability that the broad index undervalued.
Methodology
Universe: JPX (Tokyo Stock Exchange) Period: 2000-2025 (25.8 years, 103 quarterly periods) Portfolio: Top 30 by PEG ASC, equal weight. Cash if fewer than 10 qualify. Execution: Next-day close (MOC) Benchmark: Nikkei 225 (^N225), JPY-denominated Cash periods: 17 of 103 (16.5%), concentrated in 2000-2004 Average stocks when invested: ~28 Costs: Size-tiered transaction costs applied Point-in-time: 45-day lag on financial data Market cap filter: ¥50B+ (local currency, ≈ $330M USD) Data: Ceta Research (FMP financial data warehouse)
Both portfolio and benchmark are JPY-denominated. No currency mismatch.
The Numbers
Summary metrics:
| Metric | PEG Japan | Nikkei 225 |
|---|---|---|
| CAGR | 6.47% | 3.40% |
| Excess CAGR | +3.07% | -- |
| Sharpe Ratio | 0.284 | 0.066 |
| Sortino Ratio | 0.439 | -- |
| Max Drawdown | -62.15% | -61.06% |
| Annualized Volatility | 22.45% | 21.05% |
| Total Return | 402% | 136% |
| Beta vs Nikkei | 0.888 | 1.0 |
| Up Capture | 99.7% | -- |
| Down Capture | 76.1% | -- |
Annual returns:
| Year | PEG Japan | Nikkei 225 | Excess |
|---|---|---|---|
| 2000 | 0.0% (cash) | -28.0% | +28.0% |
| 2001 | 0.0% (cash) | -20.6% | +20.6% |
| 2002 | 0.0% (cash) | -19.9% | +19.9% |
| 2003 | 0.0% (cash) | +24.2% | -24.2% |
| 2004 | -0.8% | +6.4% | -7.2% |
| 2005 | +50.6% | +42.1% | +8.5% |
| 2006 | +12.9% | +6.1% | +6.9% |
| 2007 | -18.0% | -15.3% | -2.6% |
| 2008 | -48.8% | -38.5% | -10.4% |
| 2009 | +30.3% | +17.8% | +12.5% |
| 2010 | +6.1% | -2.4% | +8.5% |
| 2011 | -20.1% | -17.7% | -2.4% |
| 2012 | +17.6% | +24.9% | -7.3% |
| 2013 | +48.7% | +48.9% | -0.2% |
| 2014 | +17.8% | +9.4% | +8.3% |
| 2015 | +5.4% | +6.0% | -0.6% |
| 2016 | +18.0% | +6.2% | +11.8% |
| 2017 | +30.9% | +20.0% | +11.0% |
| 2018 | -32.5% | -16.8% | -15.7% |
| 2019 | +27.8% | +18.6% | +9.2% |
| 2020 | +8.2% | +17.5% | -9.3% |
| 2021 | +21.2% | +7.5% | +13.7% |
| 2022 | +2.3% | -12.2% | +14.5% |
| 2023 | +27.0% | +29.4% | -2.5% |
| 2024 | +12.8% | +18.1% | -5.3% |
| 2025 | +15.8% | +14.3% | +1.5% |
The Defining Years
2005-2009 era: The PEG strategy hit its stride as Japan emerged from the lost decade and into the global commodity boom. 2005: +50.6% vs Nikkei +42.1%. The 2008 drop was steeper than the index, but the 2009 recovery (+30.3% vs +17.8%) caught up.
Abenomics era (2013-2017): Prime Minister Abe's monetary and fiscal stimulus drove Japanese equities. The PEG portfolio kept pace in the 2013 surge (+48.7% vs +48.9%), then outperformed in 2014 (+17.8% vs +9.4%), 2016 (+18.0% vs +6.2%), and 2017 (+30.9% vs +20.0%). Companies with low PEG ratios benefited disproportionately as growth expectations re-rated.
2022 resilience: The strategy returned +2.3% while the Nikkei fell -12.2%, a +14.5% excess. The yen weakened, exporters benefited, and the PEG portfolio's quality filters (ROE > 12%, D/E < 1.5) selected companies positioned for the regime.
2018 drag: The worst year. -32.5% portfolio vs -16.8% Nikkei. Japan's domestic-focused mid-caps fell harder than the export-heavy large-cap index during the global trade tension and rising rates of 2018.
What's Driving the Alpha
Japan's PEG advantage comes from three sources:
Low correlation with the broad index. Beta of 0.888 means the portfolio moves about 89% of the index's swings. The remaining 11% is real divergence.
Better up-capture than down-capture. Up capture 99.7% vs down capture 76.1%. The portfolio captures essentially all of the upside while taking only three-quarters of the downside. That asymmetry is where most of the alpha comes from.
Steady cash compounding when nothing qualifies. From 2000 through 2004, the strategy held cash. The Nikkei was in extended decline through 2002 and finally recovered in 2003. Holding cash during the 2000-2002 decline saved the portfolio from -50%+ index losses.
The Cash Period Question
17 of 103 periods (16.5%) were cash, all between 2000 and 2004. This corresponds to Japan's prolonged post-bubble cleanup. PEG screening requires positive earnings growth, and many Japanese companies had stagnant or declining earnings during this period.
The cash years included 2003 when the Nikkei returned +24.2% (a missed gain of -24.2% excess), but they also avoided 2000 (-28.0%), 2001 (-20.6%), and 2002 (-19.9%). The trade was clearly favorable: 88 percentage points of bear market avoidance vs 24 percentage points of bull market missed.
Run It Yourself
# Live screen (current Japan stocks)
python3 peg-ratio/screen.py --preset japan

# Historical backtest (Japan only)
python3 peg-ratio/backtest.py --preset japan --output results/japan.json --verbose
Limitations
Currency exposure. Returns are in JPY. The yen has weakened significantly against the USD over this period (from ~110 JPY/USD in 2000 to ~150+ JPY/USD in 2025). USD-based investors accessing Japanese equities through unhedged vehicles see lower USD returns than the JPY figures.
Sector concentration. Japan's exchange is heavy on industrials, automakers, and financials. The strategy is sectorally concentrated by construction.
Volatile single-year results. The 2018 -15.7% excess and 2008 -10.4% excess show the strategy can lag in regime shifts (rate spikes, trade tension).
Max drawdown. -62.15% is severe, though essentially identical to the Nikkei's own -61.06% drawdown.
Cash drag. The 16.5% cash rate concentrated in 2000-2004 reflects real data availability constraints, not a tactical decision.
Part of a Series
- PEG Ratio in the US → (flagship, full methodology)
- PEG Ratio in India → (+0.99%/yr vs Sensex)
- PEG Ratio in South Africa → (low beta, downside protection)
- PEG Ratio in Canada → (+4.59%/yr vs TSX, zero cash periods)
- PEG Ratio in Sweden → (best alpha, +7.54% vs OMX30)
- 19-Exchange Comparison →
Data: Ceta Research (FMP financial data warehouse), JPX, 2000-2025. Returns in JPY. Benchmark: Nikkei 225. Execution: next-day close. Full methodology: METHODOLOGY.md


