
PEG Ratio in Sweden: 10.7% CAGR, +7.5%/yr vs OMX Stockholm 30
Stockholm Exchange delivered 10.71% CAGR over 25 years, +7.54%/yr vs OMX Stockholm 30. Sharpe ratio of 0.437 is 7x the benchmark's 0.060.

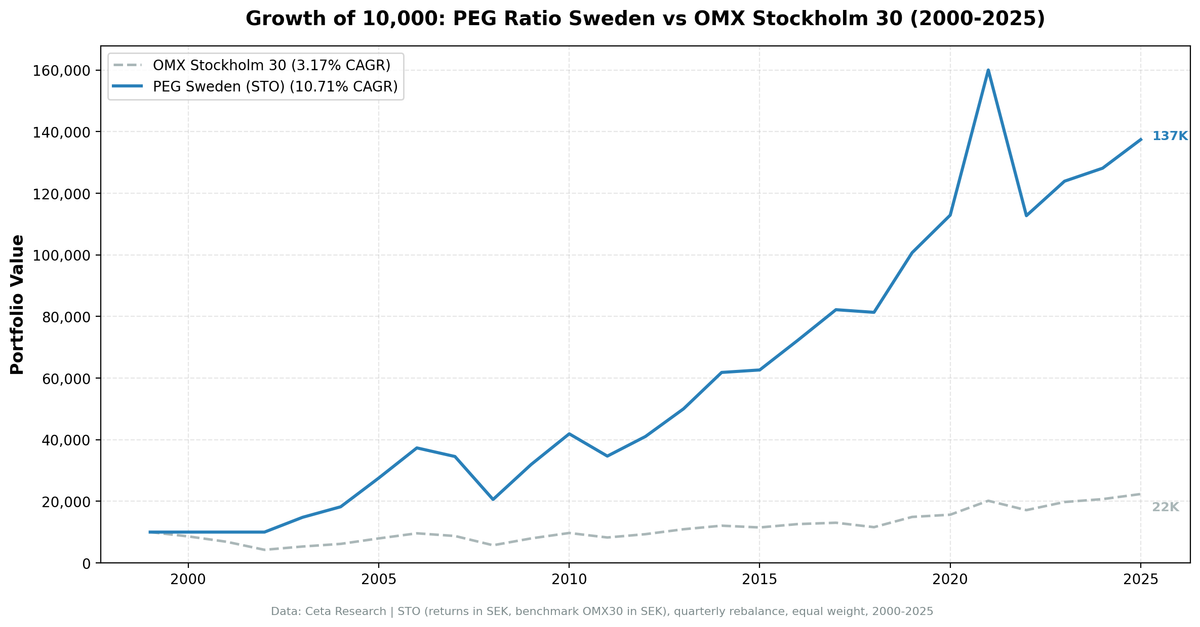
The Stockholm Exchange delivered 10.71% CAGR for a PEG ratio strategy over 25 years, beating the OMX Stockholm 30 by 7.54%/yr. The Sharpe ratio of 0.437 towers over the OMX30's 0.060. Compared to its own local index, Sweden is the strongest PEG ratio market we tested.
Contents
- The Stockholm Exchange in Context
- Methodology
- The Numbers
- Consistent Alpha, Not Just a Few Big Years
- Sharpe Ratio: 7x the Local Benchmark
- Recent Challenges
- Up vs Down Capture
- Run It Yourself
- Limitations
- Part of a Series
This is the standout result in the series. Large alpha vs the local benchmark, strong risk-adjusted return, and a clear explanation for why it works.
Data: FMP financial data warehouse, 2000-2025. Updated May 2026.
The Stockholm Exchange in Context
Sweden punches above its weight in global equities. The Nasdaq Stockholm lists companies like Ericsson, Volvo, Nordea, Atlas Copco, Sandvik, and H&M. These are real mid-to-large caps with genuine international businesses and earnings visibility.
The Nordics have a tradition of quality industrial companies (engineering, manufacturing, pharmaceuticals) that generate steady earnings growth. PEG < 1 in this context tends to find genuinely undervalued industrials rather than the cyclicals-at-peak-earnings problem common in the US full universe.
Methodology
Universe: STO (Nasdaq Stockholm) Period: 2000-2025 (25.8 years, 103 quarterly periods) Portfolio: Top 30 by PEG ASC, equal weight. Cash if fewer than 10 qualify. Execution: Next-day close (MOC) Benchmark: OMX Stockholm 30 (^OMXS30), SEK-denominated Cash periods: 13 of 103 (12.6%), concentrated in early 2000s Average stocks when invested: ~26 Costs: Size-tiered transaction costs applied Point-in-time: 45-day lag on financial data Market cap filter: SEK 5B+ (local currency) Data: Ceta Research (FMP financial data warehouse)
Note: Returns and benchmark are both in SEK. Comparing a Swedish portfolio to the OMX Stockholm 30 (rather than the S&P 500) isolates stock-picking alpha from currency effects.
The Numbers
Summary metrics:
| Metric | PEG Sweden | OMX Stockholm 30 |
|---|---|---|
| CAGR | 10.71% | 3.17% |
| Excess CAGR | +7.54% | -- |
| Sharpe Ratio | 0.437 | 0.060 |
| Sortino Ratio | 0.713 | 0.082 |
| Max Drawdown | -54.26% | -66.13% |
| Annualized Volatility | 19.95% | 19.56% |
| Total Return | 1,274% | 124% |
| Beta vs OMX30 | 0.773 | 1.0 |
| Up Capture | 115.6% | -- |
| Down Capture | 68.8% | -- |
Annual returns:
| Year | PEG Sweden | OMX30 | Excess |
|---|---|---|---|
| 2000 | 0.0% (cash) | -14.0% | +14.0% |
| 2001 | 0.0% (cash) | -20.1% | +20.1% |
| 2002 | 0.0% (cash) | -38.2% | +38.2% |
| 2003 | +48.0% | +25.2% | +22.8% |
| 2004 | +23.1% | +16.0% | +7.1% |
| 2005 | +51.3% | +28.8% | +22.5% |
| 2006 | +35.5% | +20.8% | +14.6% |
| 2007 | -7.5% | -9.1% | +1.6% |
| 2008 | -40.4% | -34.4% | -6.0% |
| 2009 | +55.2% | +38.9% | +16.3% |
| 2010 | +31.2% | +22.1% | +9.0% |
| 2011 | -17.3% | -15.1% | -2.2% |
| 2012 | +18.4% | +13.1% | +5.3% |
| 2013 | +21.9% | +17.2% | +4.7% |
| 2014 | +23.6% | +10.5% | +13.1% |
| 2015 | +1.3% | -4.7% | +6.0% |
| 2016 | +15.4% | +9.5% | +5.9% |
| 2017 | +13.7% | +3.5% | +10.3% |
| 2018 | -1.0% | -11.0% | +10.0% |
| 2019 | +23.8% | +28.7% | -4.9% |
| 2020 | +12.1% | +4.8% | +7.3% |
| 2021 | +41.8% | +28.9% | +12.8% |
| 2022 | -29.6% | -15.1% | -14.5% |
| 2023 | +9.9% | +15.4% | -5.5% |
| 2024 | +3.4% | +4.8% | -1.3% |
| 2025 | +7.3% | +8.0% | -0.7% |
Consistent Alpha, Not Just a Few Big Years
Against the OMX30, the strategy beat its benchmark in 19 of 26 years. Three years still stand out: 2003 (+48.0% vs +25.2%), 2005 (+51.3% vs +28.8%), and 2009 (+55.2% vs +38.9%). But the alpha wasn't front-loaded the way it appeared vs the S&P 500. The strategy beat the OMX30 in most years from 2000 through 2021, with only 2019 showing a meaningful shortfall (-4.9%). That's a win rate of 63%.
The 2003-2006 period coincided with the Nordic industrial recovery from the dot-com bust. Swedish industrials, which dominate the STO exchange, had strong earnings growth and were priced conservatively. PEG < 1 was easy to find.
2009 repeated the pattern. Swedish industrials and exporters recovered strongly as global trade rebounded, starting from beaten-down valuations.
Sharpe Ratio: 7x the Local Benchmark
A Sharpe of 0.437 vs the OMX30's 0.060 is a massive gap. The OMX Stockholm 30 delivered just 3.17% CAGR over this period with 19.56% volatility, barely above the risk-free rate. The PEG strategy more than tripled the CAGR (10.71%) with similar volatility (19.95%), producing a Sharpe ratio 7.3x the benchmark.
Compare to the other exchanges in the study (strategy Sharpe): - Sweden: 0.437 - Norway: 0.707 (over 12.5 years only, Oslo All Share starts 2013) - Canada: 0.367 - Japan: 0.284 - US full universe: 0.204 - India: 0.186 - South Africa: -0.16 (9% local risk-free rate makes both negative)
Recent Challenges
2022-2025 has been the weakest stretch. 2022: -14.5% excess (Riksbank rate shock hit PEG stocks harder than blue chips). 2023-2025: the strategy trailed the OMX30 by small amounts as Swedish large-cap tech and defense names (not typical PEG picks) led the index.
Swedish rate sensitivity played a role. The Riksbank's aggressive hikes in 2022-2023 hit property-adjacent and consumer-facing companies that occasionally appear in PEG screens.
Still, the cumulative alpha remains large: 1,274% total return vs 124% for the OMX30.
Up vs Down Capture
Up capture: 115.6%. Down capture: 68.8%. The strategy captures more upside than downside vs the OMX30, and the gap is wide. On up years, Sweden overshoots by 15.6%. On down years, it captures only 69% of the decline.
A beta of 0.773 confirms the picture: the PEG screen picks stocks that move less than the OMX30 in aggregate, but with better returns. That's the textbook definition of alpha.
Run It Yourself
# Live screen (current Sweden stocks)
python3 peg-ratio/screen.py --exchange STO
# Historical backtest (Sweden only)
python3 peg-ratio/backtest.py --exchange STO --output results/sweden.json --verbose
Limitations
Recent weakness. 2022-2025 trailed the OMX30 in three of four years. Whether this is a regime shift or a temporary headwind (rate cycle, sector rotation to defense/tech) is hard to determine from 25 years of data.
13% cash rate. The strategy sat in cash 13 of 103 periods, all in the early 2000s. Sweden had fewer large-cap stocks with positive PEG data in 2000-2002. Cash during the dot-com crash was lucky, not by design.
Sector concentration. Sweden's exchange is dominated by industrials. The strategy is likely more concentrated sectorally than a global PEG portfolio would be.
Max drawdown. -54.26% is deep, though it's shallower than the OMX30's own -66.13% drawdown over the same period.
Part of a Series
- PEG Ratio in the US → (flagship, full methodology)
- PEG Ratio in India → (+0.99%/yr vs Sensex, best absolute return outside Norway)
- PEG Ratio in Japan → (+3.07%/yr vs Nikkei 225)
- PEG Ratio in South Africa → (low beta, downside protection)
- PEG Ratio in Canada → (+4.59%/yr vs TSX, zero cash periods)
- 19-Exchange Comparison →
Data: Ceta Research (FMP financial data warehouse), STO, 2000-2025. Returns in SEK. Full methodology: METHODOLOGY.md


