
Beat Earnings, Stock Still Drops 5%: What Happens Next in 11 Markets
17,692 beat-and-dip events across 11 exchanges with local benchmarks and data-quality filters. Taiwan: +2.23%** at T+21. UK: +1.51%**. China: +2.08%* at T+63. US: -0.72%** at T+63. Sweden lost its negative signal to the data cleanup; India still has none.

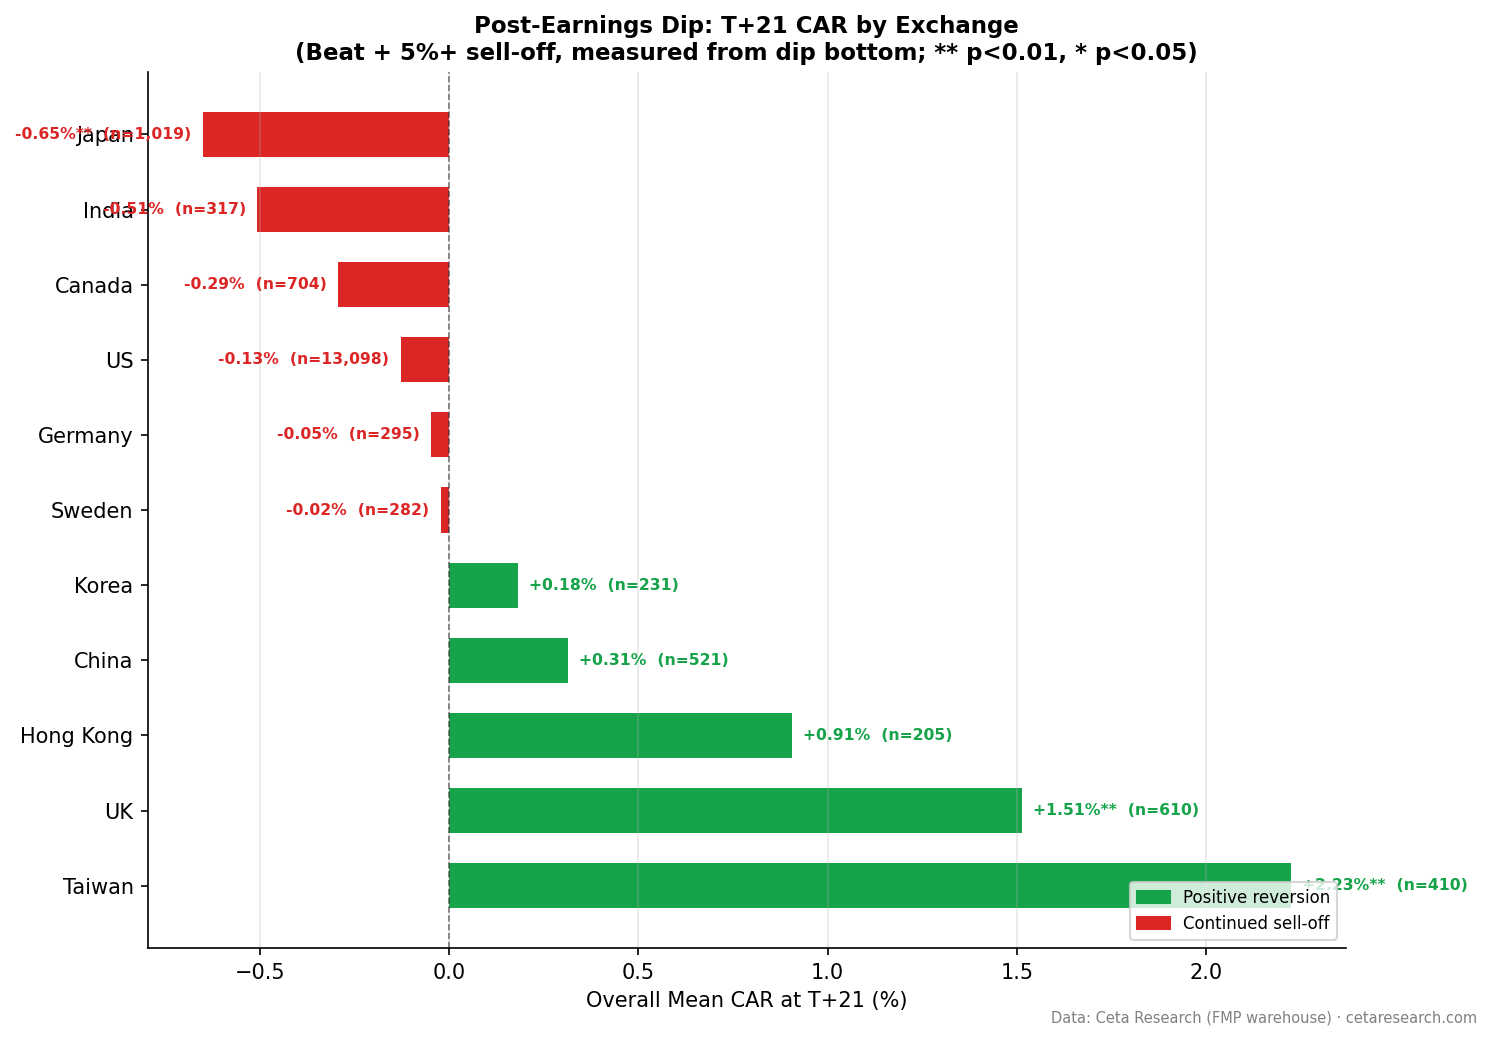
We ran a beat-and-dip event study on 11 exchanges, using local currency benchmarks and a new set of data-quality filters that strip out bad price rows before any return is computed. Three markets show significant positive reversion, two show significant negative drift, and six are noise.
Contents
- The Setup
- The Global Picture
- What's Statistically Significant
- The Six Noise Markets
- Data Quality Notes
- What the Benchmark Change Revealed
- Takeaway
The Setup
A "beat-and-dip" event is: 1. epsActual > epsEstimated with ABS(epsEstimated) > 0.01 2. Stock drops ≥ 5% from T-1 close to T+1 close (announcement reaction)
For each event, we measure cumulative abnormal return (CAR) at T+21 and T+63 trading days from T+1 close (the dip bottom). CAR = stock return minus local benchmark return over the same window. Each exchange uses its own currency-matched index: Sensex for India, TAIEX for Taiwan, Nikkei for Japan, FTSE for UK, and so on. US uses SPY.
Three data-quality guards apply to every market: a price-oscillation filter that removes FMP phantom holiday rows and broken split adjustments, a $1 minimum entry price at T+1, and a 200% single-window return cap that drops price artifacts. Brazil (SAO) was removed from the study entirely: its adjusted close data has unfixable split-adjustment errors.
Total events across 11 markets: 17,692
Data: FMP financial data warehouse, 2000–2025. Updated June 2026.
The Global Picture
| Exchange | Events | T+21 CAR | t-stat | T+63 CAR | t-stat | Benchmark | Data |
|---|---|---|---|---|---|---|---|
| Taiwan (TAI/TWO) | 410 | +2.23% | +3.78** | +3.88% | +3.39** | TAIEX | 2014–2025 |
| UK (LSE) | 610 | +1.51% | +3.50** | -0.95% | -1.22 | FTSE 100 | 2022–2025† |
| Hong Kong (HKSE) | 205 | +0.91% | +1.08 | -0.31% | -0.22 | Hang Seng | 2014–2025 |
| China (SHZ/SHH) | 521 | +0.31% | +0.62 | +2.08% | +2.54* | SSE Comp. | 2014–2025‡ |
| Korea (KSC) | 231 | +0.18% | +0.27 | -0.21% | -0.17 | KOSPI | 2014–2025 |
| Sweden (STO) | 282 | -0.02% | -0.04 | -1.56% | -1.57 | OMX 30 | 2014–2025 |
| Germany (XETRA) | 295 | -0.05% | -0.09 | -1.90% | -1.73 | DAX | 2015–2025 |
| US (NYSE/NASDAQ/AMEX) | 13,098 | -0.13% | -1.28 | -0.72% | -4.03** | S&P 500 | 2000–2025 |
| Canada (TSX) | 704 | -0.29% | -0.68 | -0.87% | -1.20 | TSX Comp. | 2000–2025 |
| India (NSE) | 317 | -0.51% | -0.98 | +1.01% | +1.11 | Sensex | 2022–2025† |
| Japan (JPX) | 1,019 | -0.65% | -2.65** | -0.53% | -1.16 | Nikkei 225 | 2014–2025 |
p<0.05, p<0.01
†Effective coverage primarily post-2022 due to FMP pipeline timing. ‡China beat rate 32–36% vs 41–60% for other markets; interpret with care.
What's Statistically Significant
Five markets show significant results at one or both windows.
Significant positive (reversion):
Taiwan: The strongest result. +2.23% at T+21 (t=3.78), +3.88% at T+63 (t=3.39). Both significant at p<0.01. The 10–20% dip category is even stronger: +7.35%** at T+21. Taiwan's result survived both the local-benchmark switch and the data-quality filters essentially unchanged. This is the clearest case for mean reversion in the study.
UK: Positive at T+21 only. +1.51% at T+21 (t=3.50). Reverses by T+63 (-0.95%, not significant). The UK result strengthened after data cleaning (was +1.33%). 610 events, but concentrated in 2022–2025. Treat this as a recent-period finding.
China: Delayed positive at T+63. +2.08% at T+63 (t=2.54). Not significant at T+21. This is similar to the pattern India used to show, but with stronger statistical backing (521 events vs India's 317). The data-quality filters trimmed it from +2.35% to +2.08%, so the conviction level dropped a notch. China data carries its own caveats (low beat rate of 32–36%).
Significant negative (sell-off continues):
US: The benchmark. -0.72%* at T+63 (t=-4.03). 13,098 events over 25 years. The most credible result in the study. One change from the earlier run: T+21 dropped from -0.22% to -0.13% (t=-1.28) and is no longer significant. Bad price rows were exaggerating the early drift. The three-month deterioration is intact.
Japan: Negative at T+21. -0.65%* at T+21 (t=-2.65), now significant at p<0.01 (was -0.58%). T+63 is -0.53% (not significant). Measured against the Nikkei, the initial sell-off is informationally efficient: the first month produces significant underperformance.
The Six Noise Markets
Canada, Germany, Hong Kong, Korea, India, and Sweden show no statistically significant result at either window.
Sweden dropped out of the negative club. The earlier run showed -2.08%* at T+63 (t=-2.08), just past the significance threshold. After the data-quality filters removed about 3,700 bad price rows from the Swedish data, the result is -1.56% (t=-1.57). Part of that "significant" drift was price artifacts.
India lost its signal. The earlier finding of +2.54%** at T+63 was measured against INDA, a USD-denominated ETF. Measured against the Sensex (local INR index) and with NSE-only data (BSE removed for dual-listing overlap), the result is +1.01% (t=1.11). Still positive direction, but well below the significance threshold. The earlier significance was partly a benchmark artifact involving USD/INR movements. India data is also concentrated in 2022–2025 (94% of events).
Canada (n=704) is the longest-running noise market: 25 years of data, T+63 of -0.87% (t=-1.20). Consistently in the "slight negative" direction without reaching significance.
Germany (n=295) shows -1.90% at T+63 (t=-1.73), close to significance but not crossing the threshold.
Data Quality Notes
UK (LSE): 610 events concentrated in 2022–2025. The +1.51%** at T+21 is a recent-period result. FTSE 100's composition (energy-heavy, bank-heavy) may not match the mid-cap growth stocks generating beat-and-dip events.
India (NSE): 317 events, 94% from 2022 or later. BSE was removed to eliminate 38% dual-listing overlap. Benchmark changed from INDA to Sensex. Both changes shift the baseline. The earlier +2.54%** result is not comparable to the current +1.01%.
China (SHZ/SHH): Beat rate of 32–36% vs 41–60% elsewhere. This could reflect conservative analyst forecasting norms, reporting practice differences, or data coverage gaps. The +2.08%* result at T+63 is statistically significant but should be interpreted with this context.
Excluded: Brazil and Australia (unfixable adjClose split-adjustment errors in the source data). Thailand, Norway, and Switzerland all had fewer than 100 qualifying events.
What the Benchmark Change Revealed
The shift from USD ETFs to local indices changed the picture more than expected. The data-quality filters changed it again.
Markets that got stronger: Taiwan improved from +1.76% (vs SPY) to +2.23% at T+21 vs TAIEX. TAIEX is a harder benchmark than SPY for Taiwan stocks, but the excess return actually increased. This validates the Taiwan result: it's not a currency artifact, and it's not a data artifact either.
Markets that gained significance: UK (+1.51% vs FTSE, was +0.44% vs EWU), China (+2.08%* vs SSE, was +0.67% vs FXI), Japan (-0.65% vs Nikkei, was -0.26% vs EWJ).
Markets that lost significance: India (+1.01% vs Sensex, was +2.54% vs INDA). The INDA-based result incorporated USD/INR movements that inflated the apparent alpha. Sweden (-1.56% at T+63, was -2.08%) lost its significance to the data-quality filters rather than the benchmark: bad price rows were driving part of the drift. US T+21 (-0.13%, was -0.22%) dropped out for the same reason, though US T+63 remains firmly negative.
The lesson: ETF benchmarks can mask or inflate abnormal returns, and bad price data can manufacture significance. A Taiwanese investor holding TAIEX, not SPY, as their baseline was beating the market by more than the ETF comparison suggested. An Indian investor comparing to Sensex, not INDA, had less alpha than it appeared.
Takeaway
"Buy the beat-and-dip" works in three markets and fails in two. Taiwan is the clearest positive result. UK shows short-term reversion (T+21 only, recent data). China shows delayed reversion at T+63 (with beat-rate caveats). Six markets show nothing.
The sell-off is informative in the US and Japan. The market's negative reaction to a genuine earnings beat in those markets typically contains real information about forward prospects. Buying against it has produced negative abnormal returns on average.
Local benchmarks matter, and so does data quality. Currency movements and ETF construction can hide real patterns or create false ones. The India result was a cautionary example: what looked like +2.54%** alpha was partly a benchmark artifact. Sweden was the data-quality version of the same lesson: a "significant" negative drift that softened below the threshold once bad price rows were removed.
Data note: Results use local currency benchmarks (SPY for US, Sensex for India, Nikkei for Japan, TAIEX for Taiwan, etc.). Market cap floors applied per exchange. All CARs winsorized at 1st/99th percentile. Price-oscillation filter, $1 minimum entry price, and 200% single-window return cap applied to all markets.
Part of a series: Post-earnings dip mean reversion tested globally. See individual market studies: US, Taiwan, India.
Data: FMP earnings surprises + adjusted prices, 2000–2025 (varies by exchange). 17,692 total beat-and-dip events across 11 exchanges. Local currency benchmarks.
Past performance does not guarantee future results. This is educational content, not investment advice.

