
Post-Earnings Dip Backtest: 13,098 Events Say Don't Buy the Beat-and-Dip
We tested 13,098 beat-and-dip events on US stocks from 2000–2025. Stocks that beat earnings but sell off 5%+ don't recover. They keep underperforming. T+63 CAR is -0.72% (t=-4.03). The sell-off is not an overreaction; it's information.

A stock beats earnings estimates. The market sells it off 5% anyway. The obvious trade is to buy the dip. The fundamentals just proved out, so the sell-off is an overreaction. We ran this on US stocks from 2000 to 2025. The sell-off isn't an overreaction. It continues.
Contents
- Method
- What We Found
- Dip Size Matters, But Not How You'd Expect
- Why PEAD Beats Mean Reversion Here
- The SQL Screen
- Limitations
- Takeaway
Method
Signal: epsActual > epsEstimated with ABS(epsEstimated) > 0.01. Then stock drops ≥ 5% from T-1 close to T+1 close (the two-day reaction window around the announcement). Both conditions must hold.
Universe: NYSE, NASDAQ, and AMEX-listed stocks with market cap above $1B USD. Data from FMP's earnings surprises endpoint, 2000–2025.
Dip categories: - dip_5: 5–10% sell-off (moderate sell-off) - dip_10: 10–20% sell-off (sharp sell-off) - dip_20: 20%+ sell-off (severe sell-off)
Return windows: Cumulative abnormal return (CAR) measured from T+1 close (dip bottom) at T+5, T+10, T+21, and T+63 trading days. CAR = stock return minus SPY return over the same window.
Winsorization: 1st/99th percentile to reduce outlier noise.
Data quality: A price-oscillation filter removes FMP phantom holiday rows and broken split adjustments before any return is computed. Events with a T+1 entry price below $1 are excluded, and single-window returns above 200% are treated as price artifacts and dropped.
Total events: 13,098
Data: FMP financial data warehouse, 2000–2025. Updated June 2026.
What We Found
The instinct is wrong. Stocks that beat earnings estimates but sell off 5% or more don't revert. They keep underperforming the market.
The overall T+21 CAR is -0.13% (t=-1.28). That's flat at 21 days, but by T+63 it deteriorates to -0.72% (t=-4.03). Not a recovery. The sell-off was telling you something.
| Window | Mean CAR | t-stat | N | Hit Rate |
|---|---|---|---|---|
| T+5 | -0.04% | -0.72 | 13,098 | 48.4% |
| T+10 | -0.22%** | -3.11 | 13,082 | 47.3% |
| T+21 | -0.13% | -1.28 | 13,084 | 47.7% |
| T+63 | -0.72%** | -4.03 | 13,046 | 46.3% |
p<0.05, p<0.01
The hit rate tells the same story. At T+63, only 46.3% of beat-and-dip stocks outperform the market. Coinflip odds would be 50%. You're worse than random.
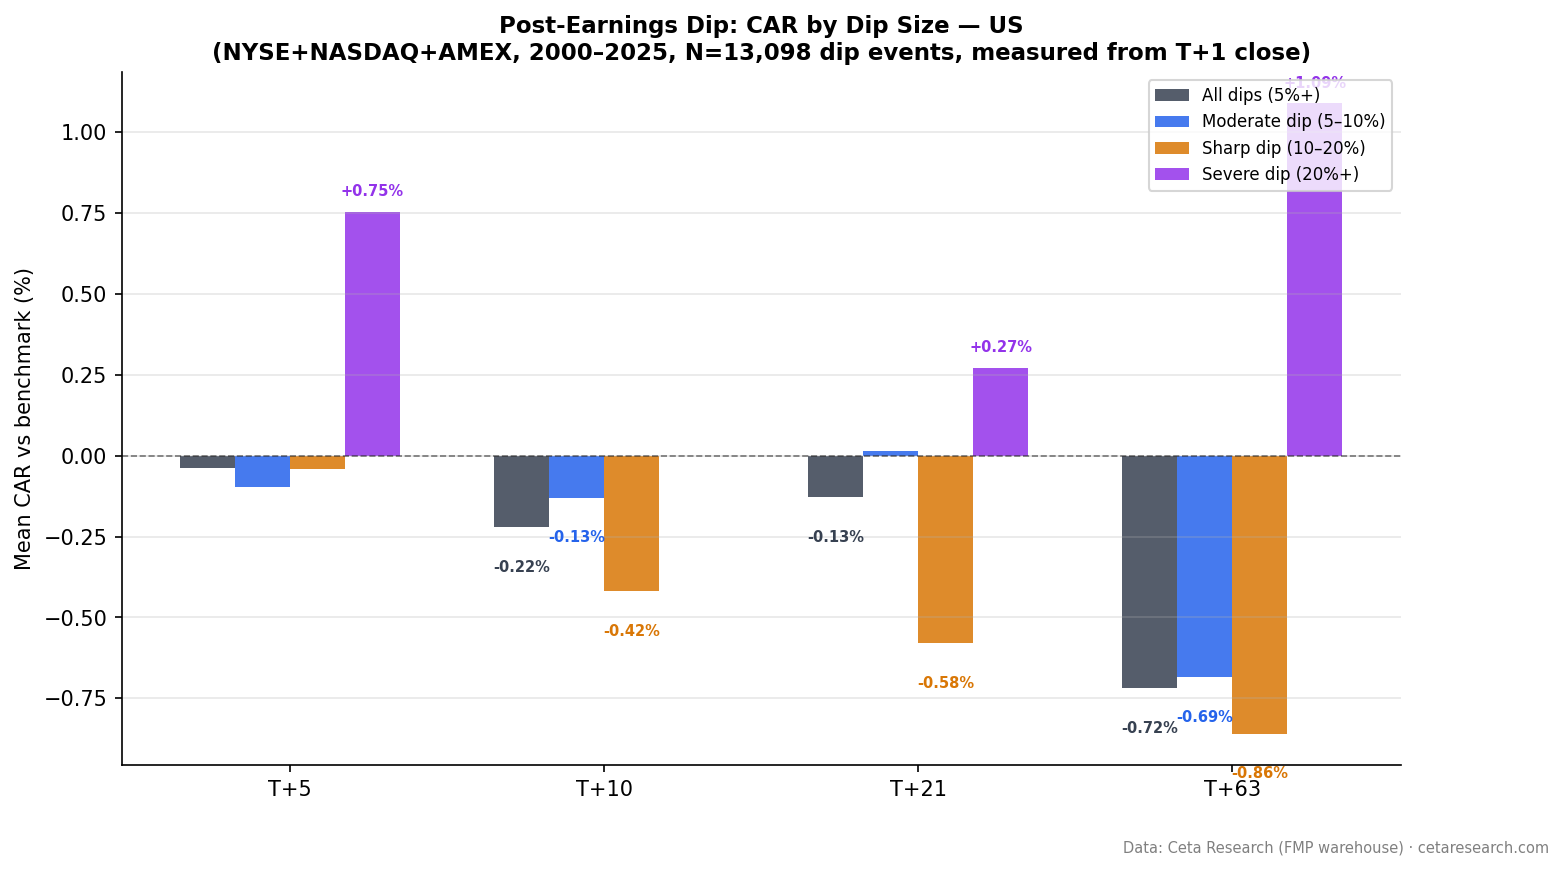
Dip Size Matters, But Not How You'd Expect
The sharper the sell-off, the more it continues, except at the extreme.
| Dip Category | N | T+21 CAR | t-stat | T+63 CAR | t-stat |
|---|---|---|---|---|---|
| All dips (5%+) | 13,098 | -0.13% | -1.28 | -0.72% | -4.03** |
| Moderate (5–10%) | 8,722 | +0.02% | +0.14 | -0.69% | -3.46** |
| Sharp (10–20%) | 3,692 | -0.58% | -2.72** | -0.86% | -2.17* |
| Severe (20%+) | 684 | +0.27% | +0.47 | +1.09% | +1.01 |
Two things stand out.
The 10–20% sell-off group is the worst. These are stocks where the market sold off hard enough to signal something fundamentally wrong, but not hard enough to be "priced in." At T+21, they're down -0.58% vs SPY (t=-2.72). At T+63, -0.86% (t=-2.17). Both statistically significant.
The 20%+ group is different. The T+21 number is +0.27% and T+63 is +1.09%, but neither is statistically significant (t=0.47 and t=1.01). With n=684, the positive mean is being driven by a fat tail of recoveries, not a consistent effect. The median at T+63 is actually -1.36%. Half the severe dip stocks continue falling.
So: moderate dips are reliably bad, sharp dips are reliably worse, and severe dips are inconsistent with a slightly positive mean masking a negative median.
Why PEAD Beats Mean Reversion Here
Post-earnings announcement drift (PEAD) says stocks continue moving in the direction of the earnings surprise. Beat → drift higher. Miss → drift lower. The beat-and-dip pattern tests the opposite: beat → market says no → does the market eventually agree with the beat?
The data says the market wins. When a company beats estimates but the stock sells off 5%+, the market is likely pricing in something that's not in the EPS number. Guidance cuts. Revenue miss. Margin compression. One-time items. EPS can beat while every forward-looking metric looks worse.
The academic literature on PEAD (Ball & Brown 1968, Foster, Olsen & Shevlin 1984) focuses on the alignment between surprise direction and return. The beat-and-dip is a case where the two conflict: the number was good but the reaction was bad. The reaction contains more information.
The SQL Screen
This query finds current beat-and-dip candidates: stocks that just beat earnings but sold off 5% or more:
WITH recent_beats AS (
    SELECT e.symbol,
           CAST(e.date AS DATE) AS event_date,
           ROUND((e.epsActual - e.epsEstimated) / ABS(NULLIF(e.epsEstimated, 0)) * 100, 1) AS surprise_pct,
           ROUND(k.marketCap / 1e9, 2) AS mktcap_bn,
           p.companyName AS company_name,
           p.exchange
    FROM earnings_surprises e
    JOIN profile p ON e.symbol = p.symbol
    JOIN key_metrics k ON e.symbol = k.symbol AND k.period = 'FY'
    WHERE e.epsEstimated IS NOT NULL
      AND ABS(e.epsEstimated) > 0.01
      AND e.epsActual > e.epsEstimated
      AND CAST(e.date AS DATE) >= CURRENT_DATE - INTERVAL 30 DAY
      AND k.marketCap > 1000000000
      AND p.exchange IN ('NYSE', 'NASDAQ', 'AMEX')
    QUALIFY ROW_NUMBER() OVER (PARTITION BY e.symbol ORDER BY k.date DESC) = 1
)
SELECT rb.symbol,
       rb.event_date,
       rb.surprise_pct,
       rb.mktcap_bn,
       rb.company_name,
       -- Compare T+1 close to T-1 close for the reaction
       ROUND((p2.adjClose - p1.adjClose) / p1.adjClose * 100, 2) AS reaction_pct
FROM recent_beats rb
JOIN stock_eod p1 ON rb.symbol = p1.symbol
    AND CAST(p1.date AS DATE) = rb.event_date - INTERVAL 1 DAY
JOIN stock_eod p2 ON rb.symbol = p2.symbol
    AND CAST(p2.date AS DATE) = rb.event_date + INTERVAL 1 DAY
WHERE (p2.adjClose - p1.adjClose) / p1.adjClose <= -0.05
ORDER BY rb.event_date DESC, rb.surprise_pct DESC
LIMIT 30
The reaction_pct filter at -0.05 catches the 5%+ sell-off. This is a screen, not an entry signal. The backtest says these stocks underperform on average.
Run this screen live on Ceta Research → (pre-loaded query, no account required)
Limitations
Why EPS beats can mislead: A company can beat EPS via cost cuts, buybacks, or one-time tax benefits while its core business deteriorates. The market often sees through headline EPS. The stock reaction is frequently the more honest signal.
Market cap floor: The $1B floor focuses on liquid mid-to-large caps. Small caps may show a different pattern, but execution costs make the trade less practical there.
Survivorship bias: Companies that delisted due to failure are underrepresented, which slightly biases CAR estimates upward. The true result is likely a bit worse.
T+5 is flat, then it deteriorates. The very short-term recovery instinct isn't entirely wrong. T+5 is essentially zero (-0.04%, not significant). The problem is the 1-3 month drift. If you're trading with very tight exits, the signal might look different. But by the time most investors reconsider, it's T+63 territory.
Takeaway
"Buy the beat-and-dip" is the kind of trade that feels logical but fails empirically. The market's negative reaction to a genuine earnings beat usually means something the headline number doesn't show. 13,098 events over 25 years say: when the market says no after a beat, trust the market.
Taiwan is the notable exception, the only market in our study where beat-and-dip events reliably revert. India shows a positive direction at T+63 but no statistical significance. Both are discussed separately.
Part of a series: Post-earnings dip mean reversion tested across 11 exchanges. See Taiwan, India, and the global comparison.
Data: FMP earnings surprises + adjusted prices, 2000–2025. NYSE, NASDAQ, AMEX. Market cap > $1B USD. 13,098 beat-and-dip events. CAR vs SPY, measured from T+1 close.
Past performance does not guarantee future results. This is educational content, not investment advice.


