
Post-Earnings Dip in Taiwan: Beat + 10% Sell-Off Produces +7.4% Recovery
Taiwan is the clearest exception in a global beat-and-dip study. 410 events from 2014–2025 show statistically significant mean reversion: +2.23%** at T+21 overall, and +7.35%** for the 10–20% dip category. Most other markets show flat or negative drift.

In 8 of the 11 markets we tested, buying a stock after an earnings beat and a 5%+ sell-off produces flat or negative abnormal returns. Taiwan is the clearest exception. Post-earnings dip events in Taiwan mean-revert consistently, and the sharper the dip, the stronger the reversion.
Contents
- The Signal
- What We Found
- The 10–20% Dip Is the Sweet Spot
- Why Taiwan?
- Practical Implications
- Limitations
- Takeaway
The Signal
The setup: a company beats earnings estimates (epsActual > epsEstimated), and the stock still drops 5% or more from T-1 close to T+1 close. The question is whether that sell-off reverses over the next 21–63 trading days.
Universe: TAI and TWO-listed stocks with market cap above NT$10B (roughly $300M USD). Data from FMP, 2014–2025. 410 total events.
Benchmark: TAIEX (^TWII), the Taiwan Weighted Index. CAR = Taiwan stock return minus TAIEX return.
Windows: T+5, T+10, T+21, T+63 trading days from T+1 close (dip bottom).
Data quality: A price-oscillation filter removes FMP phantom holiday rows and broken split adjustments before any return is computed. Single-window returns above 200% are treated as price artifacts and dropped.
Data: FMP financial data warehouse, 2014–2025. Updated June 2026.
What We Found
Taiwan shows statistically significant positive reversion starting at T+10.
| Window | Mean CAR | t-stat | N | Hit Rate |
|---|---|---|---|---|
| T+5 | +0.04% | +0.15 | 410 | 45.6% |
| T+10 | +1.19%* | +2.56 | 410 | 48.3% |
| T+21 | +2.23%** | +3.78 | 409 | 51.8% |
| T+63 | +3.88%** | +3.39 | 406 | 49.3% |
p<0.05, p<0.01
The first week is noise. By 10 trading days (two weeks), the reversion is measurable at +1.19% with a t-stat of 2.56. By 21 days (+2.23%, t=3.78), it's reliable. By 63 days (+3.88%, t=3.39), the recovery has extended, though the hit rate at 49% shows it's not universal. The mean is being pushed up by strong recoveries in a subset of events.
The 10–20% Dip Is the Sweet Spot
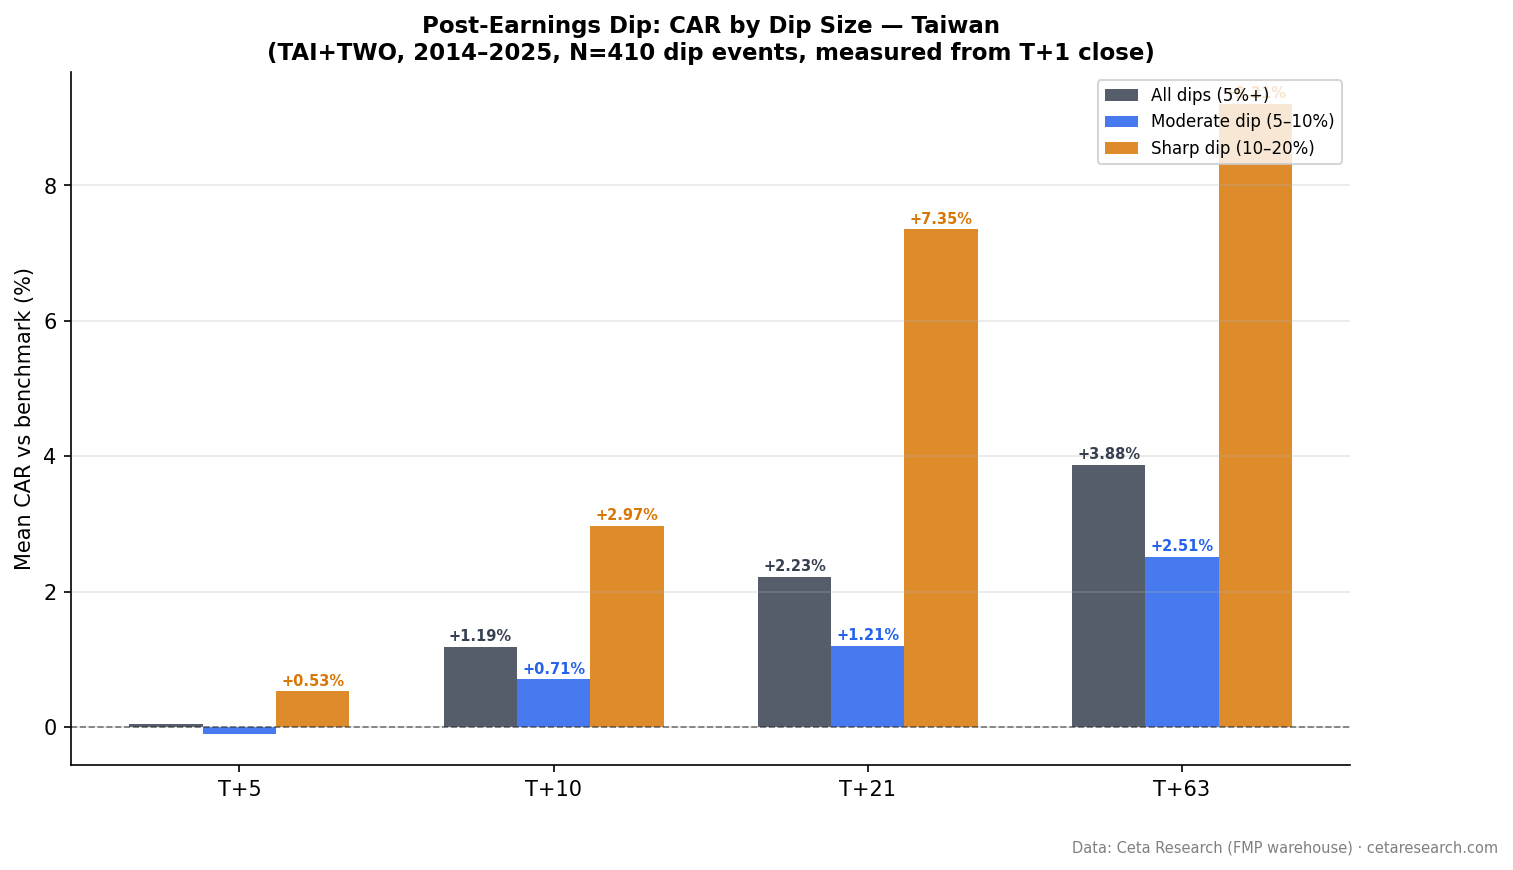
When the sell-off is sharper, the reversion is stronger. The 10–20% dip category (n=77) shows the most striking results.
| Dip Category | N | T+10 CAR | T+21 CAR | t-stat(21) | T+63 CAR | t-stat(63) |
|---|---|---|---|---|---|---|
| All dips (5%+) | 410 | +1.19% | +2.23% | +3.78** | +3.88% | +3.39** |
| Moderate (5–10%) | 333 | +0.71% | +1.21% | +2.09* | +2.51% | +2.16* |
| Sharp (10–20%) | 77 | +2.97% | +7.35% | +3.63** | +9.21% | +2.68** |
The moderate 5–10% dip group is statistically significant at T+21 (t=2.09) and T+63 (t=2.16). Both the moderate and sharp groups show significant reversion. The 10–20% dip group is the strongest: +7.35%** at T+21. A sharp dip after a genuine earnings beat appears to be an identifiable overreaction in Taiwan's market.
The 20%+ category has zero events in the data. Taiwan's beat-and-dip events rarely produce sell-offs that severe with this market cap filter applied.
Why Taiwan?
The honest answer is we don't know for certain. A few factors are consistent with the pattern:
Information diffusion speed. Taiwan's equity market has a large retail investor base (retail trading accounts for over 60% of volume historically). Retail investors often sell first and ask questions later when a stock disappoints despite a headline beat. Institutional re-evaluation happens over weeks, not hours, which creates the recovery window.
Export and semiconductor concentration. A significant portion of Taiwan's qualified universe is in semiconductors and electronics, where earnings beats are often driven by component-level demand data that retail investors don't analyze closely. The disconnect between earnings quality and price reaction may be larger here.
Market cap filter effect. At the NT$10B threshold (approximately $300M USD), we're catching mid-cap Taiwanese companies where analyst coverage is thinner. Less coverage means slower price discovery and a longer drift window.
None of these explanations is definitive. The result is real: 410 events over 11 years with t-stats above 2.5. But the sample is smaller than the US, and the data covers only one market regime (2014–2025 includes some strong bull periods for Taiwan tech).
Practical Implications
The T+10 entry window means a trader buying after two weeks of post-announcement consolidation would have captured most of the T+21 return in the 10–20% dip category. The T+5 period is noise, so early entries are penalized.
The 10–20% dip category with n=77 is too small to trade systematically, but it's a useful screen: when a Taiwan-listed company beats estimates and the stock drops 10–20%, that's worth a closer look at the next trading session.
The moderate 5–10% dip group (n=333) is significant at both T+21 (+1.21%, t=2.09) and T+63 (+2.51%, t=2.16). The reversion holds across both dip categories, not just the sharp-dip subset.
Limitations
Sample size. 410 events over 11 years is workable for an event study, but it's 1/32nd the US sample. The results are statistically significant, but with less stability than a long US time series.
Data coverage. The effective data window is 2014–2025. This covers the Taiwan semiconductor bull market, high COVID-period volatility, and the 2022 rate shock. Results may differ in a structurally different regime.
Benchmark choice. This study uses TAIEX (Taiwan Weighted Index) as the local benchmark. This is the correct comparison for a Taiwan investor. Results measured vs SPY (as in earlier work) were slightly lower due to SPY's different return profile.
T+63 hit rate at 49%. The 3-month return is positive on average, but only 49% of events outperform the benchmark. The mean is driven by a subset of strong recoveries. This isn't a reliable long-term drift. It's a recovery effect that holds on average but not in every case.
Takeaway
Taiwan is the clearest case for mean reversion in a beat-and-dip event study across global markets. The 10–20% dip category in particular shows a recovery pattern that's statistically significant at both T+21 (+7.35% at T+21) and T+63 (+9.21%, t=2.68). If you're tracking Taiwanese equities for earnings plays, a 10%+ post-beat sell-off deserves attention.
The same strategy produces significant negative results in the US and Japan. Canada, Germany, Hong Kong, Korea, Sweden, and India are noise. China shows delayed reversion at T+63 and the UK shows short-term reversion at T+21, both weaker than Taiwan. Taiwan is the exception, not the rule.
Part of a series: Post-earnings dip mean reversion tested across 11 exchanges. See US, India, and the global comparison.
Data: FMP earnings surprises + adjusted prices, 2014–2025. TAI and TWO. Market cap > NT$10B. 410 beat-and-dip events. CAR vs TAIEX, measured from T+1 close.
Past performance does not guarantee future results. This is educational content, not investment advice.


